Altima Multisite Analytics
| 开发者 | altimaweb |
|---|---|
| 更新时间 | 2026年11月22日 10:47 |
| PHP版本: | 7.4 及以上 |
| WordPress版本: | 7.1 |
| 版权: | GPLv2 or later |
| 版权网址: | 版权信息 |
详情介绍:
- Totals across your portfolio: visitors, sessions, key events, Google search clicks and revenue.
- One chart of visitors across all your sites, compared with the previous period.
- A sortable table of every site: visitors and change, engagement, key events, a trend sparkline, a 0–100 health score and the single most important insight.
- "Needs attention" and "Wins" feeds that surface the critical changes across all sites first.
- Pin your most important sites to the top; hide the ones you do not need. Each user's choice is their own.
- Filter by client or group. Export to CSV.
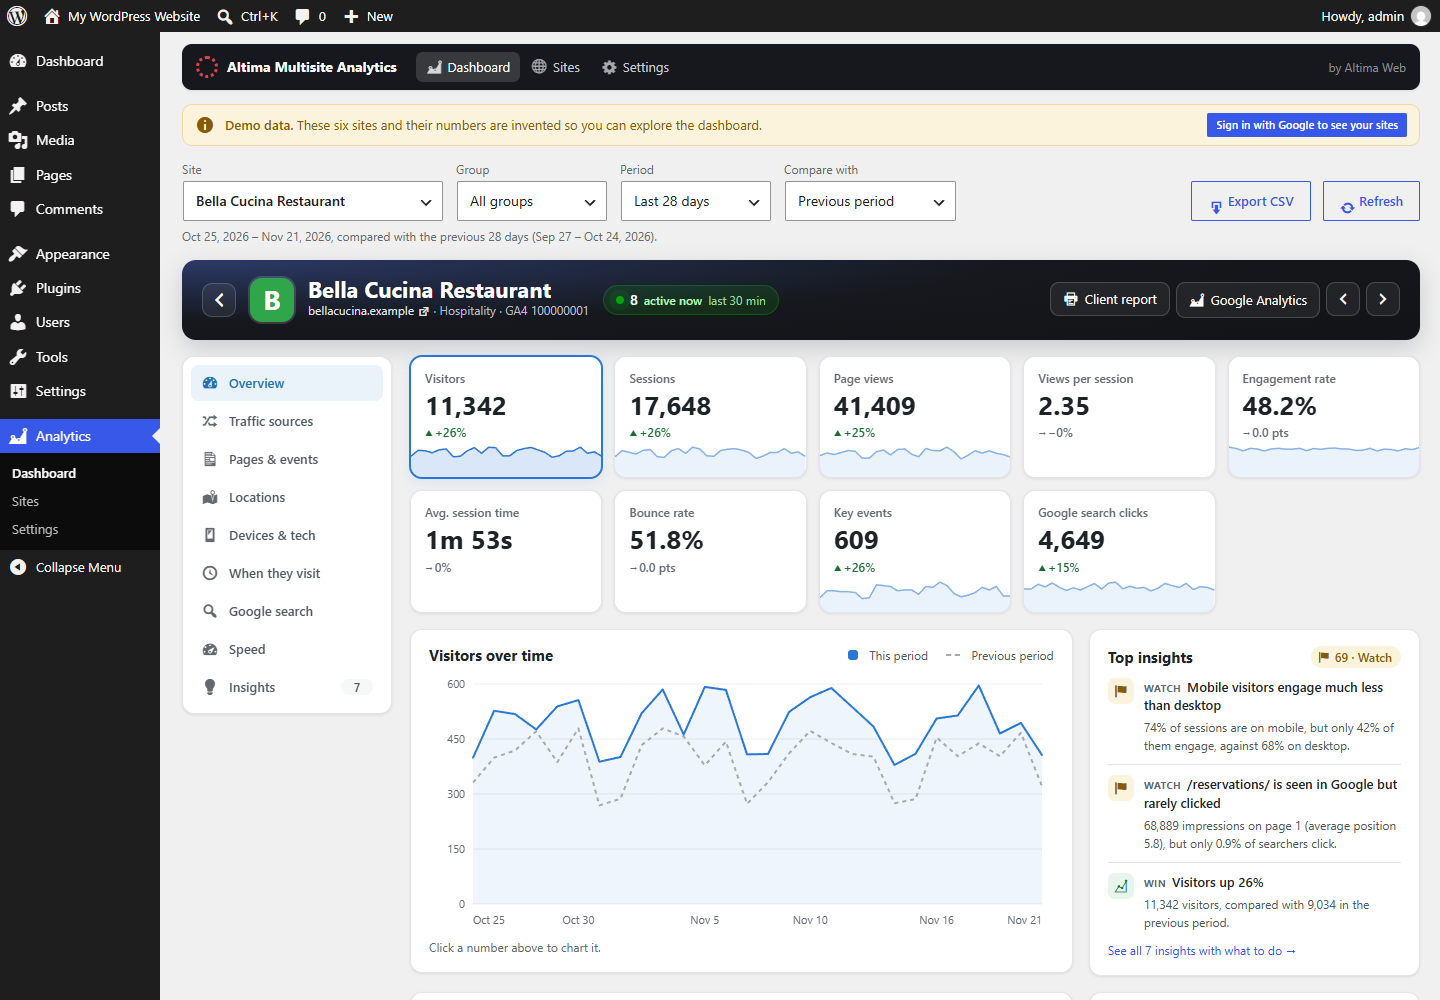
- Overview: clickable number tiles with trend lines (visitors, sessions, page views, views per session, engagement, session time, bounce rate, key events, revenue, search clicks). Click a tile to chart it against the previous period or the same period last year.
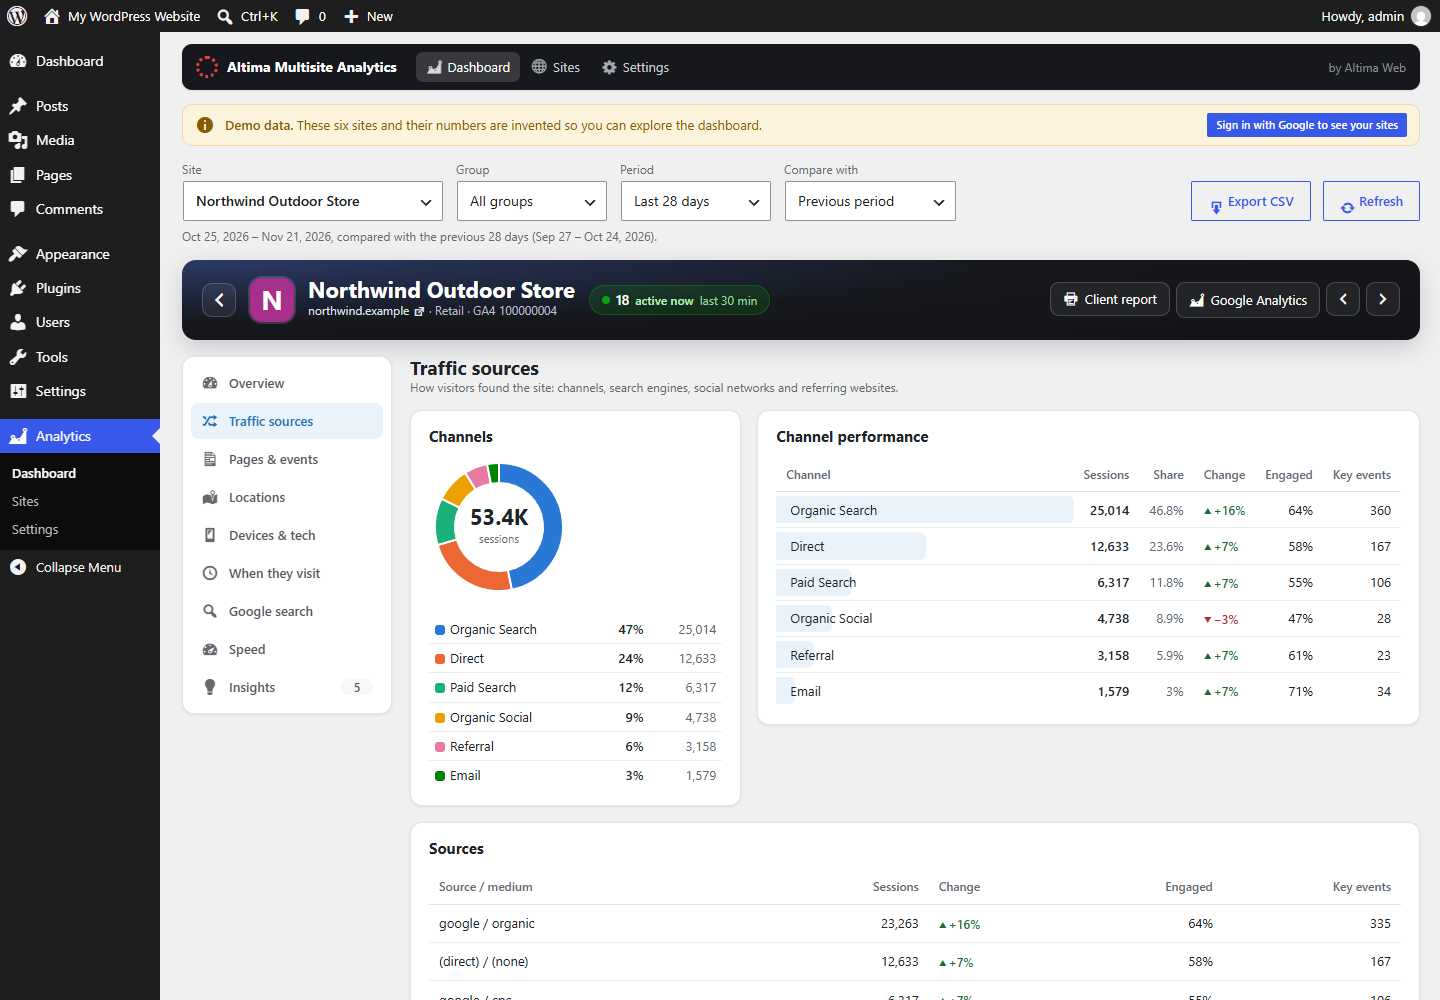
- Traffic sources: a channel donut, channel performance, every source and medium, and referring websites, each with its share.
- Pages & events: top content with page titles, landing pages, and events with key events marked.
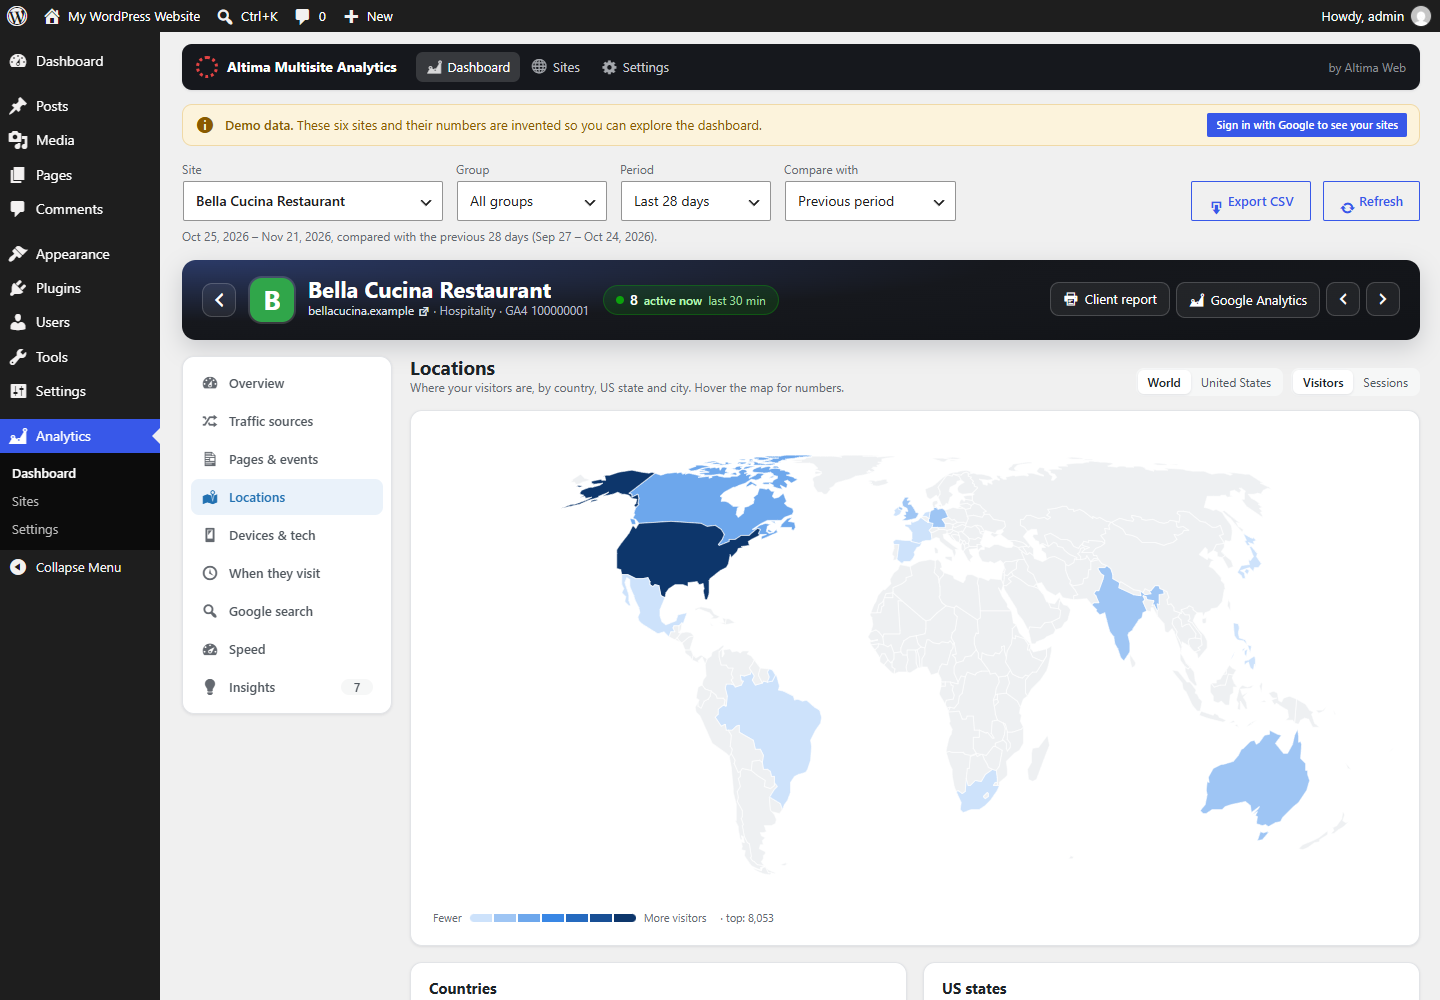
- Locations: a world map and a US state map shaded by visitors or sessions, plus country, state and city tables. The maps are drawn inside the plugin; nothing is loaded from other sites.
- Devices & tech: devices, new vs returning visitors, browsers and operating systems.
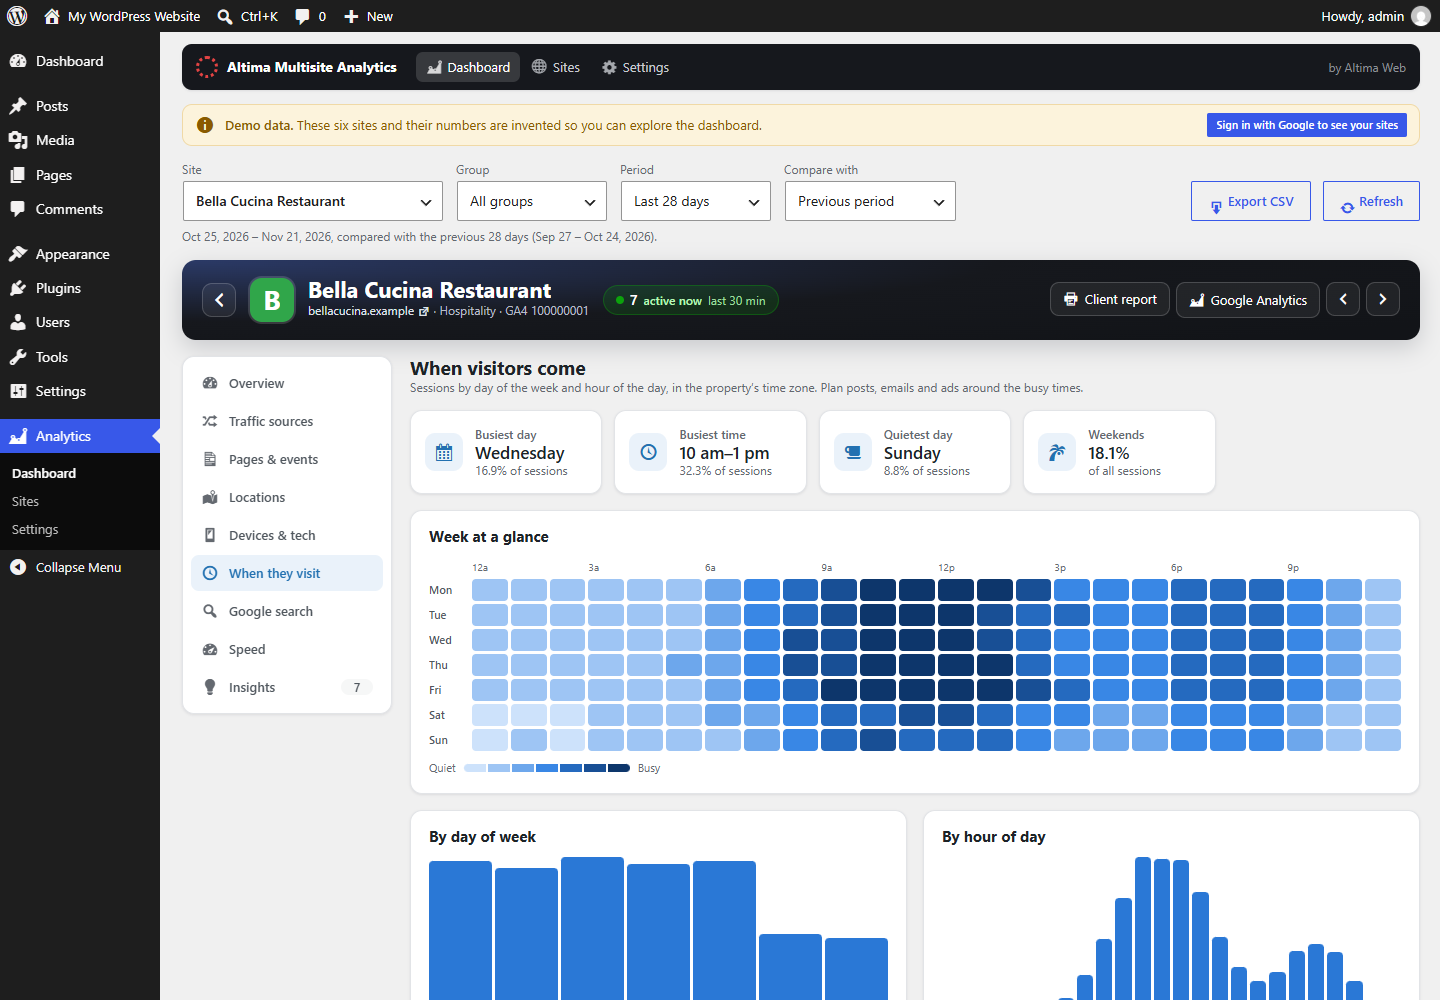
- When they visit: a day-by-hour heatmap with the busiest day, busiest time, quietest day and weekend share, so you can plan posts, emails and ads.
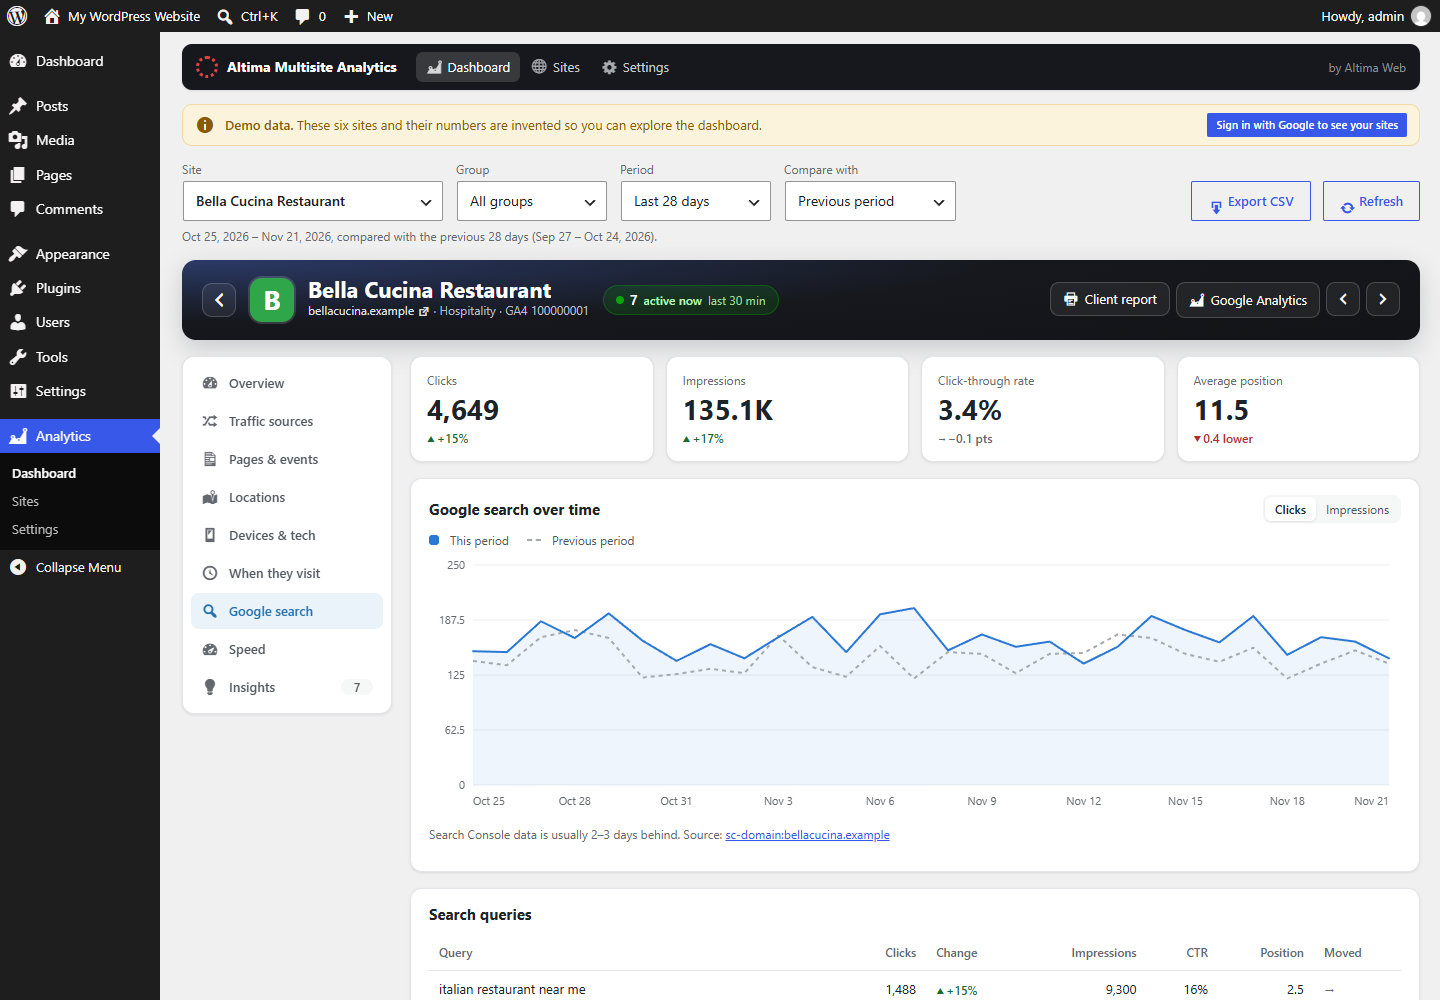
- Google search: clicks, impressions, click-through rate, average position, top queries, pages in search and devices from Search Console, matched to each site automatically.
- Speed: performance score, real-visitor Core Web Vitals (LCP, INP, CLS), lab metrics and Google's biggest suggested fixes, for mobile and desktop.
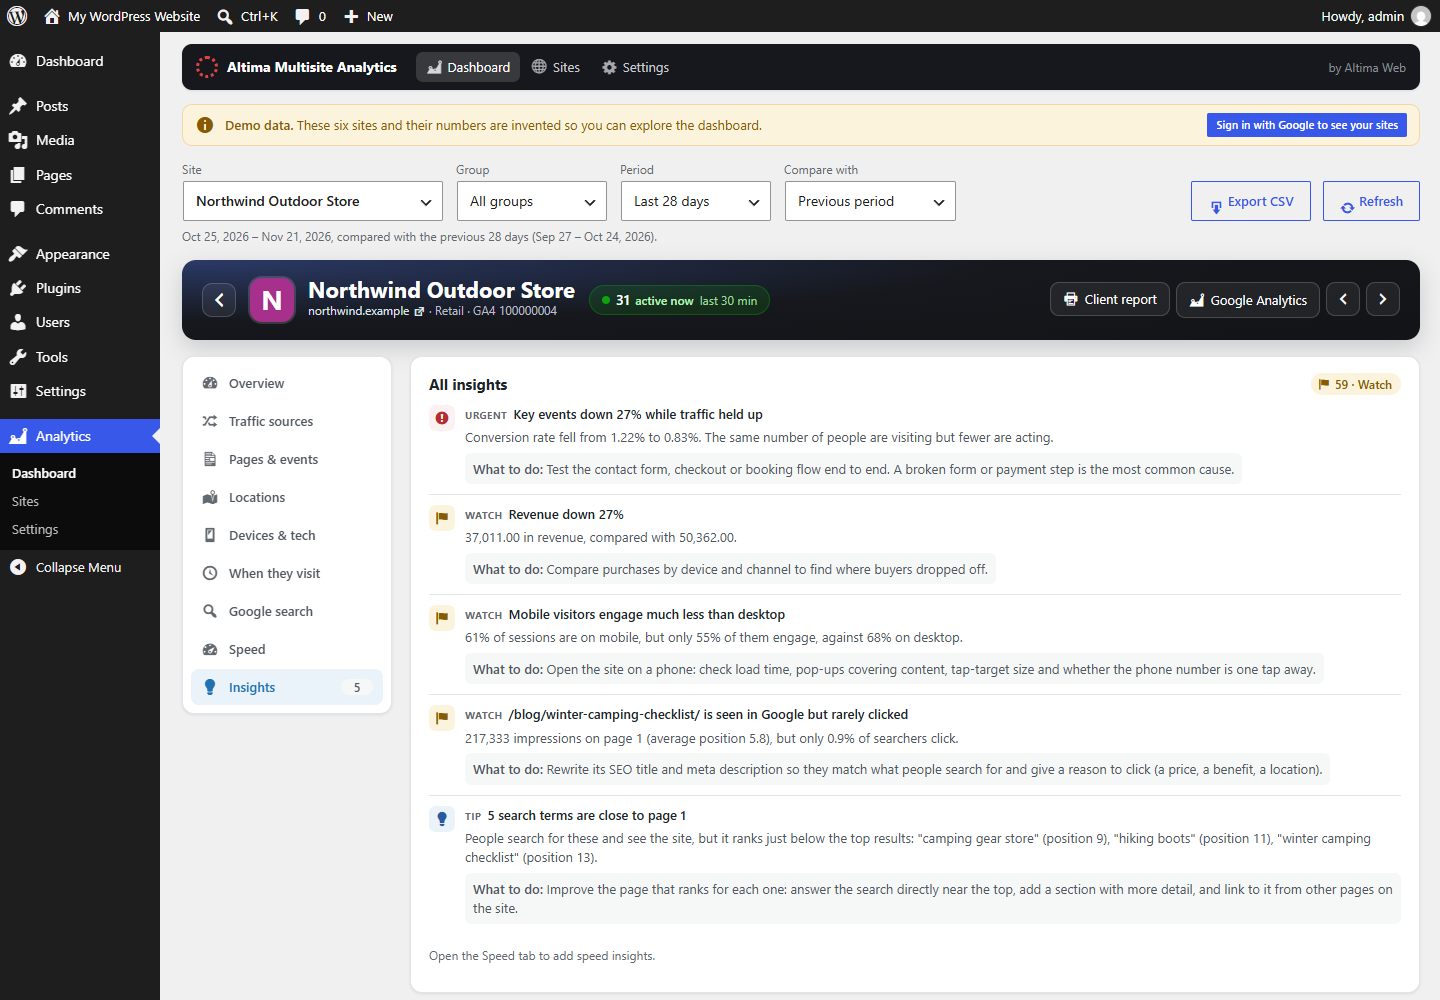
- Insights: what changed, why it matters and what to do next.
- Switch sites from a dropdown or step through them with previous / next. Custom date ranges and year-over-year comparison.
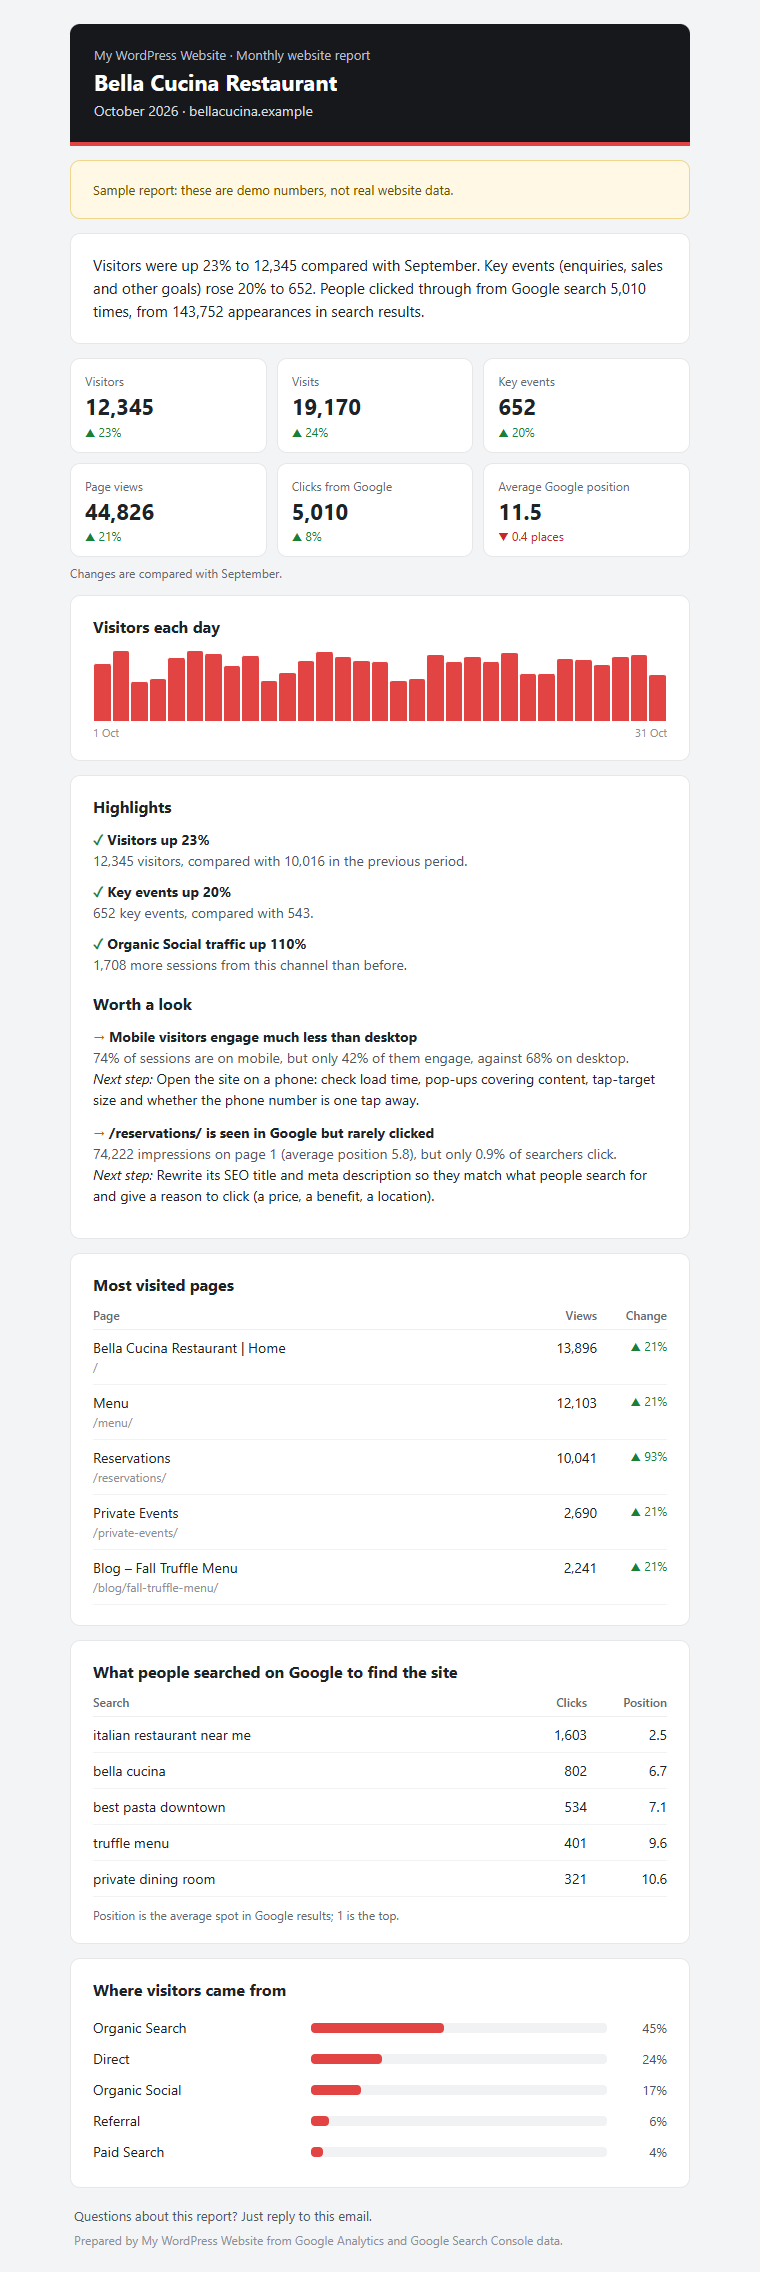
- Client reports by email: a branded, plain-English report for each site, emailed to its client automatically every month or week, plus one-click printable reports.
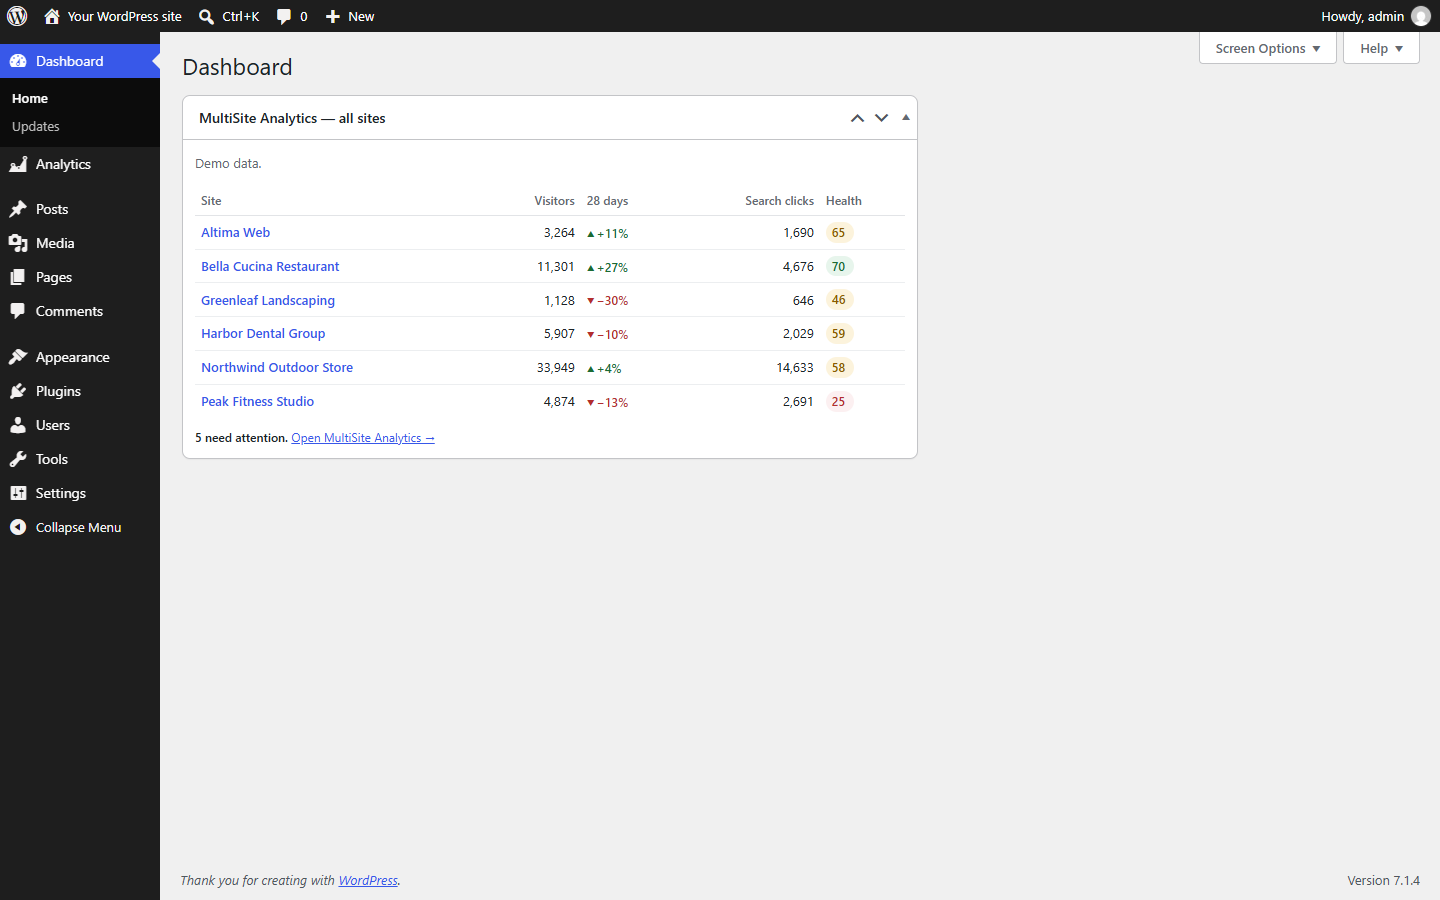
- WP Dashboard widget with every site at a glance, and an Analytics item in the front-end admin bar showing the current page's views, visitors and Google search performance.
- No data recorded for the last few days (the tag was probably removed)
- Visitors, engagement, key events or revenue up or down
- Key events falling while traffic holds (a broken form or checkout)
- Organic search drop, channel gains and losses, over-reliance on one channel
- Pages gaining or losing views
- Mobile visitors engaging much less than desktop
- Bot or spam referrals
- Google search clicks or ranking falling, search terms close to page 1, pages seen in Google but rarely clicked, lost search terms
- Slow pages and failing Core Web Vitals
- Single-day traffic spikes
- No key events configured
altmsa_insights filter.
Built for agencies
- One-click Sign in with Google. Agencies can instead use a Google service account or their own Google Cloud app.
- Read-only access (analytics.readonly). Secrets are stored encrypted.
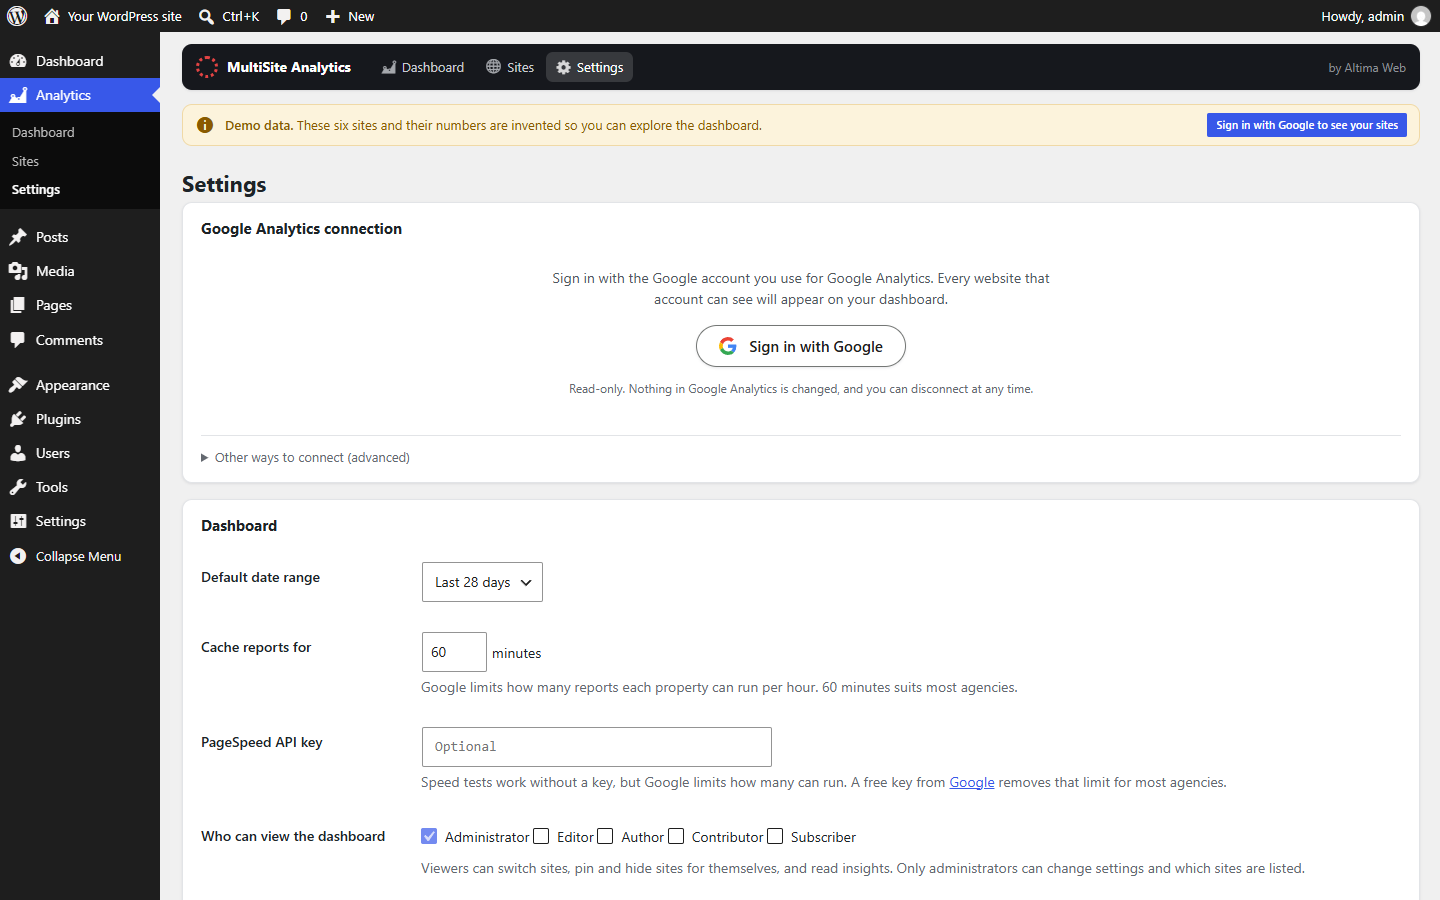
- Choose which roles can view the dashboard. Only administrators change settings.
- Weekly email digest of every site, worst first.
- Reports are cached (60 minutes by default) and pre-warmed daily to stay inside Google's quotas. If Google is unavailable the last good numbers are shown with a notice.
- Demo mode with six sample sites so you can explore before connecting.
安装:
- Plugins → Add New → Upload Plugin, choose the ZIP, activate.
- Analytics → Settings → Sign in with Google, choose the Google account you use for Google Analytics, and allow read-only access.
- Analytics → Sites: untick any properties you don't want, and give them friendly names and client groups.
屏幕截图:
常见问题:
Do I need to install this on every site?
No. Install it once, on any WordPress site (your agency site is ideal). It reads data from Google Analytics directly, so the client sites do not need anything installed.
Does it work with Universal Analytics?
No. Universal Analytics stopped collecting data in 2023. This plugin reads GA4 properties.
My site is missing from the list
The Google account you signed in with can't see it. In Google Analytics, ask the property owner to add that account (Admin → Property access management, role Viewer), then click "Refresh property list from Google" on the Sites screen.
Why does a site show "The service account cannot read this property"?
In Google Analytics open that property → Admin → Property access management, and add the service-account email (shown in Settings) as a Viewer. Adding it at account level covers every property in the account.
How fresh are the numbers?
Reports cover full days up to yesterday and are cached for the time set in Settings. Administrators can click Refresh to fetch fresh data. Realtime visitors update every minute.
更新日志:
- Google reports now go through the WordPress HTTP API, so the site's proxy settings and HTTP filters apply
- A browser request shares one time budget across all reports; slow properties show the saved numbers and refresh in the background
- New site portal: dark site header with live visitors, side navigation and clickable number tiles with trend lines that pick what the chart shows
- New Locations section: world map and US state map shaded by visitors or sessions, with country, state and city tables
- New Devices and tech section: device and new-vs-returning donuts, browsers and operating systems
- New When they visit section: day-by-hour heatmap with busiest day, busiest time and weekend share
- Traffic sources section with channel donut, channel performance, sources and referring websites
- Tables now show each row's share with a bar
- All-sites overview adds a combined visitors trend chart
- Maps are drawn locally; nothing is loaded from other sites
- Renamed to Altima Multisite Analytics (new slug altima-multisite-analytics); settings, site list and Google connection carry over automatically from MultiSite Analytics
- All functions, options and handles now use the altmsa prefix
- Added nonce checks to the Google sign-in return steps
- Site icons are now drawn locally instead of being fetched from Google
- Menu no longer claims a fixed position near the top of the admin menu
- The sign-in relay and uptime monitor moved out of this plugin into a separate service plugin
- At most 4 report requests to Google at a time per site, well inside Google's per-property limit shared with Site Kit and other tools
- Slow Google Analytics properties no longer show timeout errors: the dashboard shows the last saved report straight away and fetches a fresh one in the background, where it can wait up to 3 minutes
- Saved reports are kept when the plugin is updated
- Fixed: busy Google Analytics properties no longer fail with 'cURL error 28: Operation timed out'. Reports for a site are now requested from Google all at once instead of one batch, and the plugin waits up to 60 seconds
- Fixed: the printable client report no longer starts with a blank page
- Client report emails: engagement changes are shown in percentage points
- Readme: screenshots, a shorter summary and updated tags for the WordPress.org directory
- Client reports: a site with no Google Analytics visits in the period is not emailed to the client; the preview explains why and the log records it
- Client reports: '1 time' instead of '1 times'
- Client reports: chart dates now follow the site's timezone
- Client reports: web addresses with accents or non-English letters are shown readably
- Client reports: a figure that is zero in both periods shows 'no change'
- New: Client reports. A branded, plain-English report for each site, emailed to its client every month or week: key numbers and changes, a visitors chart, highlights and next steps, top pages, top Google searches and where visitors came from
- Set each site's client email on the Sites screen, with Preview and Send test links; choose frequency, sender name, reply-to and a personal note under Settings
- Reports are sent once per period, in small batches, and retried the next day if sending fails; a log shows what was sent
- New for the Altima Web sign-in service: an hourly uptime monitor that emails an alert when a sign-in address fails twice in a row, and again when it recovers
- Sign in with Google now uses a dedicated Altima Web sign-in service (connect.altimaweb.com), with automatic fallback to a backup if it cannot be reached
- Clearer message when the sign-in service is unavailable; saved numbers keep showing
- Admin scripts now load from a file instead of inline
- Settings and Sites input sanitised on arrival
- Tested with WordPress 7.1 and PHP 8.5
- Passes the WordPress.org Plugin Check
- Fixed: speed tests now authenticate with the site's Google connection (Google no longer allows anonymous PageSpeed tests)
- Fixed: Google errors are no longer hidden behind Cloudflare 'Bad gateway' pages
- Search Console: clicks, impressions, CTR, position, top queries and pages, auto-matched per site, plus search insights
- PageSpeed Insights and Core Web Vitals per site (mobile and desktop) with the biggest fixes
- More Analytics: page titles, landing pages, events, new vs returning, cities
- Site view redesigned with tabs; custom date ranges; site icons; Search clicks in the all-sites table
- WP Dashboard widget and front-end admin-bar page stats
- Printable client report
- Optional PageSpeed API key setting
- Fixed: 'No data recorded' alarm no longer fires on low-traffic sites where quiet days are normal
- Sites with under 50 sessions now show 'Low traffic' instead of an unreliable health score
- Fixed: Sign in with Google could fail with 'The sign-in expired or was started somewhere else' when the button was triggered twice (prefetch, double-click, second tab) or the host's cache dropped temporary data. Each sign-in is now stored separately for up to an hour
- Connection service: the Google app ID and secret can now be saved in Analytics -> Settings on altimaweb.com, no wp-config.php edit needed
- Sign in with Google now checks the sign-in service first and shows a clear message if it is unavailable, instead of a raw error page
- Connection service has a status address for setup checks
- One-click Sign in with Google: no Google Cloud setup or keys for users
- Built-in connection service, switched on for altimaweb.com with two wp-config lines
- Simpler Settings screen; service account and own-app options moved under Advanced
- Fixed: a cancelled Google sign-in now says so instead of showing a generic error
- External services section added to the readme
- First release.