
Aurora Heatmap
详情介绍:
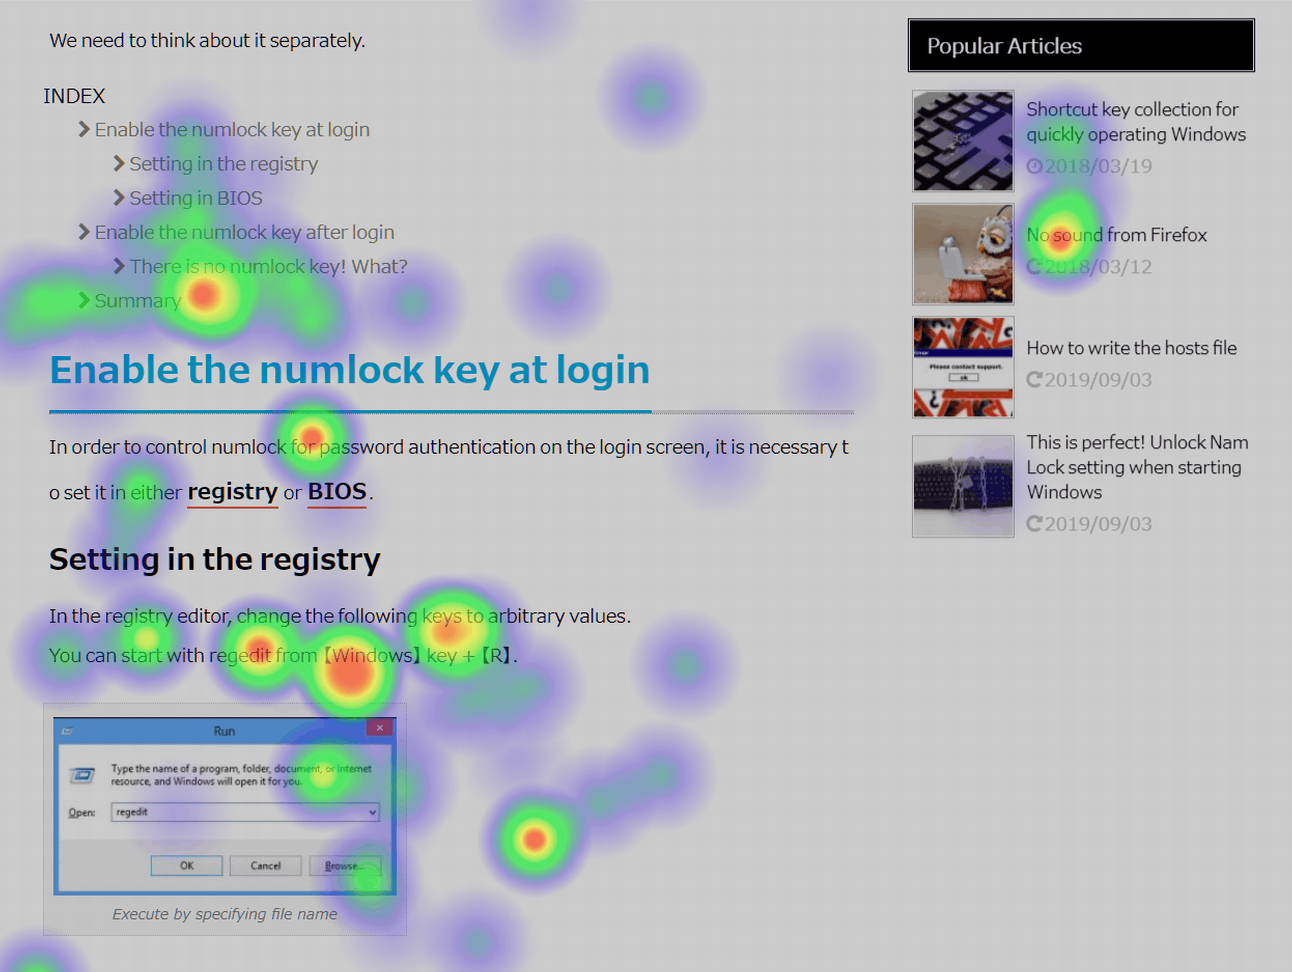
- Where do users see and move through the content?
- Whether the user is not confused?
- Are you guiding users well?
- Conversion rate
- Are you missing out on prospects and readers?
- How is it evaluated by Google?
- WP Rocket
- W3 Total Cache
- WP Super Cache
- User tracking
- Send recorded data to external server
- Use of cookies
- Record of personally identifiable data including IP address
安装:
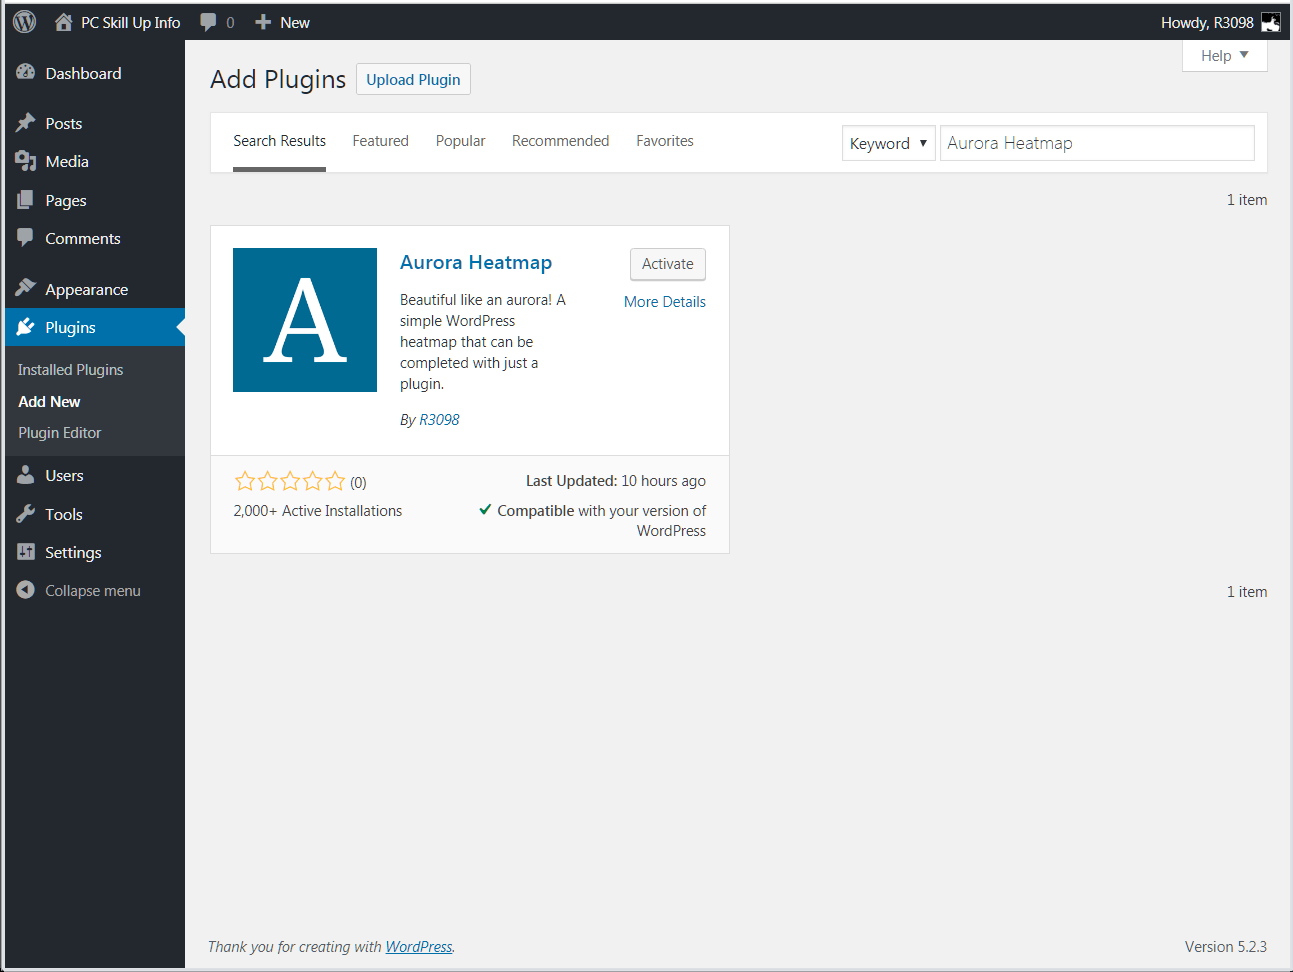
- Login to your WordPress admin.
- Click on the plugins tab.
- Click Add New and search for “Aurora Heatmap”.
- Click Install Now, then Activate Plugin.
- The analysis will start, and after a while you will be able to see the actions of the visitors.
屏幕截图:
常见问题:
Is there a limit to the number of pages or PV that can be analyzed?
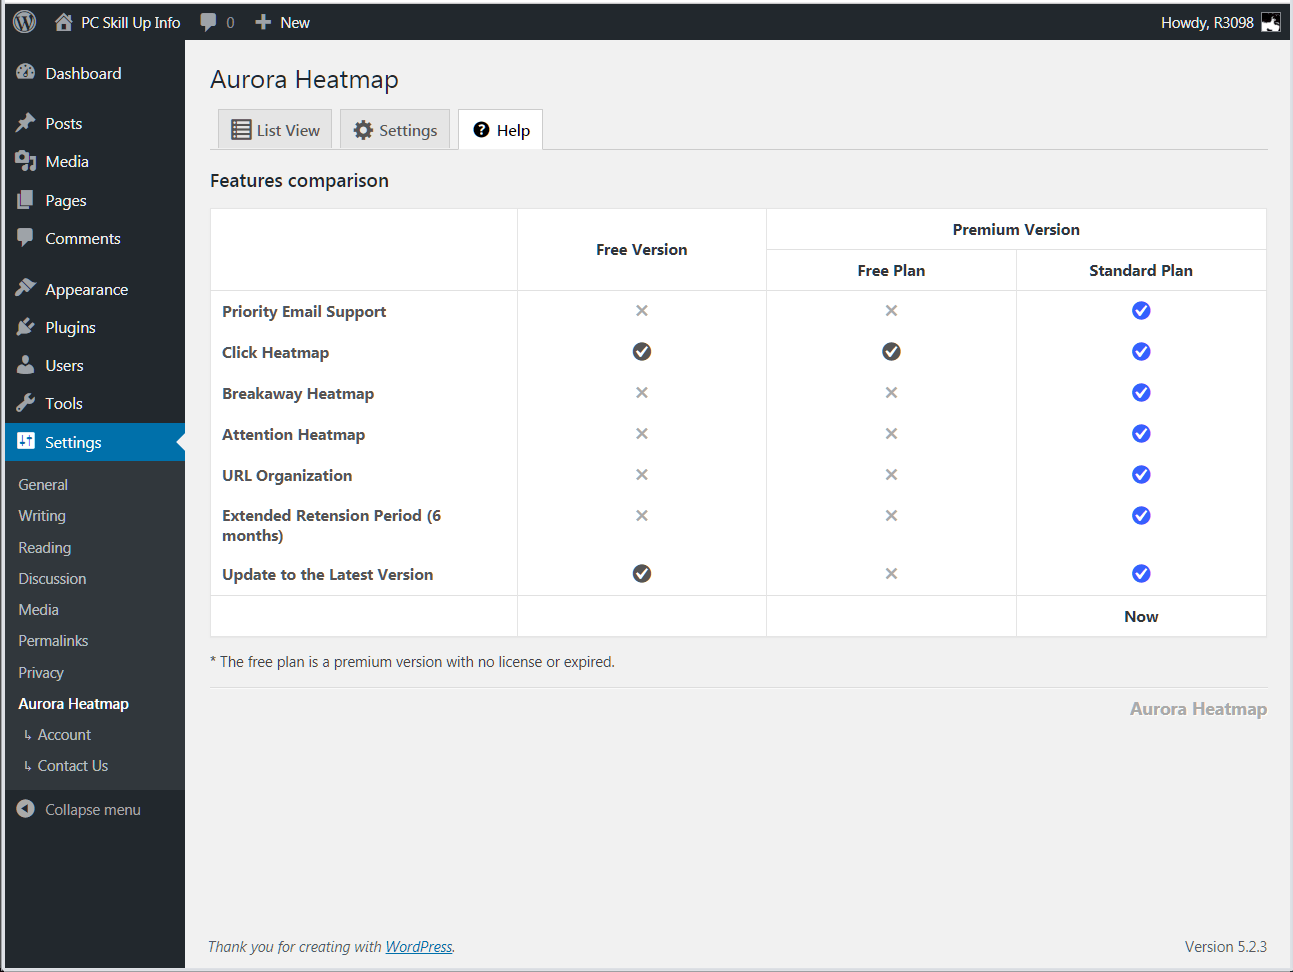
= Is account registration or contract required to use Heatmap? Unlike many heatmap services, Aurora Heatmap works completely within your WordPress. No account registration or contract is required. However, a monthly or annual license agreement is required to use the premium version. There are no restrictions on the paid version or the free version.
When viewing a mobile heatmap from a PC, the PC page is displayed.
If you switch using User-Agent instead of responsive design, view the heatmap from your mobile.
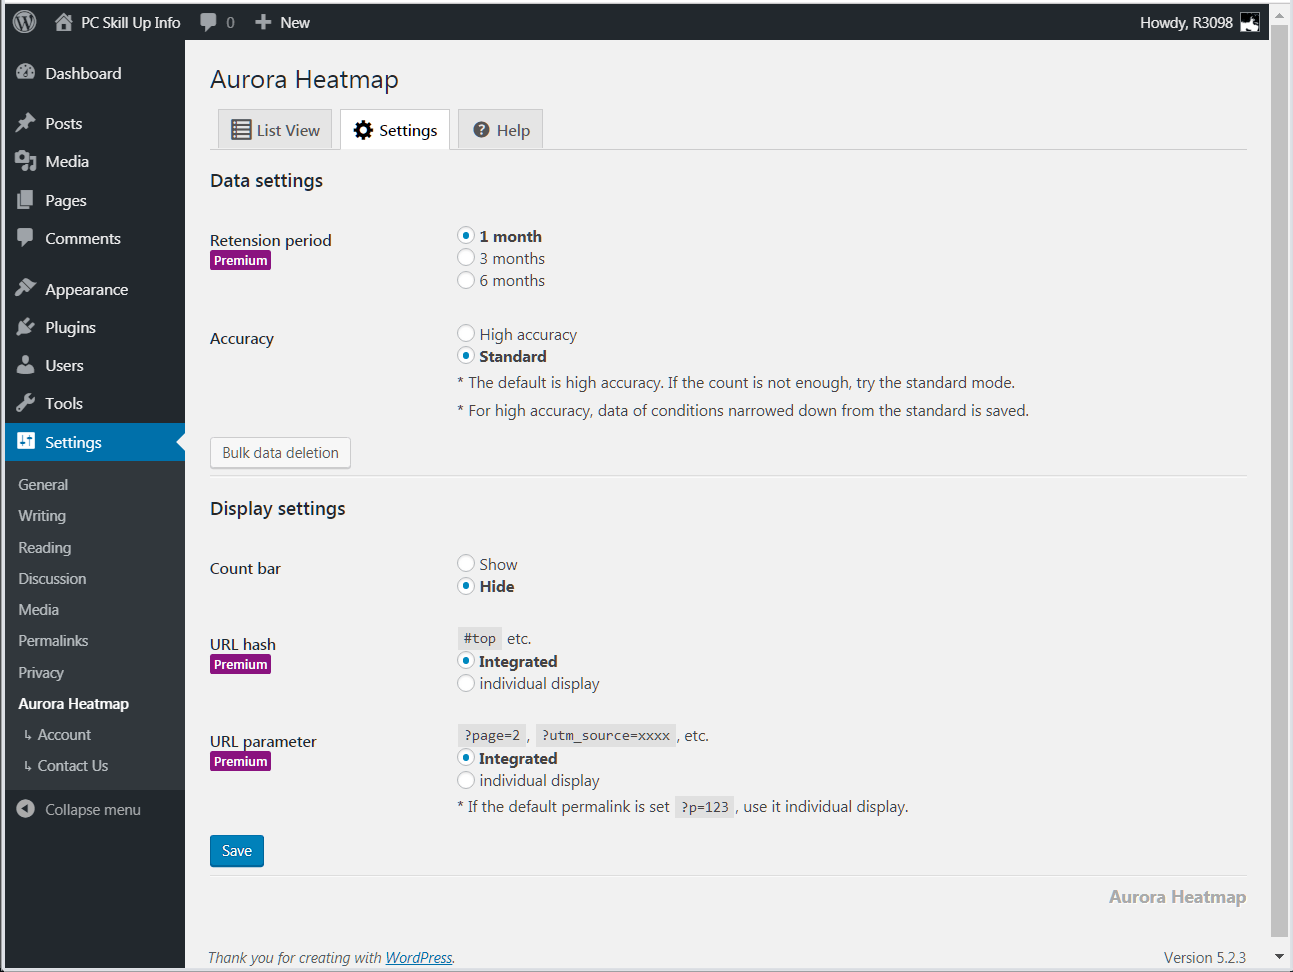
Which should be used for accuracy setting?
The recommendation is high accuracy, which selects the data to be recorded for an accurate heatmap. If the recording is not enough, try Standard. Please note the following points when changing the accuracy setting.
- High accuracy - the previous standard data will be deleted.
- Standard - from that point, recording of standard data begins.
How long can I see the heatmap after installing the plugin?
Depending on the number of visits to the site, data will accumulate in a few hours to two days.
Is the heat map displayed in real time?
User behavior is recorded via Ajax communication as often as necessary. The recorded data will be displayed on the screen after reloading.
About 3 days have passed, but there seems to be no data.
Counting may not occur for sites with extremely low access. Make sure that there is an inflow to the site. Also, if you are using a cache plugin, the analysis script may not be output on the page, so delete the cache once.
It is not counted even if you access it yourself.
In order to ensure the reliability of the analysis data, the data to be acquired with a specific algorithm is selected. Administrator access is also excluded.
There should be access to various pages, but only the top page is recorded.
In case of default permalink ( ?p=123 format ), it will be a parameter format URL.
If the URL parameter of the setting is integration, it will be regarded as the top page, so please set it to individual display.
It seems that the number of records recorded in the heatmap is smaller than the number of accesses.
The purpose of heatmaps is not to count absolute numbers, but to understand trends in user behavior. In order to improve the reliability of data, the data to be recorded is selected with a specific algorithm. The number of records is also affected by the accuracy setting.
If the permalink is changed, will the heatmap data be inherited?
In the current specification, the heatmap data is stored in association with the URL, so if you change the URL by changing the permalink or post slug, it will be treated as a separate page.
Can I see a heatmap on my smartphone?
From 1.0.2, it is now possible to check from the dashboard on a mobile device.
What is a count bar?
It shows how many data are recorded at which position on the vertical axis. Should help with behavior analysis.
Will the recorded data not leak to the outside?
In both the free version and paid version, there is no transmission of heat map data to external servers.
更新日志:
- Requirements increased to PHP 7.0.
- Added two settings, for avoiding frequent communication in the premium version.
- Fixed PHP deprecated notice on PHP 8.x.
- Fixed PHP deprecated notice on PHP 8.x.
- Tested up to WordPress 6.4.
- Update the Freemius SDK in the premium version.
- Now, jQuery agnostic.
- Minified JavaScript.
- Tested up to WordPress 6.3.
- Update the Freemius SDK in the premium version.
- Fixed PHP Parse Error prior to PHP 7.1.
- Tested up to WordPress 6.0.1.
- Content can be manipulated on the heatmap display screen.
- The default value of the unread detection feature of the premium version has been lowered to make it easier to react.
- The bundled library has been updated.
- Fixed minor issues.
- Tested up to WordPress 5.9.
- Fixed a wpdb::prepare Warning that occur during initial setup.
- Fixed a MySQL syntax error that occur during initial setup in version 1.5.0 or later.
- Fixed a bug that the count bar was not displayed in version 1.5.0.
- "Weekly email" has been implemented in the premium version.
- You can also view each click, breakaway, attention heatmaps on the unread detection tab in the premium version.
- Update the Freemius SDK in the premium version.
- Fixed an issue where concentric drawing appears at the origin of the click heatmap.
- The setting of "Number of drawing points" was reflected in the count bar in the click heatmap.
- Fixed a bug that is recorded as 0 when coordinates and sizes are not integers.
- Fixed 503 error when displaying heatmap with serialize_precision=100 due to old php.ini.
- Fixed some case where the title and URL were incorrect in the heatmap list.
- Update the Freemius SDK in the premium version.
- Fixed the heatmap drawing shifting depending on the style of the html and body elements.
- Reduced errors associated with JavaScript combine.
- Update the Freemius SDK in the premium version. Some screens now support Japanese.
- Reduced errors related to async attribute jQuery.
- Fixed an error associated with JavaScript combining.
- Add the files that were missing in the free version 1.4.6.
- Fixed some warnings about browser detection and improved cache compatibility.
- Fixed the data of unread detection not deleted by bulk deletion or individual deletion.
- Fixed DB error during install.
- Added setting of Ajax delay time.
- Fixed the unread detection graph not displaying correctly.
- Fixed unexpected cache in some environments.
- Fixed syntax error in PHP 5.6.
- Tested up to WordPress 5.4.
- "Unread detection" has been implemented in the premium version.
- Added setting to report non-singular pages.
- The page that overlays the heatmap display is now a logged-out page.
- Support WordPress - General settings - Timezone.
- Improved daily cron process.
- Optimized database and SQL.
- Fixed a bug that CGI version PHP could not save settings, bulk data deletion, and delete data for each page.
- Fixed a bug where the data migration process from 1.2.x was incorrectly executed after migration.
- Fixed DB migration from old version not being performed properly.
- Fixed that data was not deleted when the premium version was uninstalled.
- Fixed an error in the List View that occurred in some environments.
- Fixed an error that occurred during a new installation.
- "URL Optimization" is now available in the free version.
- "Advanced URL Optimization" has been implemented in the premium version.
- URL parameters for WordPress are always displayed individually.
- Improved search in list view.
- Fixed XSS vulnerability in list view title.
- Fixed an SQL error that occurred during automatic deletion of old data.
- Adjusted the algorithm for judging the reading position. (Premium version only)
- Fixed that the legend image file name change in 1.1.0 was not reflected in the free version.
- Fixed a syntax error that occurred in some JavaScript minify.
- Supported mobile drawing with wp_is_mobile() function when displaying mobile heatmap on PC.
- Other minor bug fixes and improvements.
- Fixed a syntax error that occurred in some JavaScript minify.
- Reduced the output processing of breakaway and attention heatmap.
- Added number of drawing points to settings for performance control.
- Fixed click heatmap drawing being interrupted under certain conditions.
- Improved list view usability on mobile.
- Adjust list order.
- The interface has been redesigned so that all types of heatmaps can be listed. As a result, previous tabs for PC and mobile have been abolished.
- The search function by title and URL was implemented.
- In order to reduce the database capacity, the data to be saved is narrowed down by the accuracy setting.
- Fixed a 503 error when displaying the breakaway / attention heatmap under certain conditions.
- Fix side effect when combining JavaScript.
- The heatmap can be viewed from mobile.
- Add description and legend above list.
- Initial release