
BloomWatcher – Live Server & Site Health Dashboard
| 开发者 |
ksseven
freemius |
|---|---|
| 更新时间 | 2026年7月5日 16:49 |
| PHP版本: | 7.4 及以上 |
| WordPress版本: | 7.0 |
| 版权: | GPLv2 or later |
| 版权网址: | 版权信息 |
详情介绍:
- CPU usage, load average and core count (animated ring gauge)
- Memory used / total
- Disk usage for the WordPress filesystem
- Network throughput and connection count
- Top processes by CPU
- System uptime, hostname, kernel, OS
- PHP version, SAPI, memory limit, OPcache status
- Database engine, version, connection status, query count
- Web server detection (nginx / Apache / LiteSpeed) and version
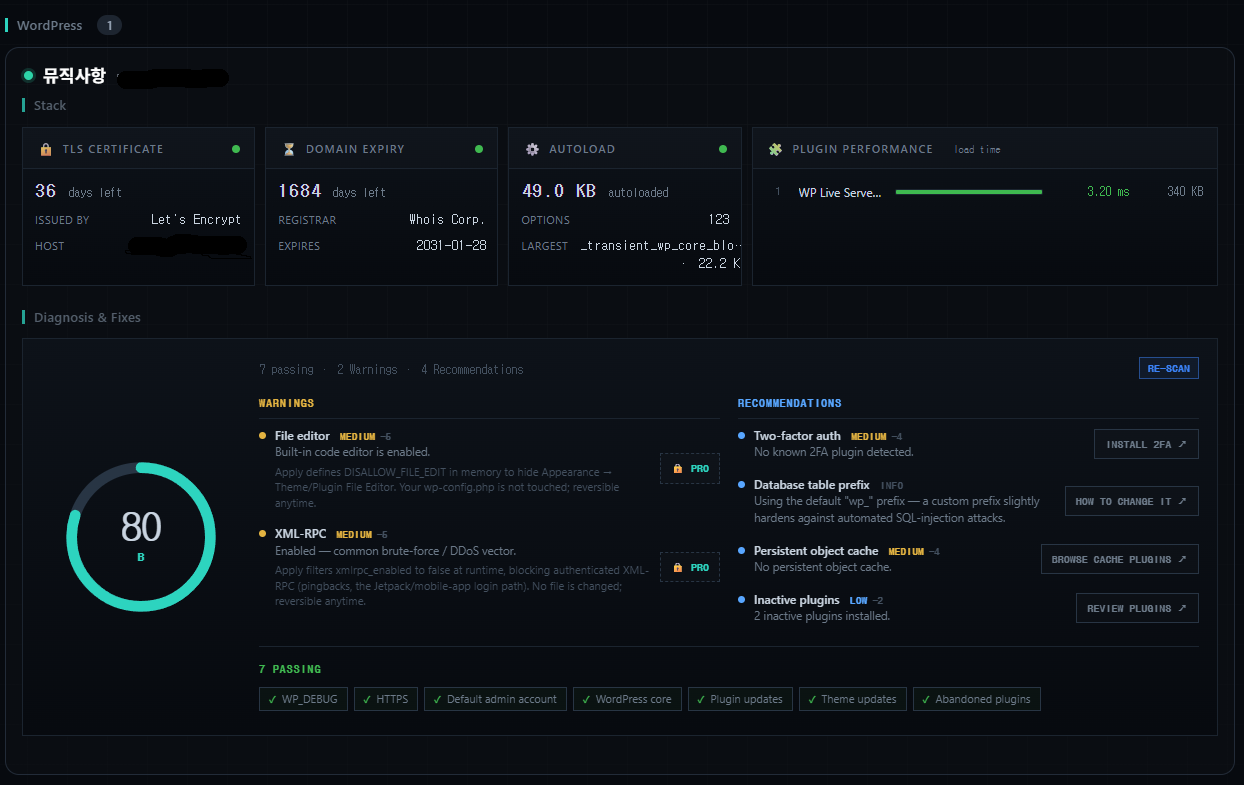
- SSL certificate days-until-expiry with issuer
- DNS check — does the domain actually point at this server?
- Domain expiry — domain registration expiry date and registrar, via RDAP
- WordPress version and pending core / plugin / theme updates
- Autoload analysis — find the autoloaded options bloating every request
- Health Diagnosis — a scored (0–100) security, performance and maintenance check-up with an A–D grade and prioritised findings, refreshed on demand
- Live updates every few seconds, Apple-Home-style cards, dark mode, mobile friendly
- Degrades gracefully on restricted hosts (shows "N/A" instead of breaking)
- Plugin Performance — rank your active plugins by how long they take to load (and how much memory they use) on every request, so you can spot the heavyweights. Measured by a tiny, optional must-use profiler file that you install with one click (and can remove just as easily) — see the FAQ for exactly what it adds.
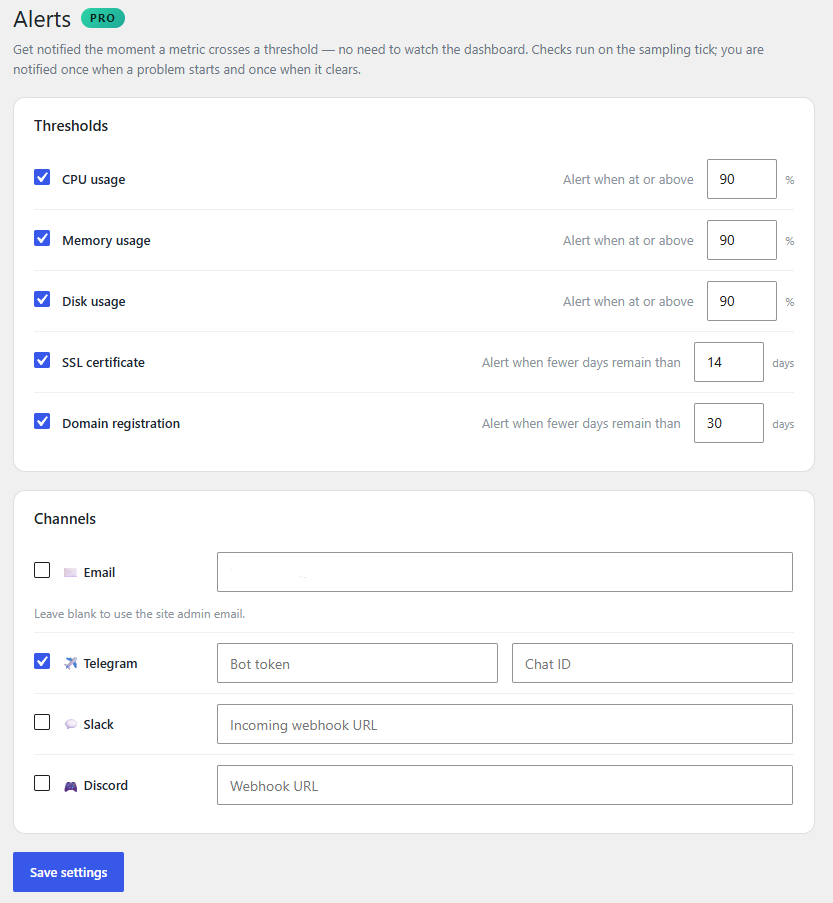
- Smart alerts — get notified the moment CPU, memory, disk, SSL or domain expiry crosses a threshold, via email, Telegram, Slack or Discord.
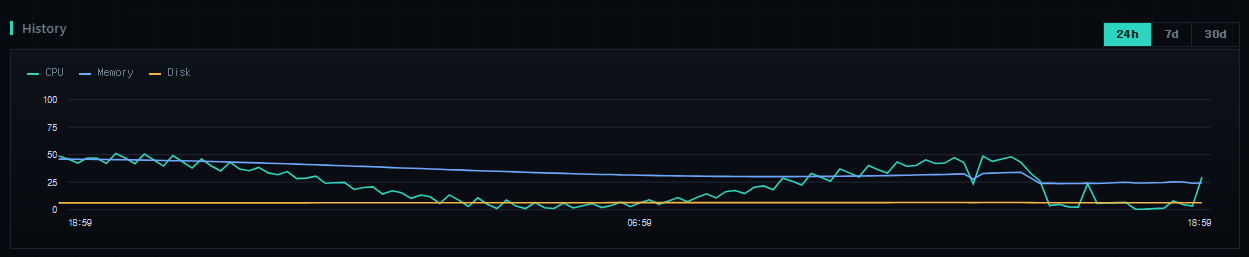
- History & trends — 24h / 7d / 30d graphs of your key metrics.
- One-click fixes — apply and undo safe hardening (disable XML-RPC, disable the file editor) straight from the diagnosis, fully reversible.
- Multi-site hub — watch every site you manage from one dashboard (up to 20 sites).
- Centralized alerts across all your sites and domains.
- PDF client reports (coming soon).
安装:
- In wp-admin go to Plugins → Add New, search for "BloomWatcher", and click Install Now (or upload the
bloomwatcherfolder to/wp-content/plugins/). - Activate the plugin.
- Open Server Monitor in the admin menu — the dashboard starts streaming immediately.
/proc and are intended for VPS / dedicated hosts. On restricted shared hosting those cards show "N/A"; everything else still works.屏幕截图:
常见问题:
Does this work on shared hosting?
Partially. Shared hosts usually block /proc and shell functions, so CPU/RAM/uptime may show "N/A". PHP, database, SSL, domain, DNS and WordPress cards still work everywhere.
Does it send my data anywhere?
Your server and WordPress metrics never leave your site — they're read on your server and shown only in your wp-admin. The plugin makes a few functional lookups (api.wordpress.org for abandoned-plugin dates, your own site's TLS cert, your own domain's expiry via rdap.org) and uses Freemius for licensing/updates and optional opt-in diagnostics. See the "External services" section above for the full list, including links to each service's terms and privacy policy.
Do I need to set up a cron job?
No. History and alerts sample on wp-cron by default, which needs zero setup. Power users can optionally drive sampling from a real system cron for tighter timing.
Will email alerts work on my server?
Email alerts use WordPress's mail system, so they work wherever your site can already send email. If your server can't send mail, use the Telegram, Slack or Discord channels — those send over outbound HTTPS and don't need a mail server.
How does monitoring multiple sites work?
Each site exposes its metrics behind a per-site connection key sent in a custom header, so no server configuration is needed. A hub then reads its sibling sites and shows them together. (Multi-site monitoring is an Agency feature.)
Is it really free?
Yes — the complete monitoring dashboard and health diagnosis are free for a single site, forever. Pro and Agency add automation (plugin performance, alerts, history, one-click fixes) and multi-site management.
What is the Plugin Performance profiler file, and is it added automatically?
No — nothing is added automatically. Plugin Performance (a Pro feature) works by placing one small, fixed PHP file at wp-content/mu-plugins/wlsm-profiler.php. That file is a bundled, human-readable file shipped inside the plugin — it is never generated on the fly. It is added only when you click "Enable Plugin Performance" on the dashboard, after a clear notice telling you exactly what it does and where it goes. All it does is time how long each plugin takes to load and write a small summary; it changes nothing else on your site. You can remove it from the same panel at any time, and it is removed automatically when you deactivate the plugin.
更新日志:
- New (Free): Domain Expiry is now a free feature — the dashboard shows your domain's registration expiry date and registrar (via an outbound rdap.org lookup, documented under "External services"). Previously Pro-only. Threshold alerts on domain expiry remain a Pro feature.
- Fix: premium feature visibility now follows the licensed plan precisely — the Plugin Performance card and the Alerts submenu appear only when the plan includes them, so an expired license (or a downgrade) correctly hides them instead of lingering.
- Health Diagnosis: passing checks now show a clear, affirmative result (e.g. "HTTPS enabled", "No default admin", "WordPress up to date") instead of just the check name.
- UI: unified the dashboard typography to the system sans-serif font for a cleaner, more consistent look.
- Compliance: Plugin Performance is now a Pro feature, and its optional must-use profiler file (wp-content/mu-plugins/wlsm-profiler.php) is never installed automatically. It is a fixed, bundled file — never generated on the fly — that is added only after you explicitly opt in from the dashboard (with a clear notice about what it adds and where), and it can be removed again from the same panel. The free build ships none of this code and writes nothing to wp-content/mu-plugins.
- Compliance: the free build no longer ships any one-click-fix code. The Apply/Undo control — its REST route, the diagnosis action and all front-end handling — now lives entirely in the Pro add-on; the free diagnosis links to the official WordPress hardening guide instead. No built-in feature is gated by a license check.
- Compliance: the one-click hardening fix and the Plugin Performance profiler are no longer locked behind upgrade prompts — one-click fixes moved entirely into the Pro add-on (the free diagnosis links to manual instructions), and Plugin Performance is now fully free.
- Compliance: the domain-registration (RDAP) lookup moved into the Pro add-on, so the free build makes no outbound RDAP call. The free build's only external services are now api.wordpress.org (abandoned-plugin dates) and Freemius (licensing/updates), both documented under "External services" with terms and privacy links.
- Maintenance: removed dead code and added a full uninstall cleanup (options, transients and the time-series table).
- Renamed the plugin to "BloomWatcher". No functional changes — internal identifiers and your settings are untouched.
- Packaging: the Freemius SDK is now managed with Composer under
vendor/, per WordPress.org guidance for bundling third-party libraries. No functional changes.
- Renamed the plugin to "Live Server Monitor". No functional changes — internal identifiers and your settings are untouched.
- New: Domain registration expiry (RDAP) and a DNS "points here?" check.
- New: Autoload options analysis — surface the autoloaded data weighing down every request.
- New (Pro): Smart alerts engine — CPU, RAM, disk, SSL and domain-expiry thresholds delivered to email, Telegram, Slack or Discord, with start/clear notifications.
- New (Pro): History & trends — 24h / 7d / 30d graphs backed by a lightweight time-series sampler that runs on wp-cron (no setup).
- New (Agency): Multi-site hub — monitor up to 20 connected sites from one dashboard, with centralized alerts across all sites and domains.
- New: translations for German, French, Japanese, Spanish, Brazilian Portuguese, Italian, Dutch, Russian and Korean.
- Hardening: security review pass (SSRF-guarded site connections, HTTPS-only hub, throttled sampling endpoint, license-gating integrity).
- New: Plugin Performance panel — ranks active plugins by how long they take to load (and how much memory they allocate) on each request, so you can spot the heavyweights at a glance.
- Measured by a tiny must-use drop-in (
wlsm-profiler.php) installed automatically on activation and removed on deactivation; it hooks WordPress's per-pluginplugin_loadedevent, samples with near-zero overhead and writes a throttled, smoothed summary. Shows "load time" honestly — boot cost per request, not full runtime. - New:
GET /wlsm/v1/performanceendpoint (admin-only) backing the panel.
- New: actionable Health Diagnosis. Each finding now offers the right next step — a one-click "Apply" for fixes the plugin can safely enforce itself (disable XML-RPC, disable the file editor, both reversible), a deep link to the correct admin screen for things it can't do for you (updates, install 2FA, object cache), or a plain explanation when only a server change will do.
- New:
POST /wlsm/v1/fixendpoint (admin-only) backing the one-click fixes, stored as a reversible option.
- New: Health Diagnosis panel — a scored (0–100) security / performance / maintenance check-up with warnings, recommendations and fix hints, served from a separate cached
/wlsm/v1/healthendpoint with a manual re-scan. - Performance: CPU usage is now sampled across polls instead of blocking the request with a 200ms sleep.
- Performance: the SSL certificate probe is cached (12h) instead of running a TLS handshake on every poll.
- Initial MVP: live single-server dashboard with CPU, memory, disk, system, PHP, database, web server, SSL and WordPress cards.