Chart Expert
| 开发者 | sagortouch |
|---|---|
| 更新时间 | 2015年4月22日 15:29 |
| PHP版本: | 3.3 及以上 |
| WordPress版本: | 4.1.2 |
| 版权: | GPLv2 or later |
| 版权网址: | 版权信息 |
详情介绍:
PmZez Chart Expert by http://pmzez.com/plugins/chart-expert/
Chart Expert gives some classes to each element when generating, so you can define a custom style by the class and it's possible to extend the structure directly by D3 and C3.
Go to TinyMCE Editor >> Find chart icon and generate chart .
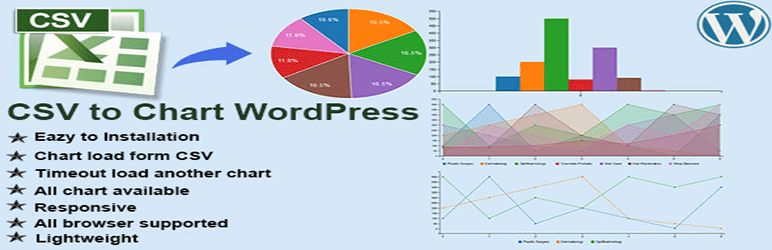
Plugin Features
- Eazy to Installation
- Timeout load another chart
- All browser supported
- Chart load form CSV
- All chart available
- Lightweight
- Responsive & many More
- Create a post / page and then enable TinyMCE , find chart icon and this icon for generate following chart :
- Insert div ID for plot this chart . Div id may any name like: chart_one, chart_two etc.
- Insert CSV file URL that which data you want to plot to chart . That's why you need to first upload a csv data file with header name .
- Select chart type like : Bar, Pie, Donut, Line etc.
- Advanced : Actually this section for timeout feature : First load data from one CSV file and then default 1 sec later the chart load another CSV data . For more example : http://pmzez.com/plugins/chart-expert/
- Insert div ID for plot this chart . Div id may any name like: chart_one, chart_two etc.
- Insert CSV file URL that which data you want to plot to chart . That's why you need to first upload a csv data file with header name .
- Input timeout period , like 1000 for 1 sec, 5000 for 5 sec .
- Insert another CSV file URL that which data you want to plot to chart after default 1 sec later . That's why you need to first upload a another csv data file with header name . For more example : http://pmzez.com/plugins/chart-expert/
- Select chart type like : Bar, Pie, Donut, Line etc.
- Enjoy
安装:
- Install it as a regular WordPress plugin.
- After Installed this plugin will work properly.
- Go to TinyMCE Editor >> Find chart icon and generate chart .
- Install Chart Expert plugin and active it on WordPress deshboard plugin section.
- Create a post / page and then enable TinyMCE , find chart icon and this icon for generate following chart :
- Insert div ID for plot this chart . Div id may any name like: chart_one, chart_two etc.
- Insert CSV file URL that which data you want to plot to chart . That's why you need to first upload a csv data file with header name .
- Select chart type like : Bar, Pie, Donut, Line etc.
- Advanced : Actually this section for timeout feature : First load data from one CSV file and then default 1 sec later the chart load another CSV data . For more example : http://pmzez.com/plugins/chart-expert/
- Insert div ID for plot this chart . Div id may any name like: chart_one, chart_two etc.
- Insert CSV file URL that which data you want to plot to chart . That's why you need to first upload a csv data file with header name .
- Input timeout period , like 1000 for 1 sec, 5000 for 5 sec .
- Insert another CSV file URL that which data you want to plot to chart after default 1 sec later . That's why you need to first upload a another csv data file with header name . For more example : http://pmzez.com/plugins/chart-expert/
- Select chart type like : Bar, Pie, Donut, Line etc.
- Enjoy
更新日志:
- Initial Release - 1.0