Chartsy
| 开发者 | cosmicinfosoftware |
|---|---|
| 更新时间 | 2026年6月14日 00:26 |
| PHP版本: | 7.4 及以上 |
| WordPress版本: | 7.0 |
| 版权: | GPLv2 or later |
| 版权网址: | 版权信息 |
详情介绍:
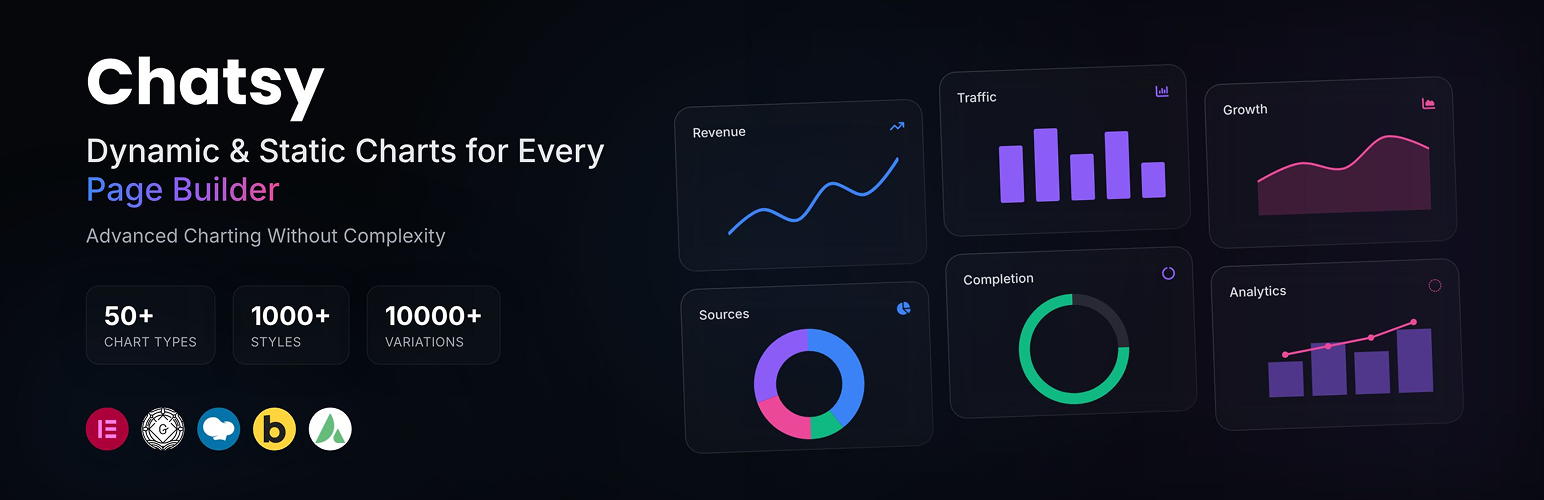
Chartsy is a powerful WordPress chart plugin built with ApexCharts.js, designed to create responsive, interactive, and visually appealing charts. It uses high-performance SVG rendering to ensure smooth animations, precise interactivity, and sharp display across all devices. Whether you're showcasing business data or complex analytics, Chartsy makes your data easy to understand and engaging.
With an intuitive admin interface and real-time preview, you can quickly customize charts by adjusting colors, fonts, legends, and axes. This flexibility helps you build professional data visualizations faster and more efficiently without any complexity.
安装:
- Upload the plugin to the
/wp-content/plugins/chartsy/directory or install it via Plugins > Add New. - Activate the plugin through the Plugins menu in WordPress.
- Navigate to Chartsy in the WordPress admin menu to create a new chart.
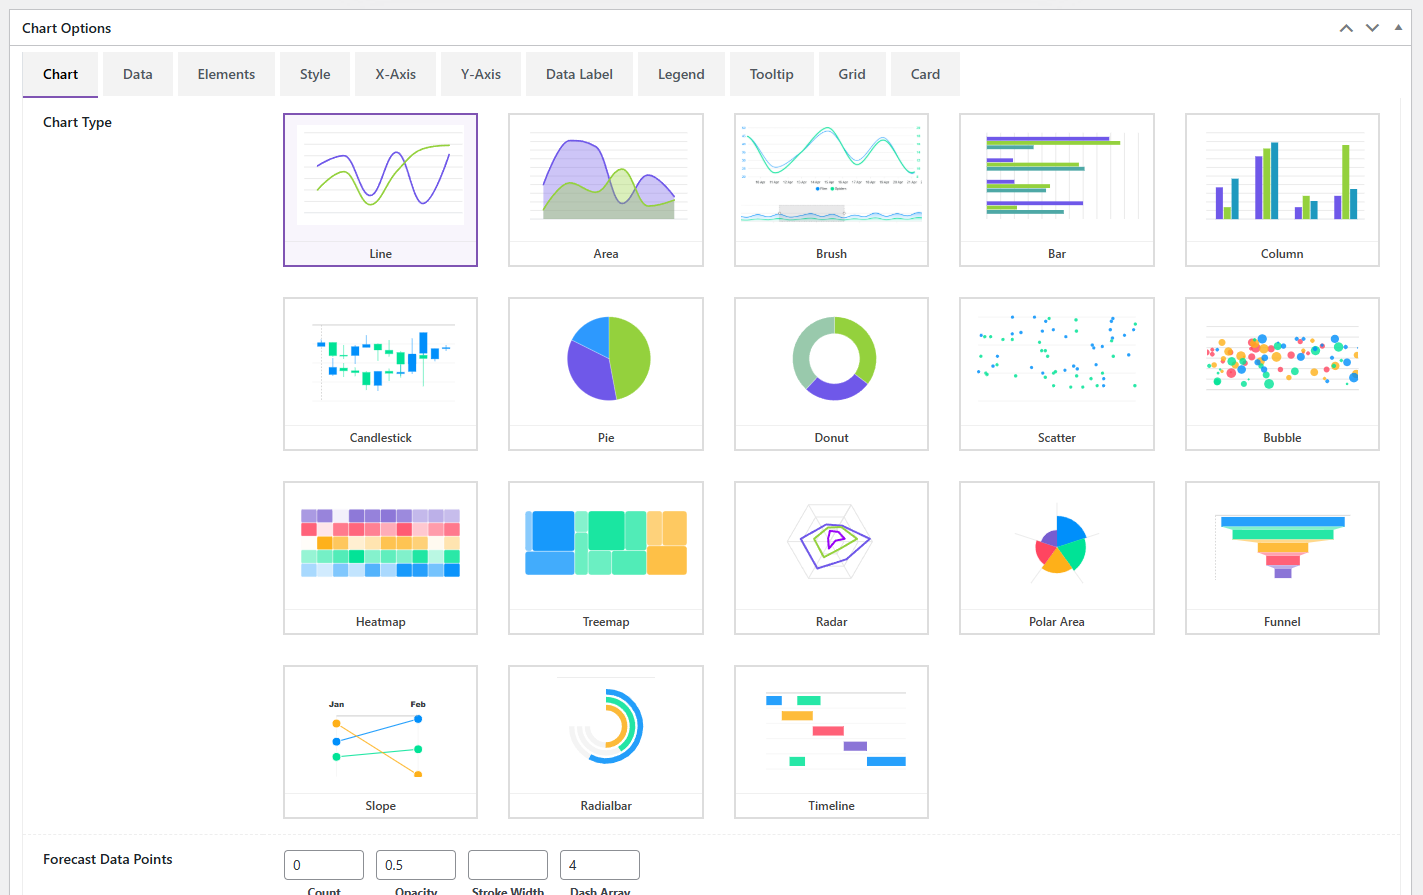
- Choose your desired chart type and configure your data.
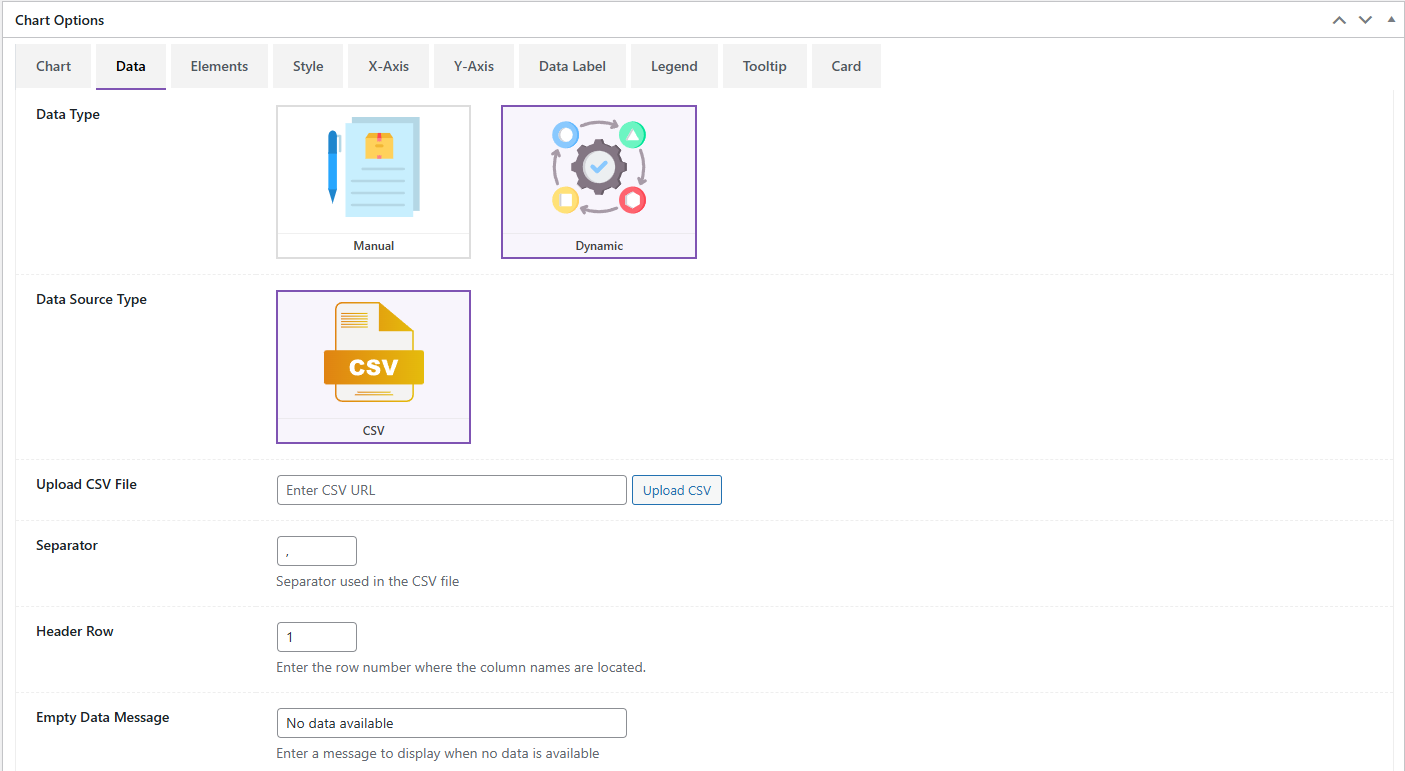
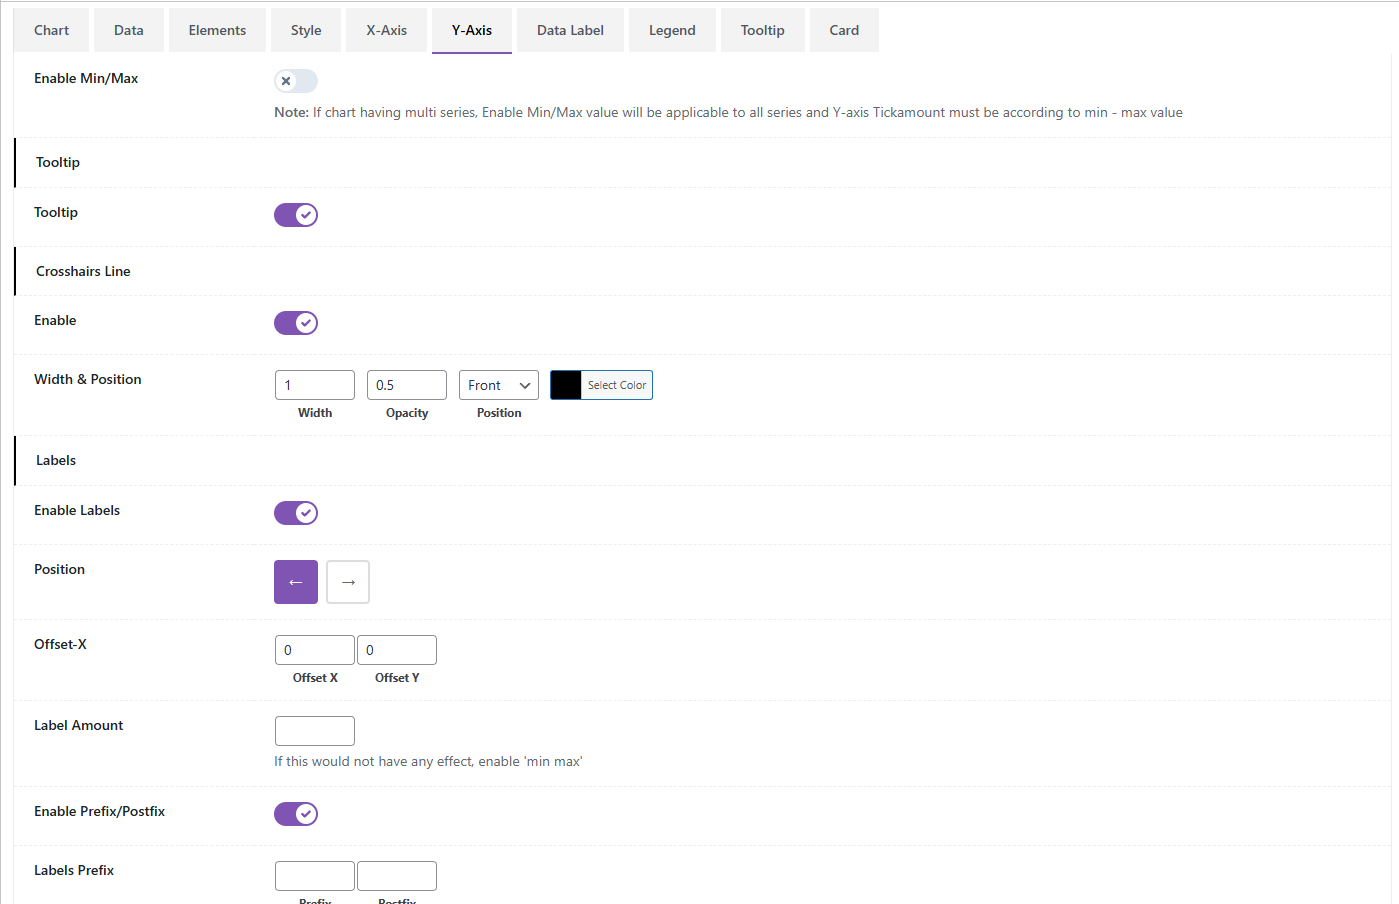
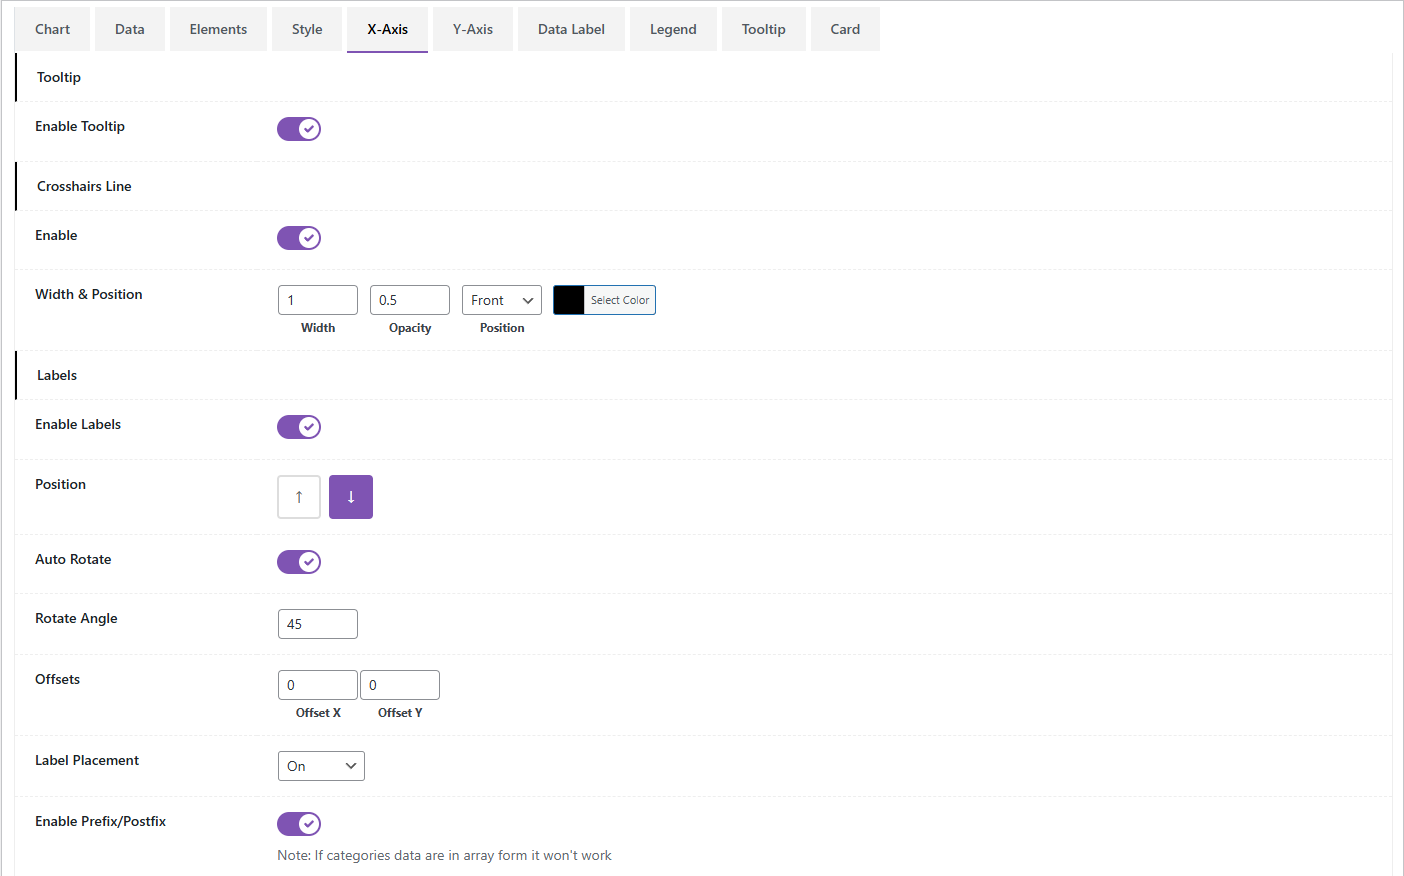
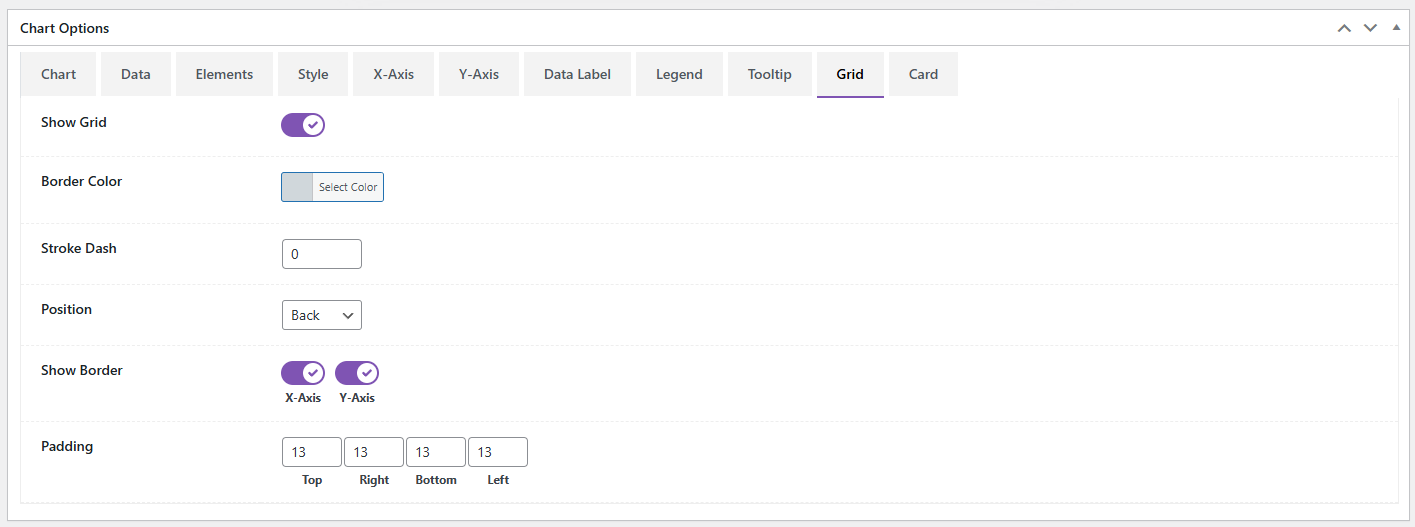
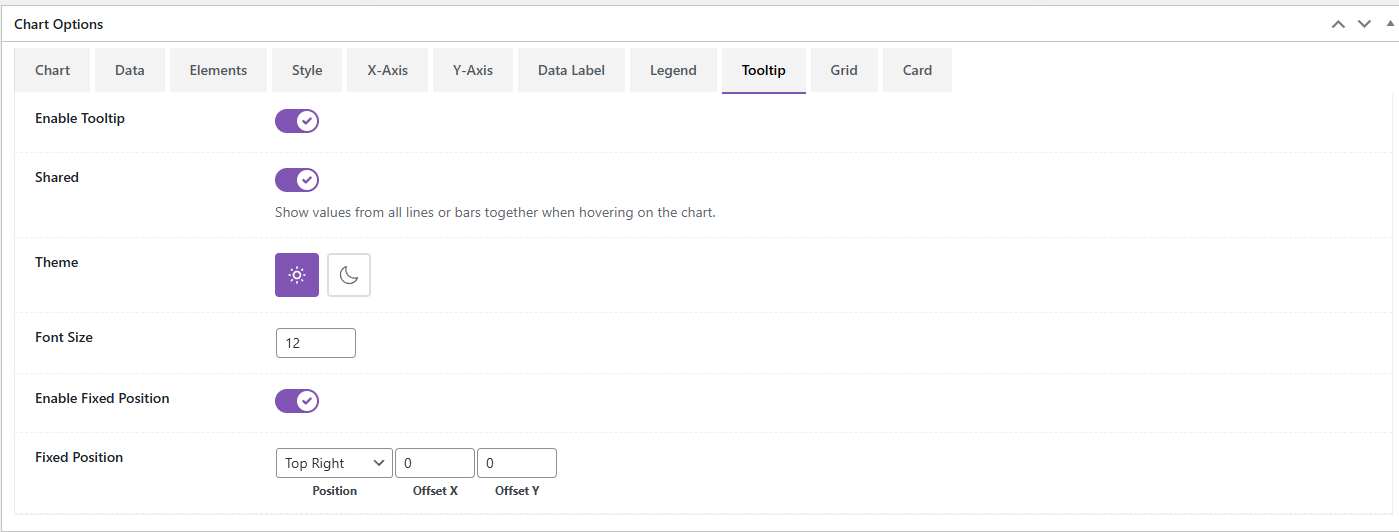
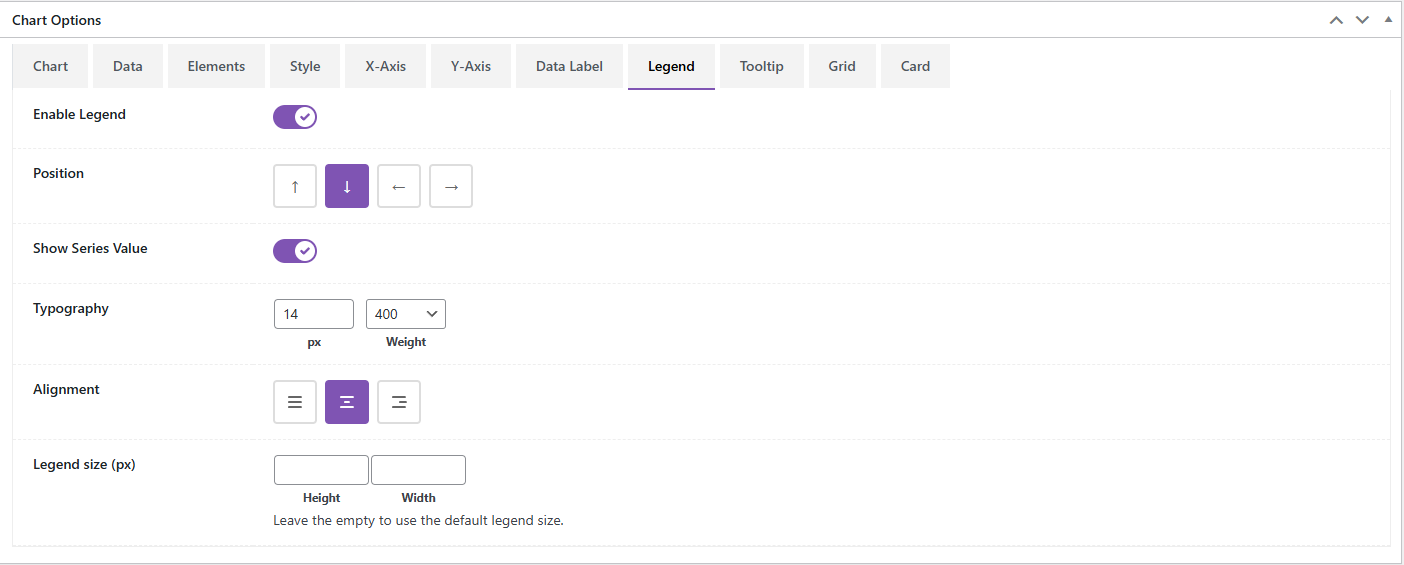
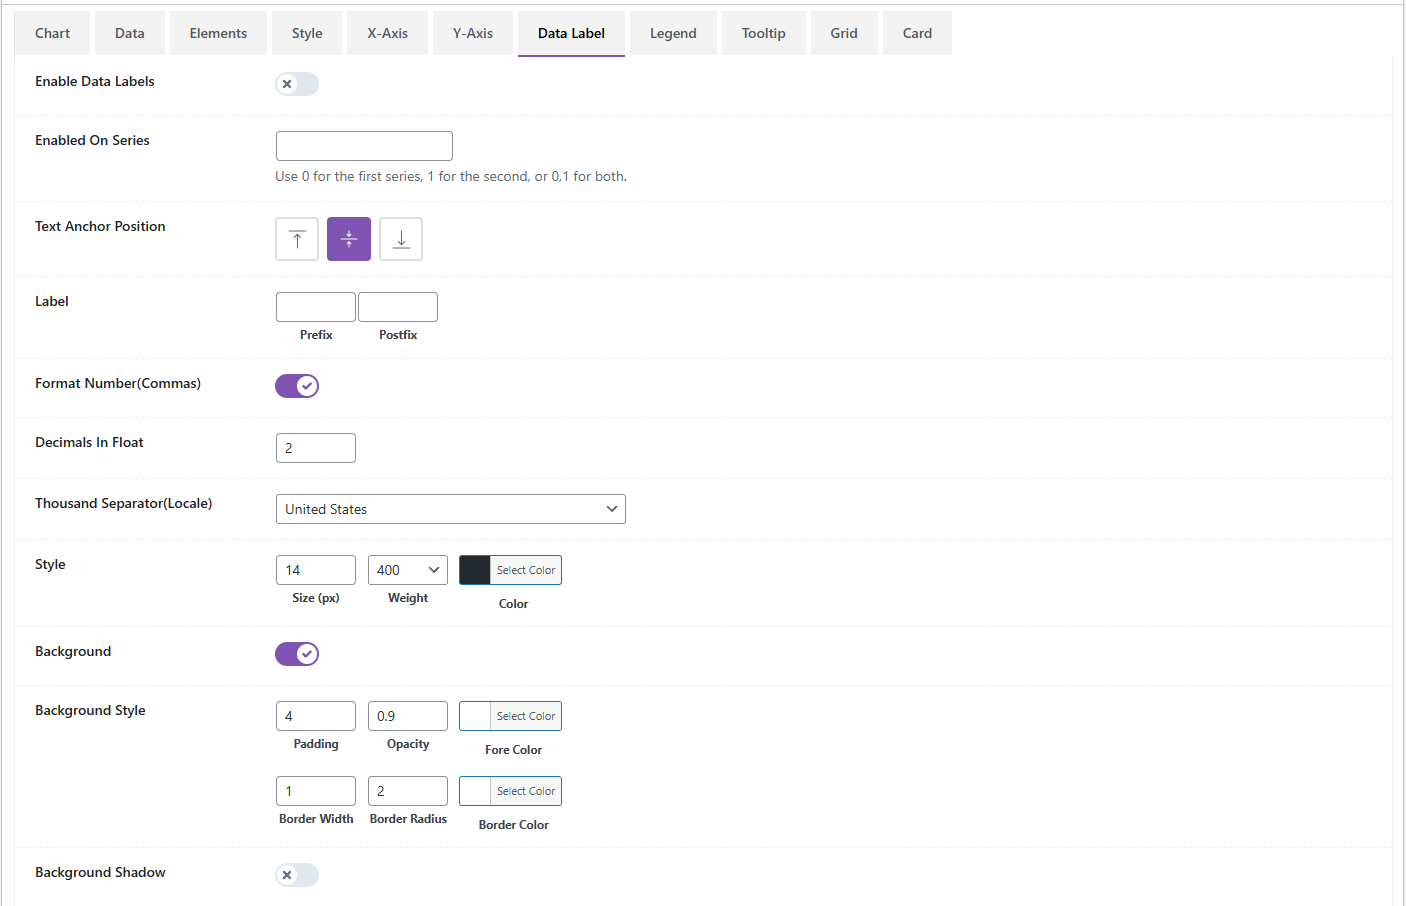
- Style your chart using the comprehensive settings tabs: Chart Settings, Legend, Axes, Tooltips, and Card Styling.
- Use the shortcode
[Chartsy id="SLIDER_ID"]to display your chart anywhere on your site, whereSLIDER_IDis the ID of your chart.
屏幕截图:


常见问题:
How do I create a chart?
Navigate to Chartsy > Add New in your WordPress admin, configure your chart settings and data, and save. Then use the shortcode provided in the sidebar to display it on any page or post.
Does this plugin support responsive design?
Absolutely! All charts created with Chartsy are fully responsive and adapt to different screen sizes.
Can I export my charts?
Yes, you can enable the interactive toolbar in the settings, which allows users to download the chart as an image (PNG/SVG) or as data (CSV/PDF).
Will this work with my page builder?
Yes, Chartsy works with all major page builders like Elementor, Divi, Beaver Builder, and Gutenberg via the shortcode implementation.
What kind of support do you provide?
We provide 24/7 dedicated technical support for all our users. If you encounter any issues, simply contact us through our website.
更新日志:
1.0.0
- Initial release
- ApexCharts.js-powered responsive interactive charts
- 18+ advanced chart types supported (Line, Area, Bar, Heatmap, Treemap, etc.)
- Real-time admin preview system
- Advanced customization for axes, legends, tooltips, and markers
- Interactive toolbar with zoom, pan, and download options
- Shortcode implementation for universal compatibility
- Pie chart options fixed
- Add label color options
- Improved Radialbar charts
- Improved Timeline chart
- Create elementor widget
- WordPress 7.0 compatibility verified
- Added Free vs Pro comparison table in settings
- Fixed data mapping and rendering for candlestick and timeline charts
- Improved data fields display logic in the editor
- Fixed translation warning in Elementor widget and minor shortcode display issues