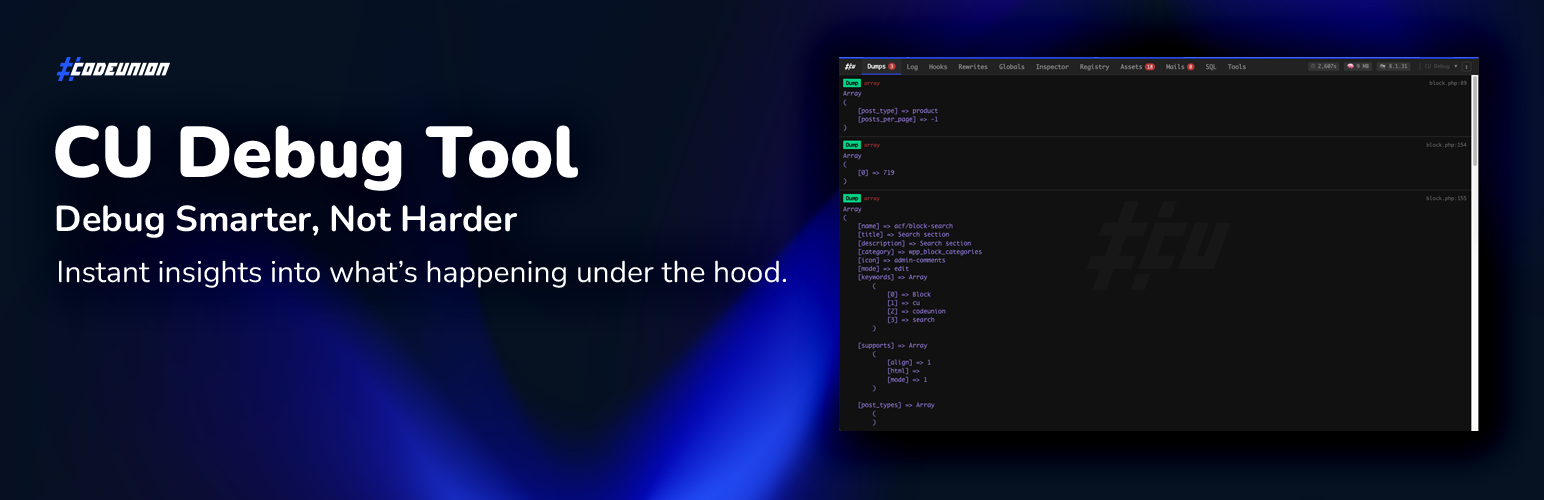
CU Debug Tool by CodeUnion
| 开发者 | hydr4x |
|---|---|
| 更新时间 | 2026年1月30日 00:54 |
| PHP版本: | 7.4 及以上 |
| WordPress版本: | 6.9 |
| 版权: | GPLv2 or later |
| 版权网址: | 版权信息 |
详情介绍:
- Dumps: Tired of cluttering your frontend with
var_dumporprint_rbreaking the layout? Use our helper functioncu_dump()to capture variable data cleanly and display it inside the debug panel without affecting your site's design. - Log Viewer: Don't want to log in to your server via FTP just to check errors? View the realtime contents of your
debug.logfile and clear it instantly directly from the toolbar. - ACF Fields Viewer: Working with ACF Blocks or Options pages? Stop guessing the array structure. Instantly inspect clean, readable data for current Post Meta, Global Options, and specific Gutenberg Blocks without the internal metadata noise.
- Hooks: Debugging the event-driven architecture? Search for any Action or Filter hook to see a list of all attached callbacks, their priorities, and exactly where they are defined in the code.
- Rewrites: Permalink headaches? Test any URL against your active rewrite rules to see exactly which rule matches, what query variables are parsed, and why you might be getting 404 errors.
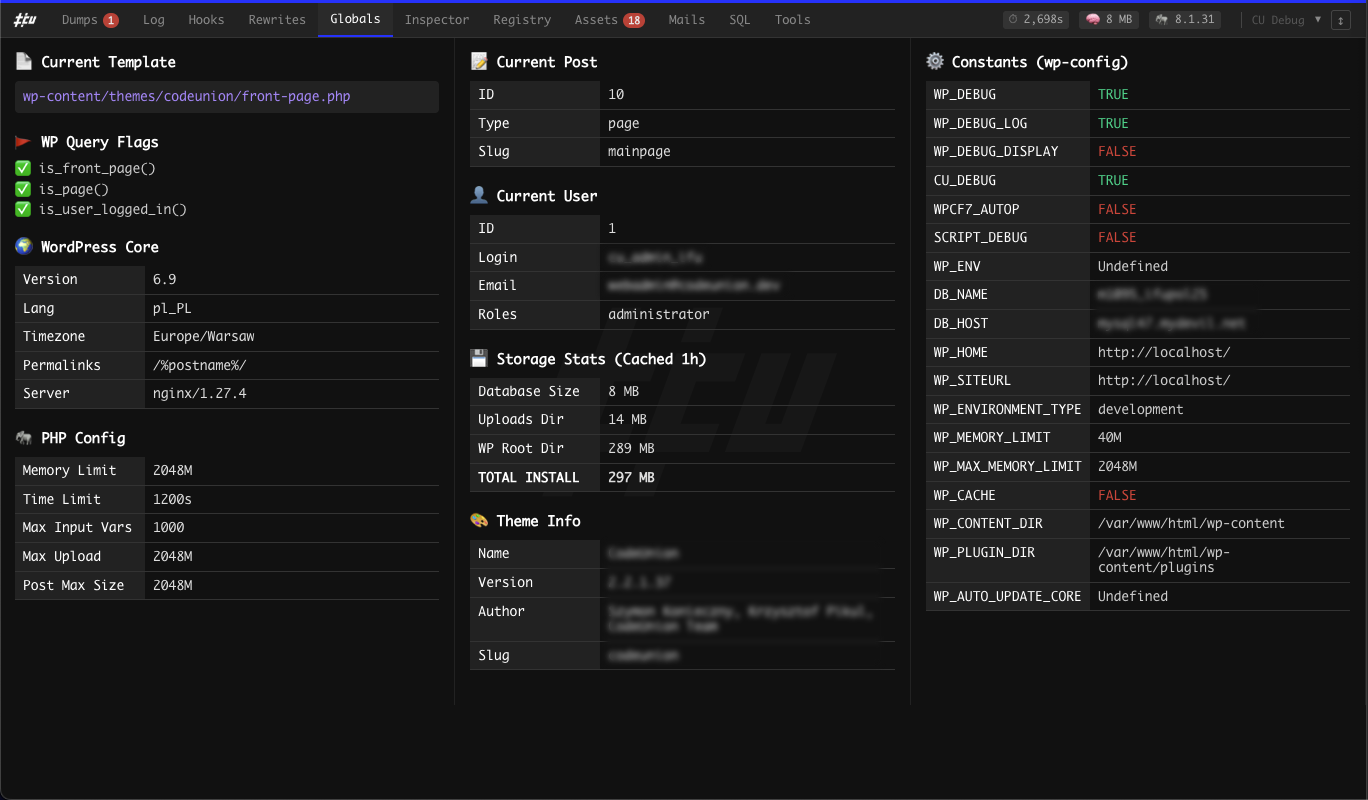
- Globals: Wondering which template is rendering the current page? Need to check active PHP variables, memory usage, or
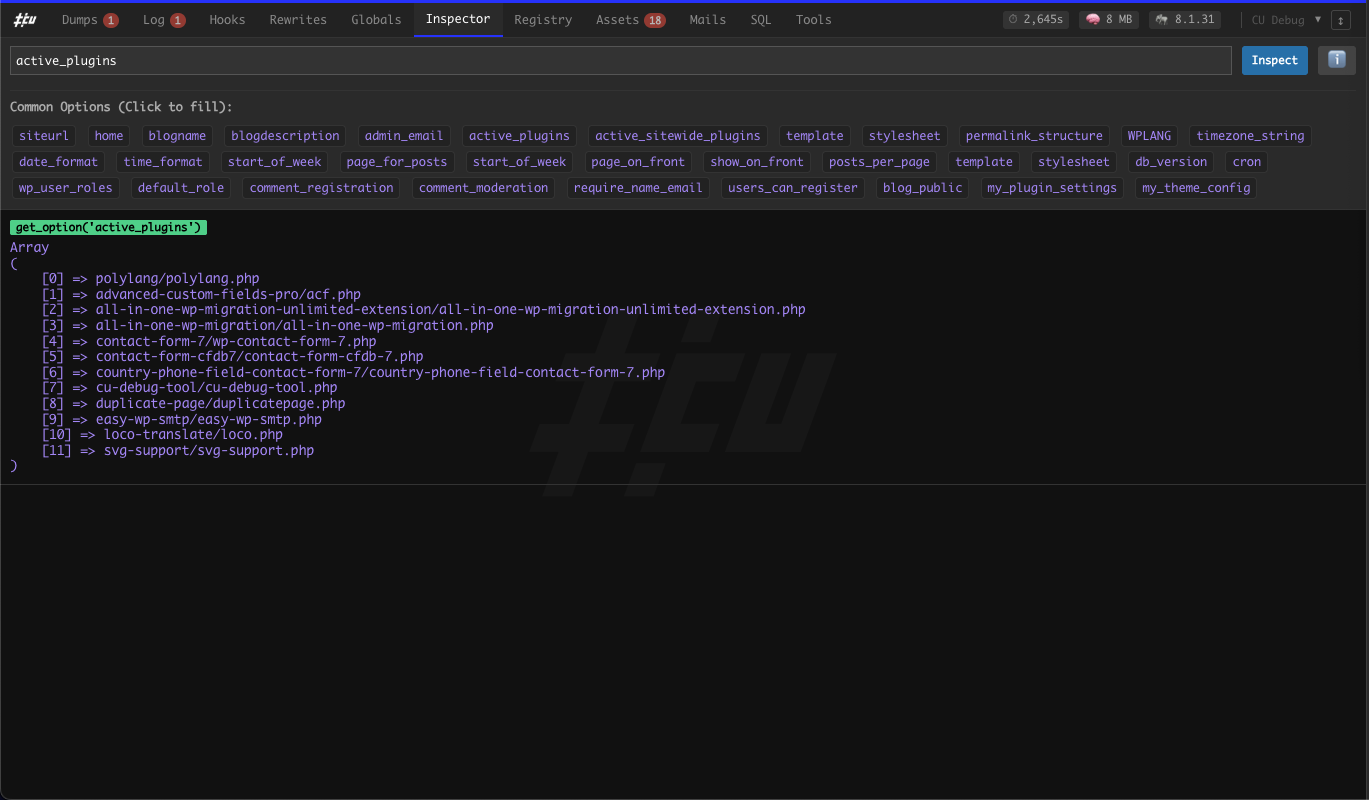
wp-config.phpconstants? This tab gives you a complete snapshot of the current environment. - Inspector: Your central search engine for WordPress internals. Quickly inspect the raw value of any database Option (
get_option) or interactively test specific hooks and rewrites without writing temporary code. - Registry: A comprehensive manifest of your system. View all scheduled WP-Cron events (including overdue status) and use the "Shortcode Detective" to find the exact file and line number where a shortcode is defined.
- Assets: Wondering what scripts and styles are loading on the current page? Get a quick, organized list of all enqueued CSS and JavaScript files to debug dependencies.
- Mails: Need to verify if WordPress is actually sending emails? Inspect the headers and content of every email sent via
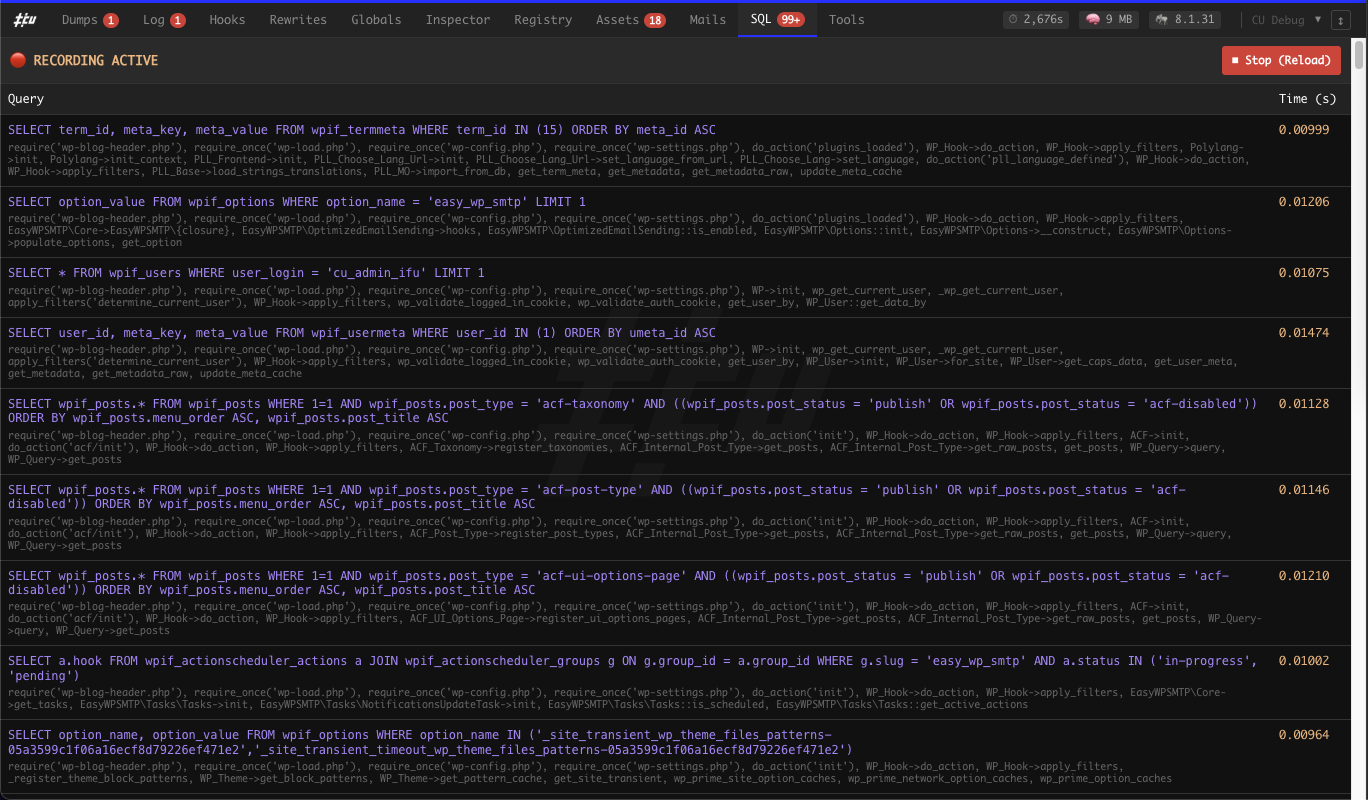
wp_mail()during the current request. - SQL Monitor: Analyze database queries on demand. Toggle recording only when you need it to inspect raw SQL, identify slow queries, and spot duplicates without slowing down your site permanently.
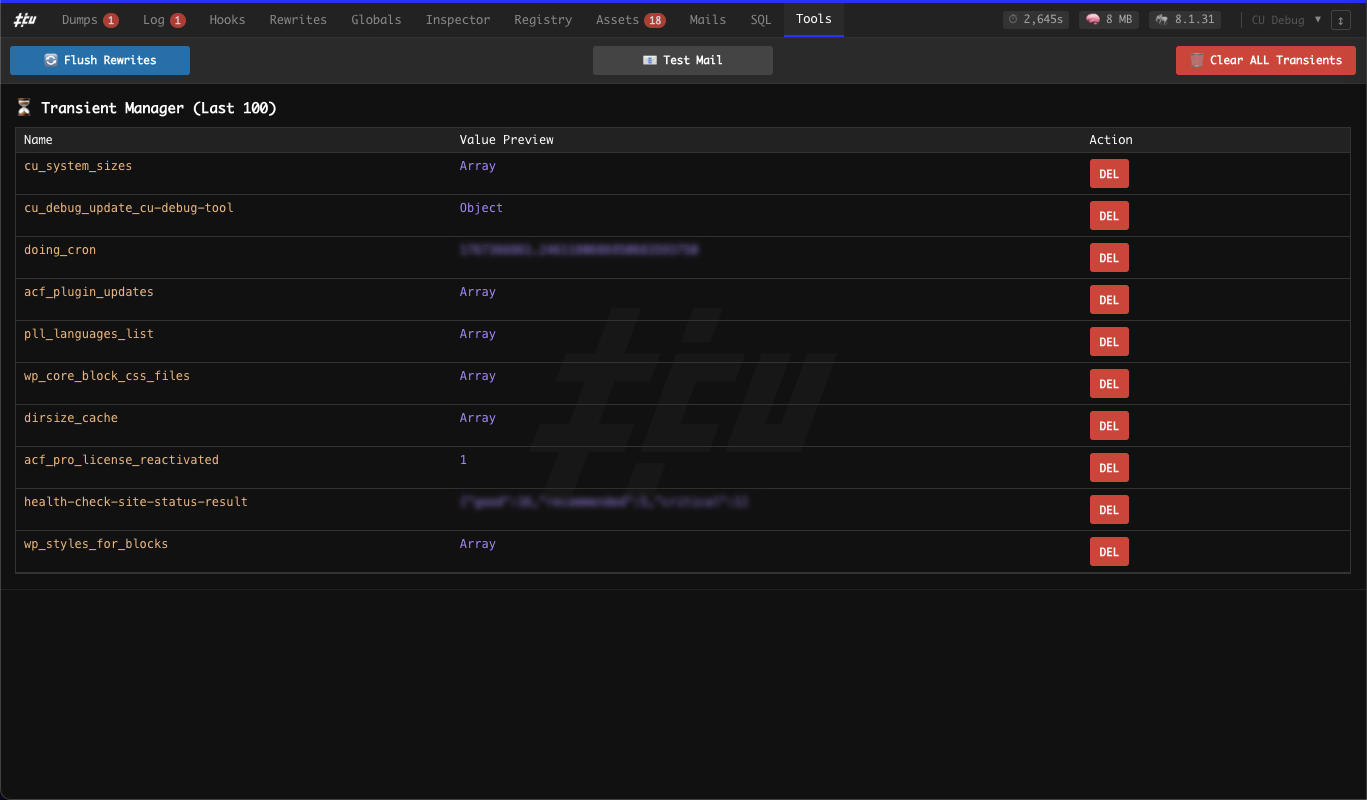
- Tools: A suite of one-click utilities for developers. Flush rewrite rules, clear Transients (cache), and send test emails to verify SMTP configuration instantly.
manage_options capability).
安装:
- Upload the plugin files to the
/wp-content/plugins/cu-debug-tooldirectory, or install the plugin through the WordPress plugins screen. - Activate the plugin through the 'Plugins' screen in WordPress.
- Crucial Step: Open your
wp-config.phpfile and add the following line:define( 'CU_DEBUG', true ); - The debug bar will now appear at the bottom of your site for logged-in administrators (only on frontend!).
屏幕截图:
常见问题:
I installed the plugin, but the bar is not visible. Why?
For security reasons, this plugin requires an explicit constant to be defined. Please ensure you have added define( 'CU_DEBUG', true ); to your wp-config.php file. Also, ensure you are logged in as an Administrator. Finally, keep in mind that this is a frontend-only tool — you will not see any options in the backend Admin menu.
Does the SQL Monitor slow down my site?
SQL recording requires WordPress to save query history, which uses memory. By default, this is OFF. When you click "Start Recording" in the SQL tab, the plugin sets a temporary cookie that enables this feature only for your session.
Can I check which file registered a shortcode?
Yes! Go to the "Registry" tab. The plugin uses PHP Reflection to attempt to locate the exact file and line number where the shortcode callback function is defined.
Why can't I see anything in the Log tab?
If you want to see the logs, make sure you have the following options enabled in your wp-config.php file:
define('WP_DEBUG', true);define('WP_DEBUG_LOG', true);define('WP_DEBUG_DISPLAY', false);Ensure that your debug.log file is in the default location (wp-content/debug.log).
Why is there nothing in my Dumps tab?
The Dumps tab is empty by default because it only displays data that you explicitly capture. To see data here, you must use the helper function cu_dump($variable) within your theme or plugin code. It works similarly to var_dump(), but instead of breaking your layout, it safely displays the formatted data inside the debug panel.
Example usage:
\$my_data = ['id' => 123, 'status' => 'active'];
cu_dump( \$my_data );
更新日志:
- Fix: Fixed an issue with the console closing on very low screens - added max-height attribute.
- Refactor: Added a more detailed description of how to launch the plugin.
- Feature: New ACF tab feature - now you can see all ACF fields in current view.
- Fix: Removed error of value not found in localStorage on first launch of plugin.
- Refactor: Added prefixing in function and class names, global variables, and option names.
- Refactor: Changed plugin name from CU Debug Tool to CU Debug Tool by CodeUnion.
- Optimization: Cleaned up SCSS codebase by removing unused mixins.
- Fix: Resolved minor visual styling inconsistencies in the panel interface.
- Fix: Corrected template rendering issues and updated associated styles.
- Dev: Implemented comprehensive PHPDoc documentation adhering to WordPress Coding Standards.
- Fix: Addressed various CSS layout bugs for better browser compatibility.
- UI: Standardized font sizes across the debug panel for better readability.
- Core: Major rewrite of the JavaScript engine using ES6+ component-based architecture.
- UI: Complete refactoring of stylesheets to BEM (Block Element Modifier) naming convention.
- Enhancement: Added
WP_AUTO_UPDATE_COREconstant status to the Globals tab. - UI: Improved data table styling for better information density.
- Architecture: Transitioned codebase to a modular structure for improved performance and maintainability.
- UI: Refined table layouts.
- Feature: Expanded the Globals tab with additional server and environment variables.
- Feature: Introduced Email Capture module to inspect headers and content of emails sent via
wp_mail().
- Fix: Adjusted table height calculations for better responsiveness.
- Initial release.