Debug Bar Query Count Alert
| 开发者 |
mboynes
alleyinteractive |
|---|---|
| 更新时间 | 2014年2月3日 03:02 |
| PHP版本: | 3.1 及以上 |
| WordPress版本: | 3.8.1 |
| 版权: | GPLv2 or later |
| 版权网址: | 版权信息 |
详情介绍:
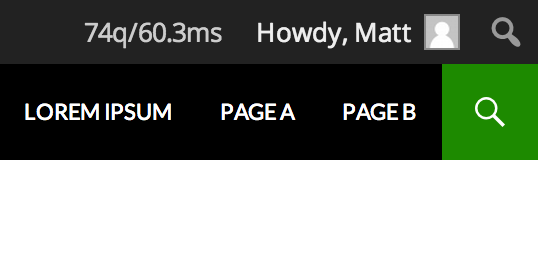
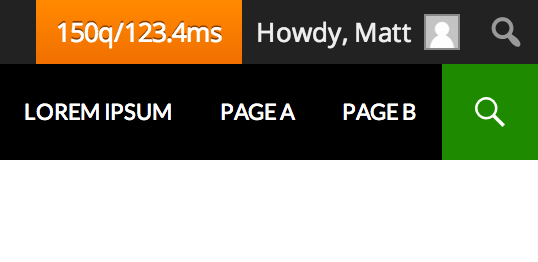
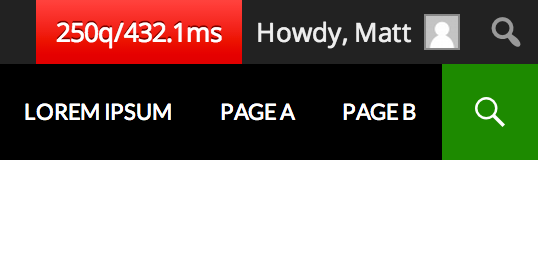
Replaces the default text in the Debug Bar button (which is "Debug Bar" by default in English) with the page's query count and total sql time. The button will be red if there were more than 200 queries or they took more than 1 second to run, and orange if the page required more than 100 queries or took more than 0.5 seconds to run.
Requires the Debug Bar plugin and for the constant
SAVEQUERIES to be true.
Inspired by the Admin Bar on WordPress.com VIP, which offers similar functionality.
安装:
- Upload to the
/wp-content/plugins/directory - Activate the plugin through the 'Plugins' menu in WordPress
屏幕截图:
常见问题:
Can I alter the color-coded thresholds?
Yes, absolutely. In your theme or plugin, you can set these values as follows: ` Lower the query count limits to 50 and 100 Debug_Bar_Query_Count_Button()->query_count_limits = array( 50, 100 ); Lower the query time limits to 250ms and 500ms Debug_Bar_Query_Count_Button()->query_time_limits = array( 0.25, 0.5 ); `
更新日志:
0.1
Brand new.