BugTrace - Debug Log Tool
| 开发者 | nsgawli |
|---|---|
| 更新时间 | 2026年5月24日 19:39 |
| PHP版本: | 7.4 及以上 |
| WordPress版本: | 7.0 |
| 版权: | GPLv3 or later |
| 版权网址: | 版权信息 |
详情介绍:
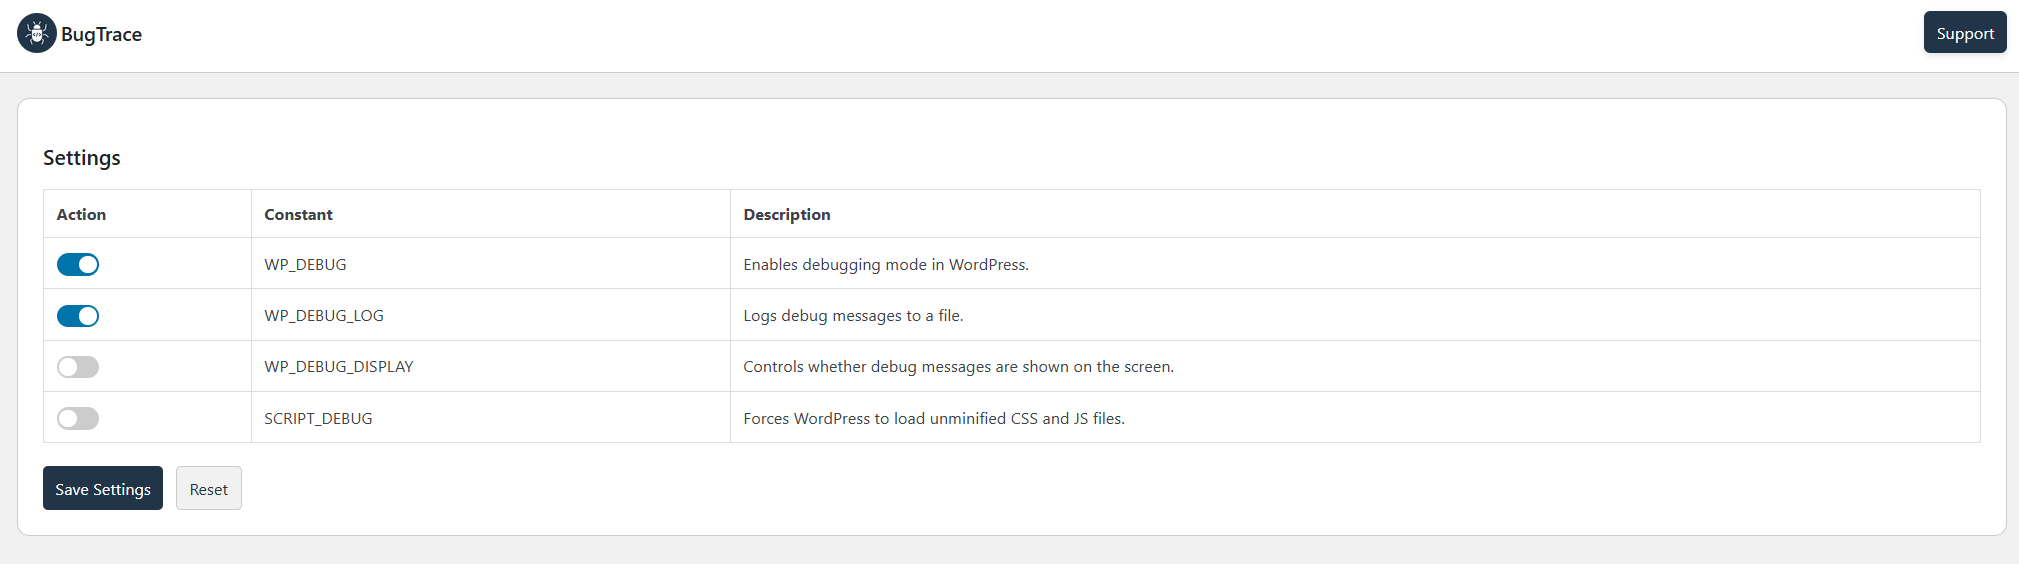
- Instantly Control Debug Constants: Gain immediate access to toggle crucial WordPress debugging constants like WP_DEBUG, WP_DEBUG_LOG, WP_DEBUG_DISPLAY, and SCRIPT_DEBUG directly from your dashboard. Activate or deactivate them with a single click—no code editing required, saving you valuable development time and reducing the risk of site-breaking syntax errors.
- AI-Powered Error Resolution (ChatGPT, Gemini & Google): Stop guessing and start solving! For every log entry, BugTrace provides one-click 'Help' links. Instantly send the error message to ChatGPT, Gemini, or Google to find solutions, code snippets, and explanations. Drastically reduce your troubleshooting time and solve complex problems faster than ever before.
- Effortlessly Access Debug Logs: View and download your WordPress
debug.logfile directly from the admin panel. This allows for quick identification of PHP errors, warnings, and notices, helping you pinpoint the source of problems much faster than traditional methods. - Dynamic Log Viewing with Auto & Manual Refresh: Keep an eye on your
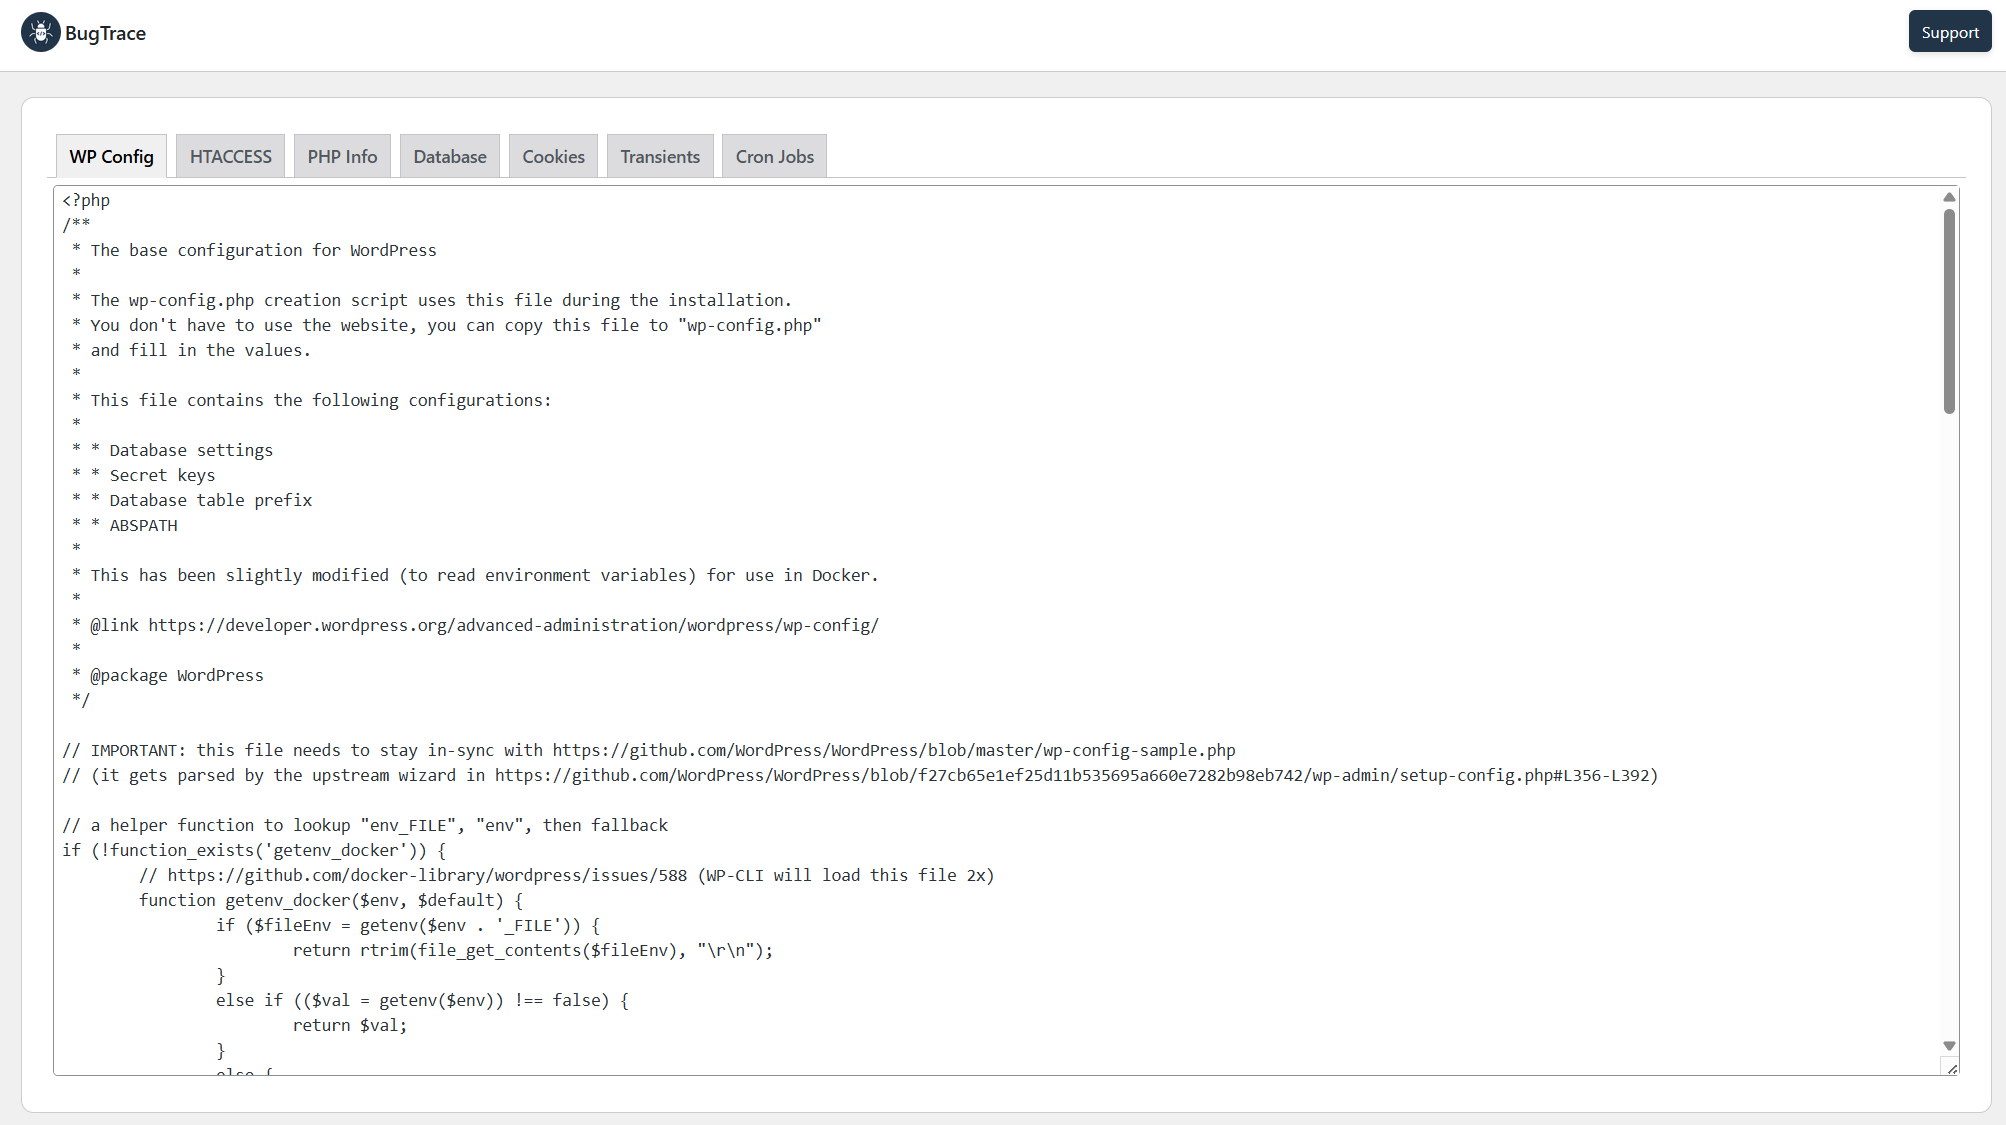
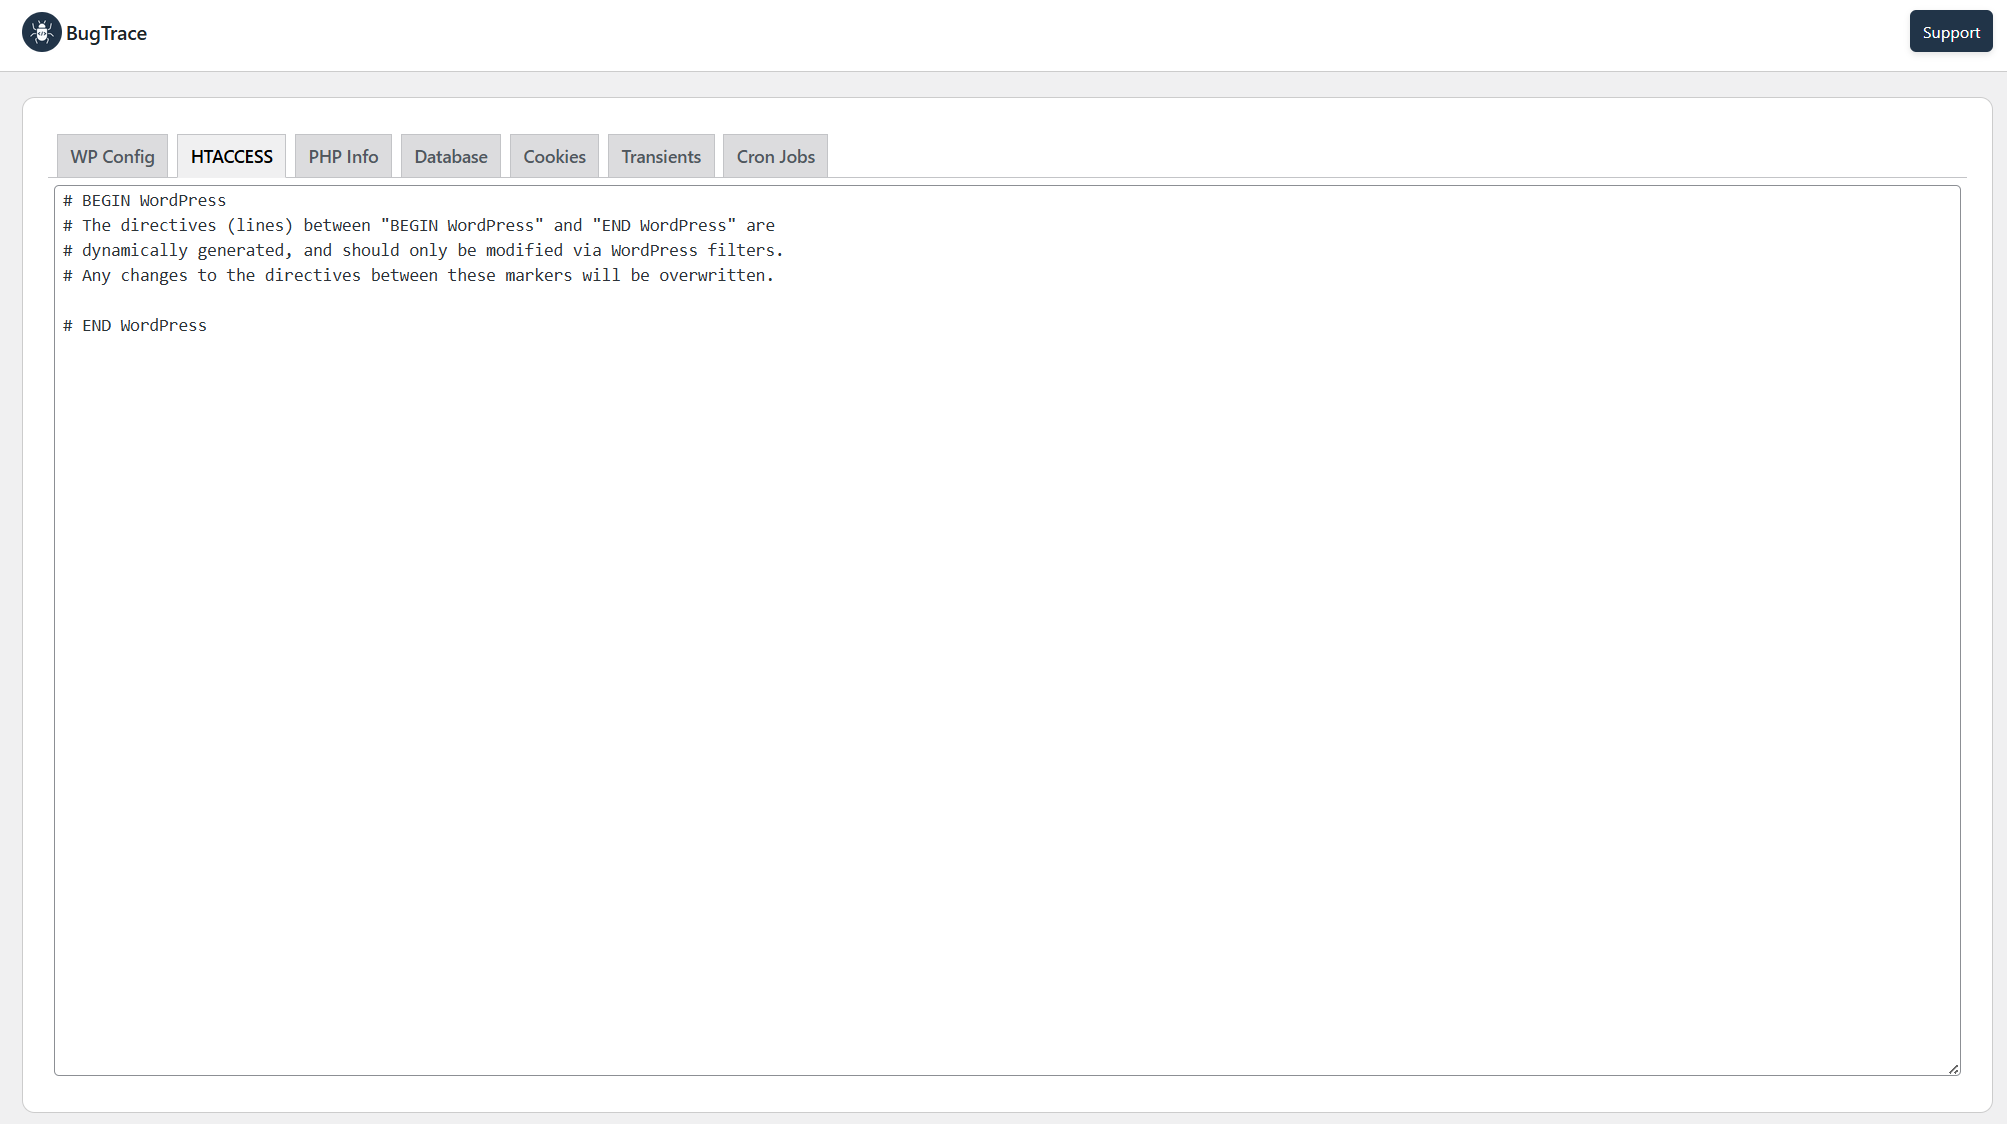
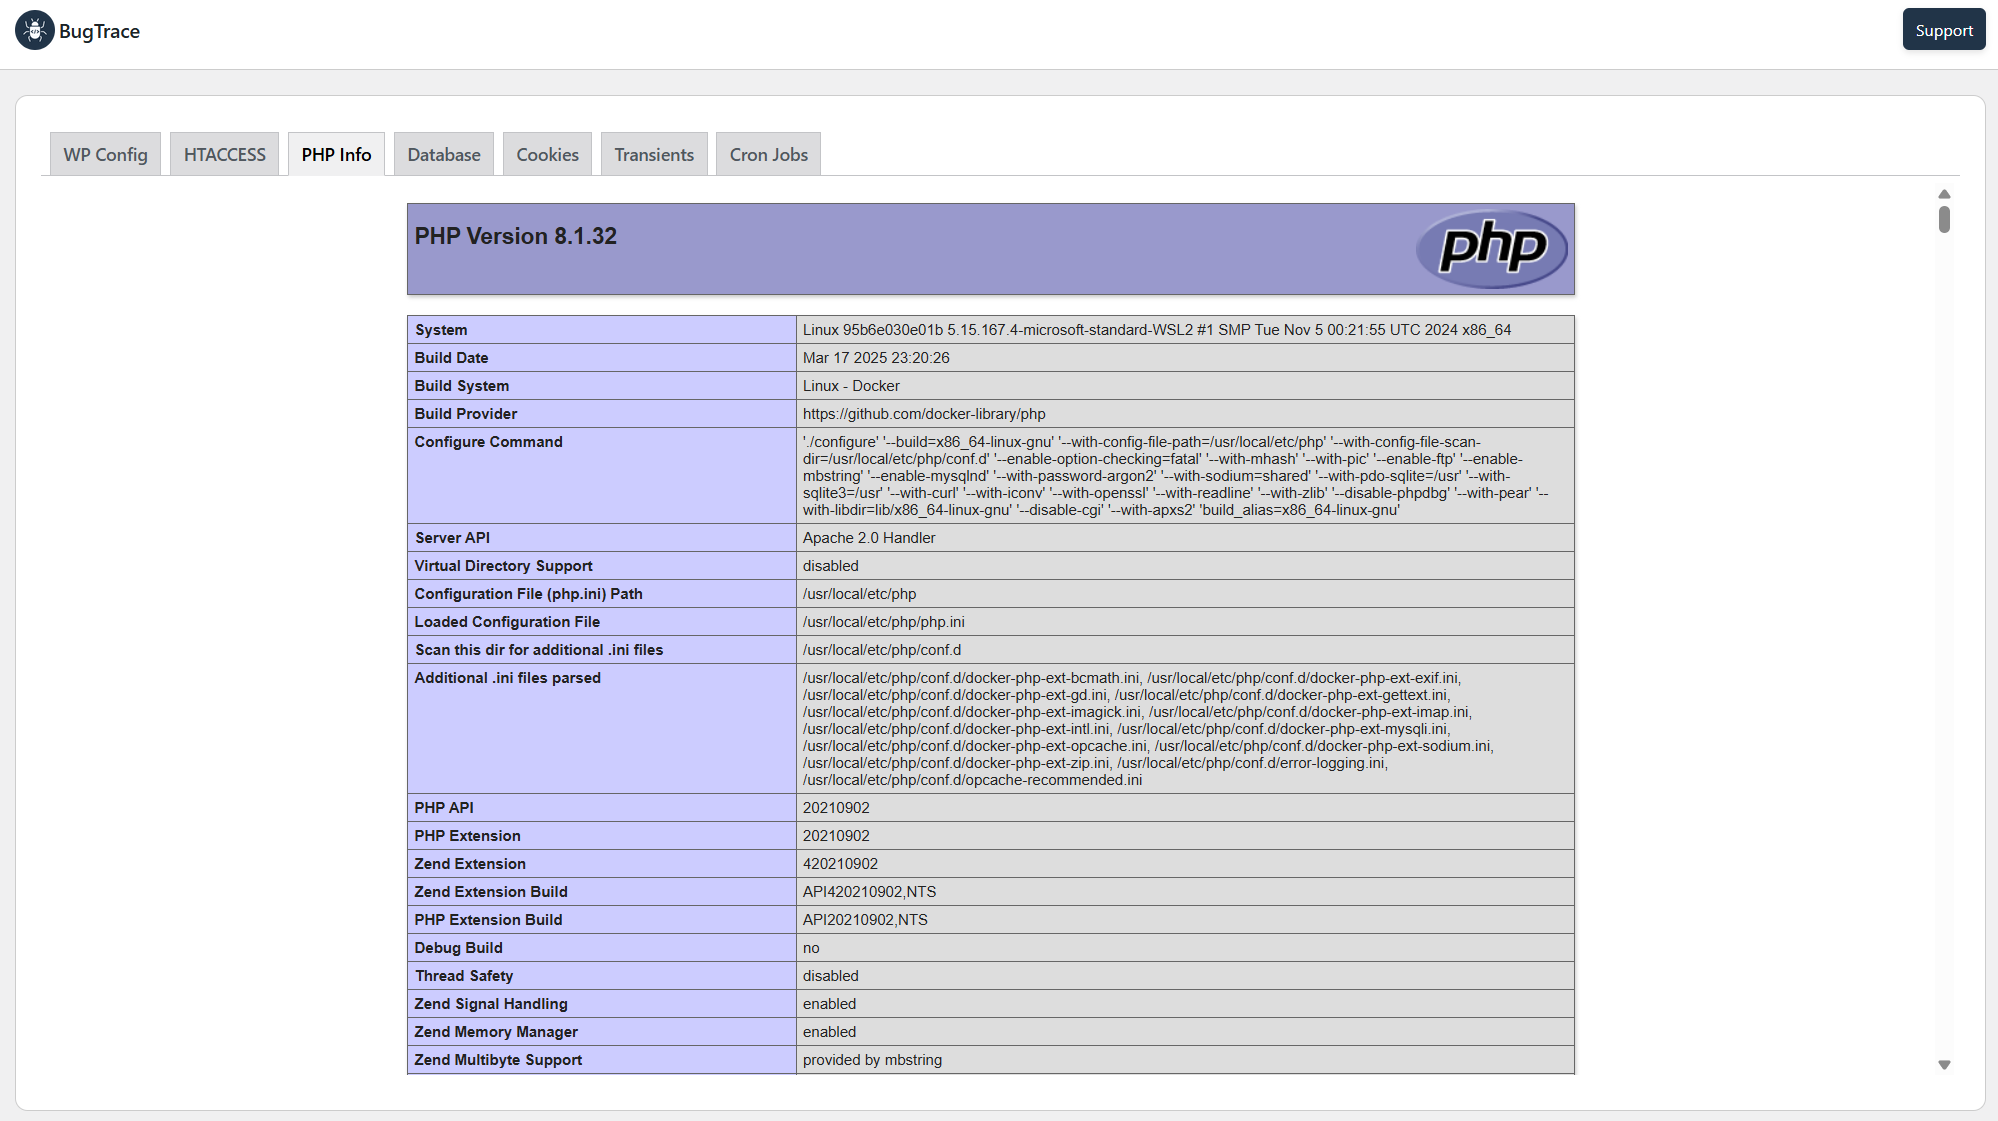
debug.login near real-time with the auto-refresh option, or manually refresh the log view whenever you need. This helps in actively monitoring errors as they occur and is invaluable for live debugging sessions. - Securely Inspect Server Configurations: Safely view the contents of vital server files such as
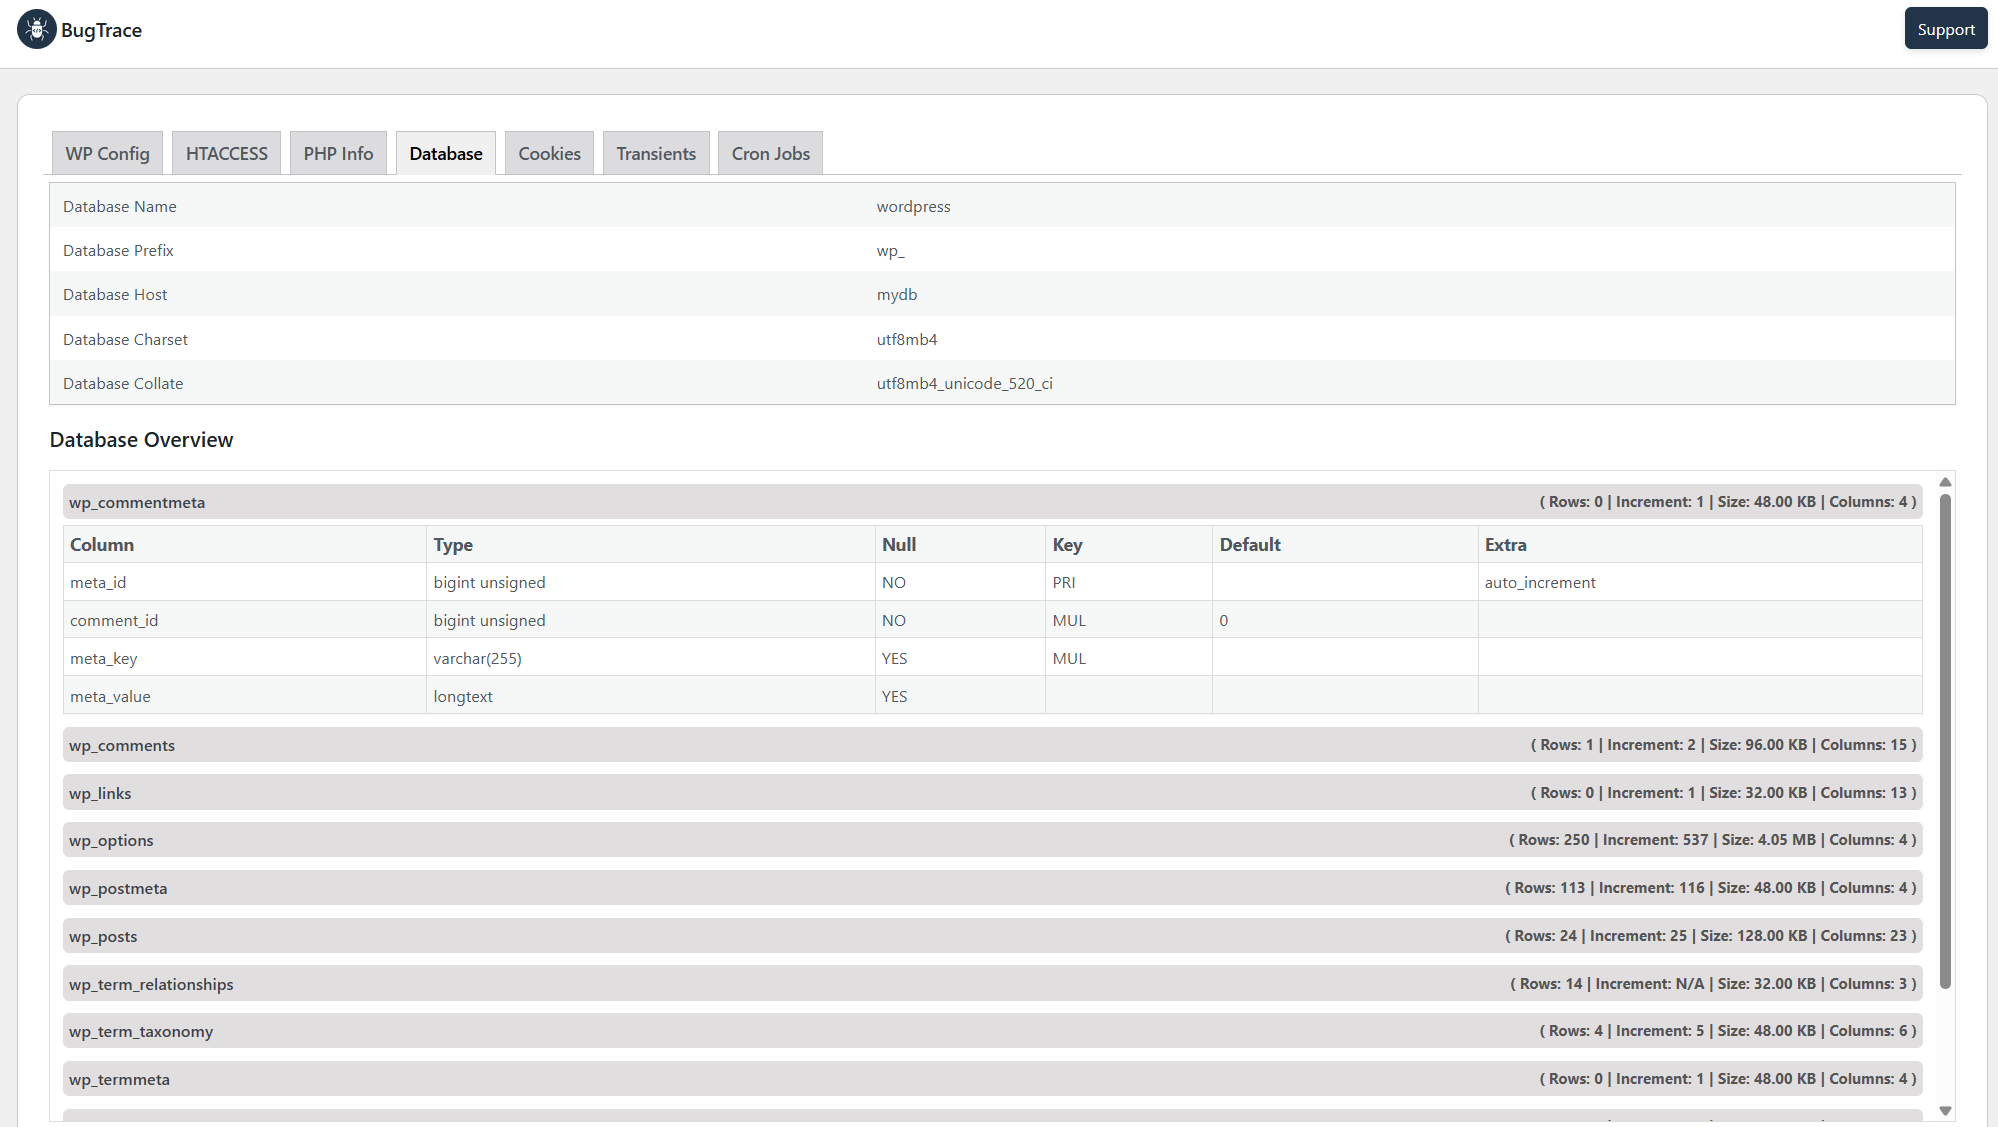
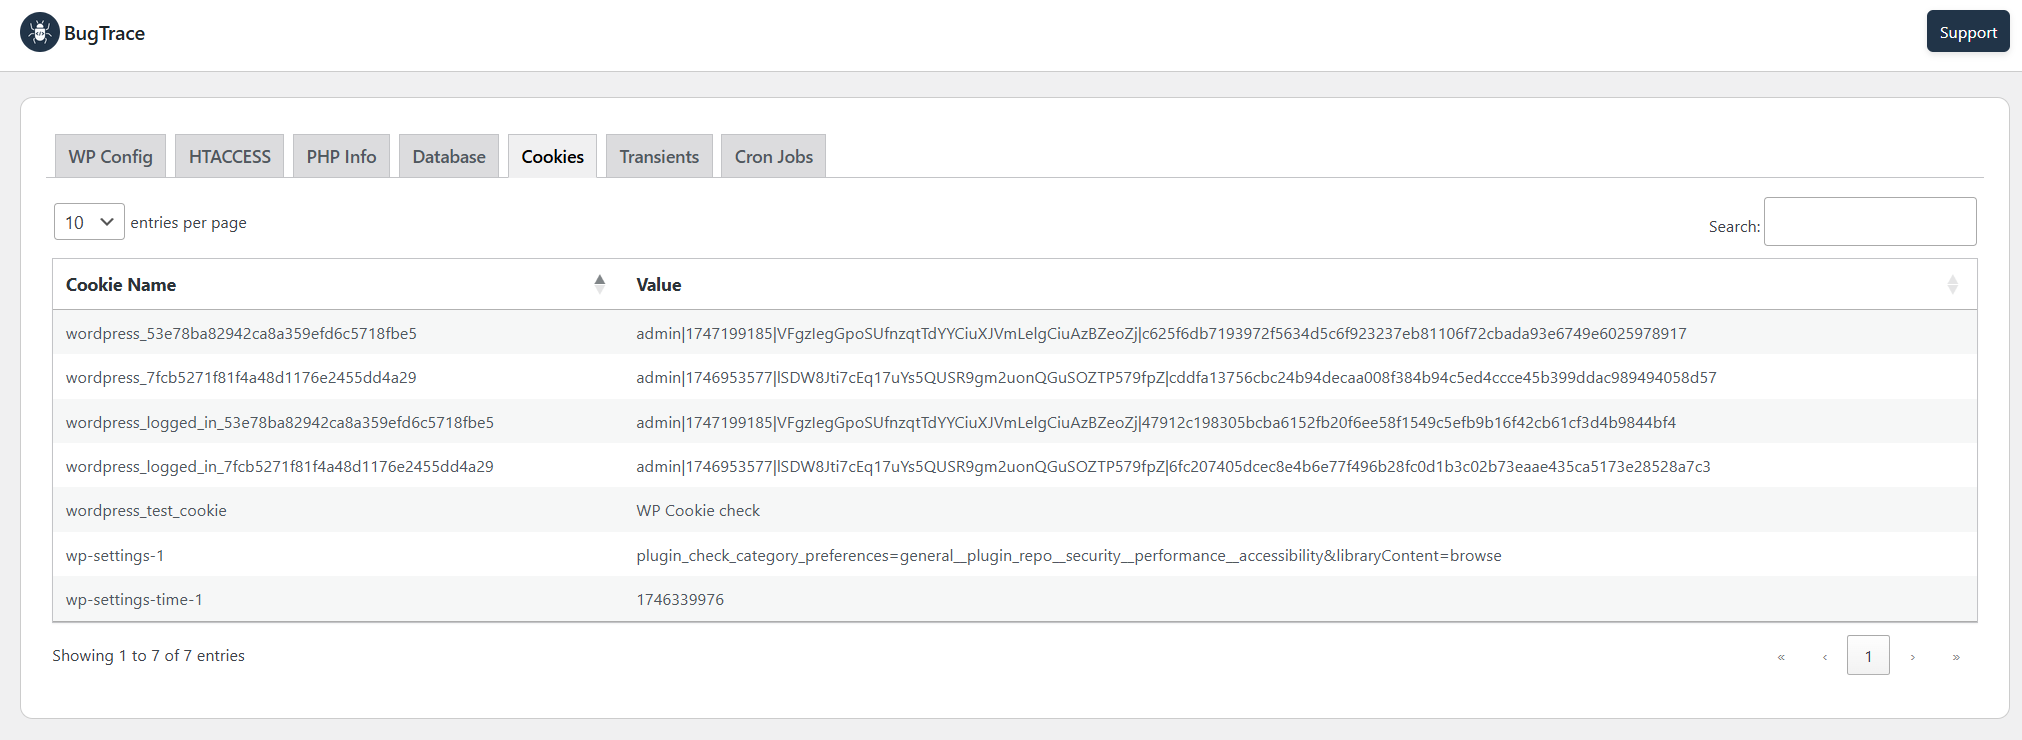
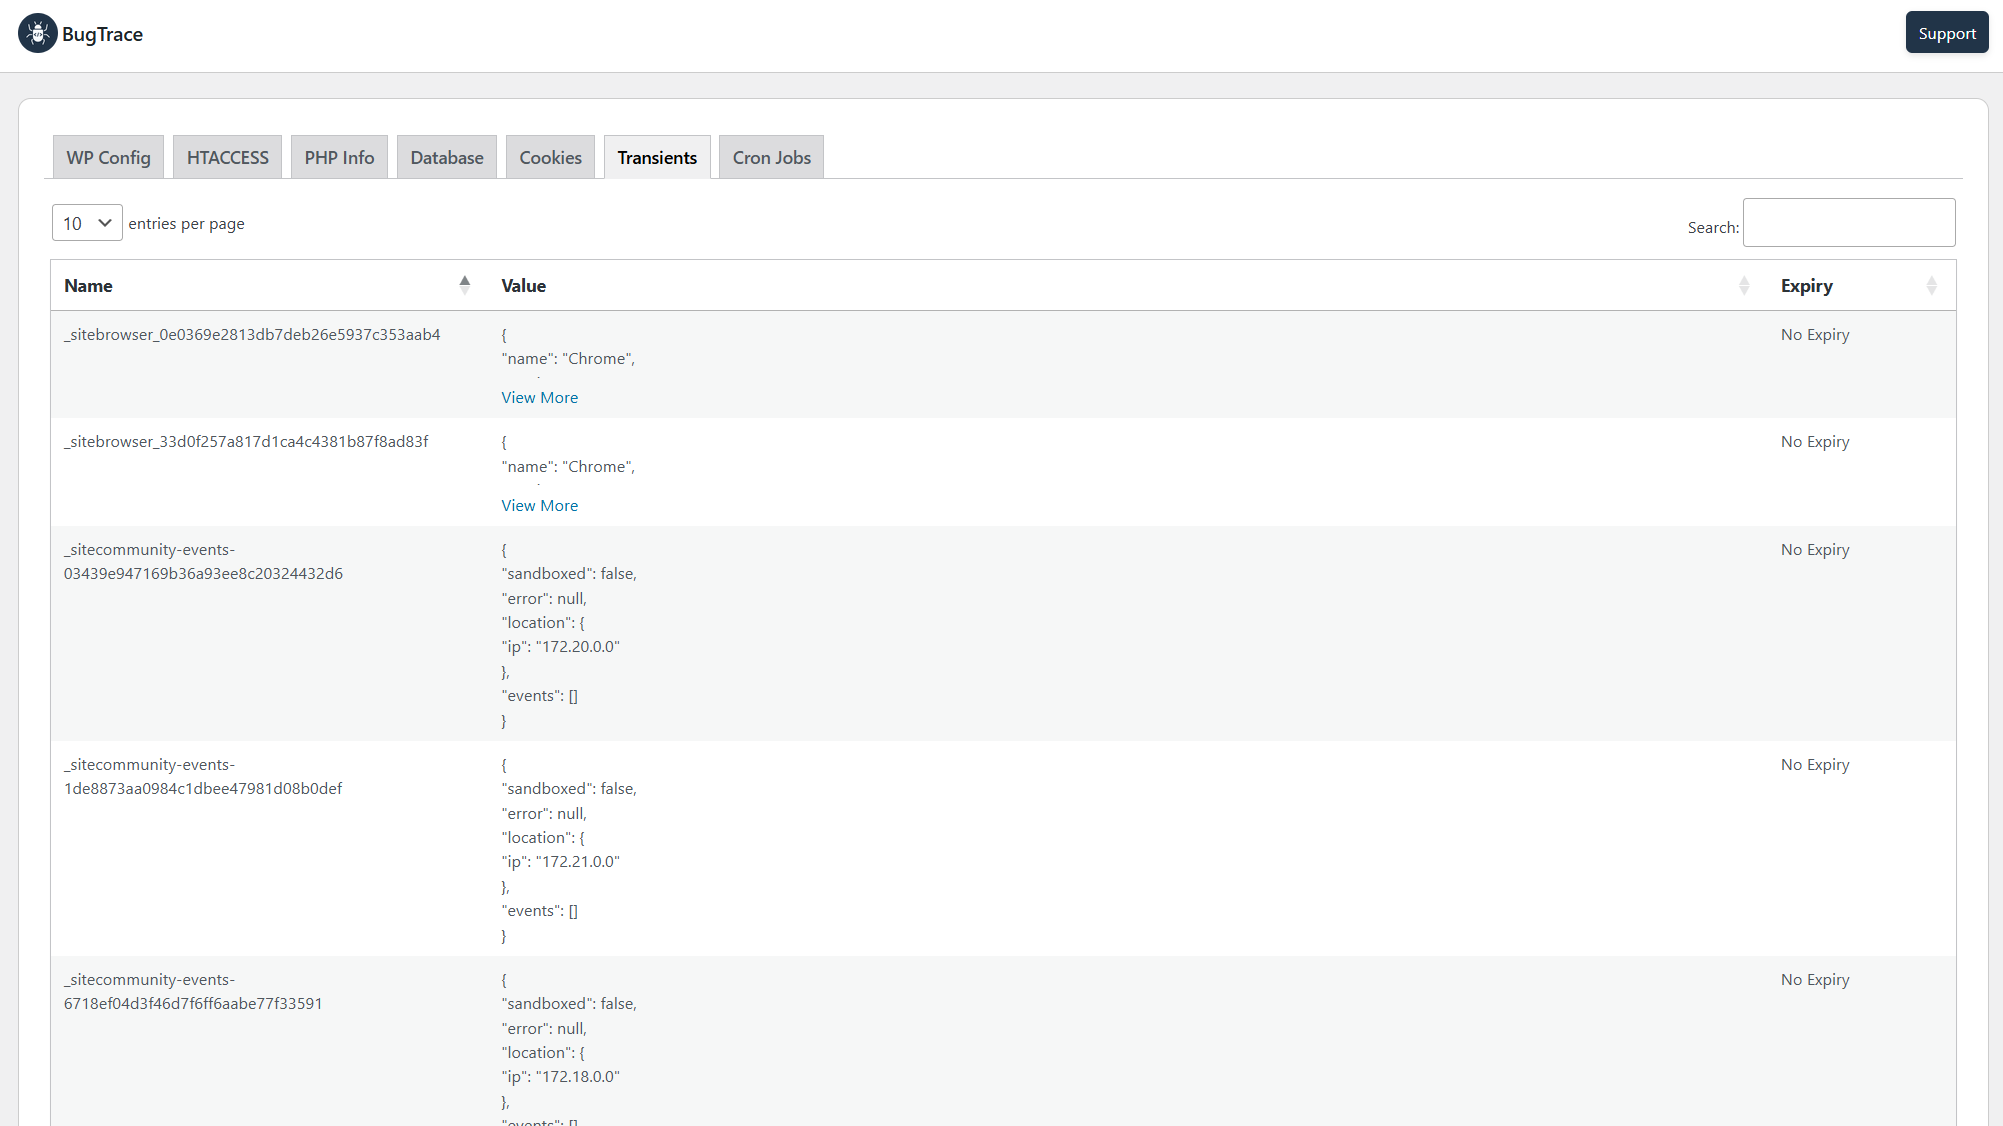
.htaccessand wp-config.php (read-only), and review detailedphpinfo()output without ever leaving your WordPress environment. This provides essential insights for advanced WordPress troubleshooting and server diagnostics. - Monitor Key System Behaviors: Get a clear overview of your database table information (including size and row count), view active browser cookies (read-only), inspect WordPress transients (read-only), and check your list of scheduled WordPress cron jobs. This comprehensive visibility helps you understand your site's inner workings.
- Utilize Admin Bar Shortcuts: Speed up your debugging workflow with convenient admin bar shortcuts to view, download, and clear the
debug.logfile from anywhere in your WordPress admin area. - Quick Log to Clipboard: Instantly copy the entire contents of your log to your clipboard with a single click. Perfect for quickly sharing log details with support teams, pasting into development tools, or for your own records.
- Enjoy a Minimalist Interface: BugTrace is intentionally lightweight with a clean UI, focusing purely on essential debugging tools to ensure it doesn't bog down your WordPress site.
安装:
- Navigate to the 'Add New' in the plugins dashboard
- Search for BugTrace - Debug Log Tool
- Click 'Install Now'
- Activate the plugin on the plugin dashboard
- Download
debug-log-tool.zipfrom this page - Navigate to the 'Add New' in the plugins dashboard
- Navigate to the 'Upload' area
- Select
debug-log-tool.zipfrom your computer - Click 'Install Now'
- Activate the plugin in the Plugin dashboard
- Download
debug-log-tool.zipfrom this page - Extract the
debug-log-tooldirectory to your computer - Upload the
debug-log-tooldirectory to the/wp-content/plugins/directory - Activate the plugin in the Plugin dashboard
屏幕截图:
常见问题:
What are the AI Help Links (ChatGPT, Gemini, Google)?
This is a powerful new feature designed to accelerate your debugging. Next to each error log, you'll find icons for ChatGPT, Gemini, and Google. Clicking one will open a new tab and automatically search that platform for a solution to that specific error, saving you the time of manually copying, pasting, and searching. It's like having an expert assistant for every error.
Can I download the debug.log file?
Yes, if a debug.log file exists and is writable by WordPress, BugTrace allows you to download it directly from the admin panel with a single click.
Is it safe to use BugTrace on a production website?
Yes, BugTrace can be used on a production site. However, exercise caution when enabling debugging modes (like WP_DEBUG or WP_DEBUG_DISPLAY) in a live environment, as this can sometimes expose sensitive information to visitors if errors occur. It's generally recommended for staging or development, or for brief troubleshooting periods on live sites.
How does BugTrace help if I suspect issues with my .htaccess or wp-config.php files?
BugTrace provides a read-only viewer for your .htaccess and wp-config.php files directly within the WordPress admin dashboard. This allows you to quickly inspect their contents for misconfigurations or unexpected code without needing FTP access or risking accidental direct edits to these critical files.
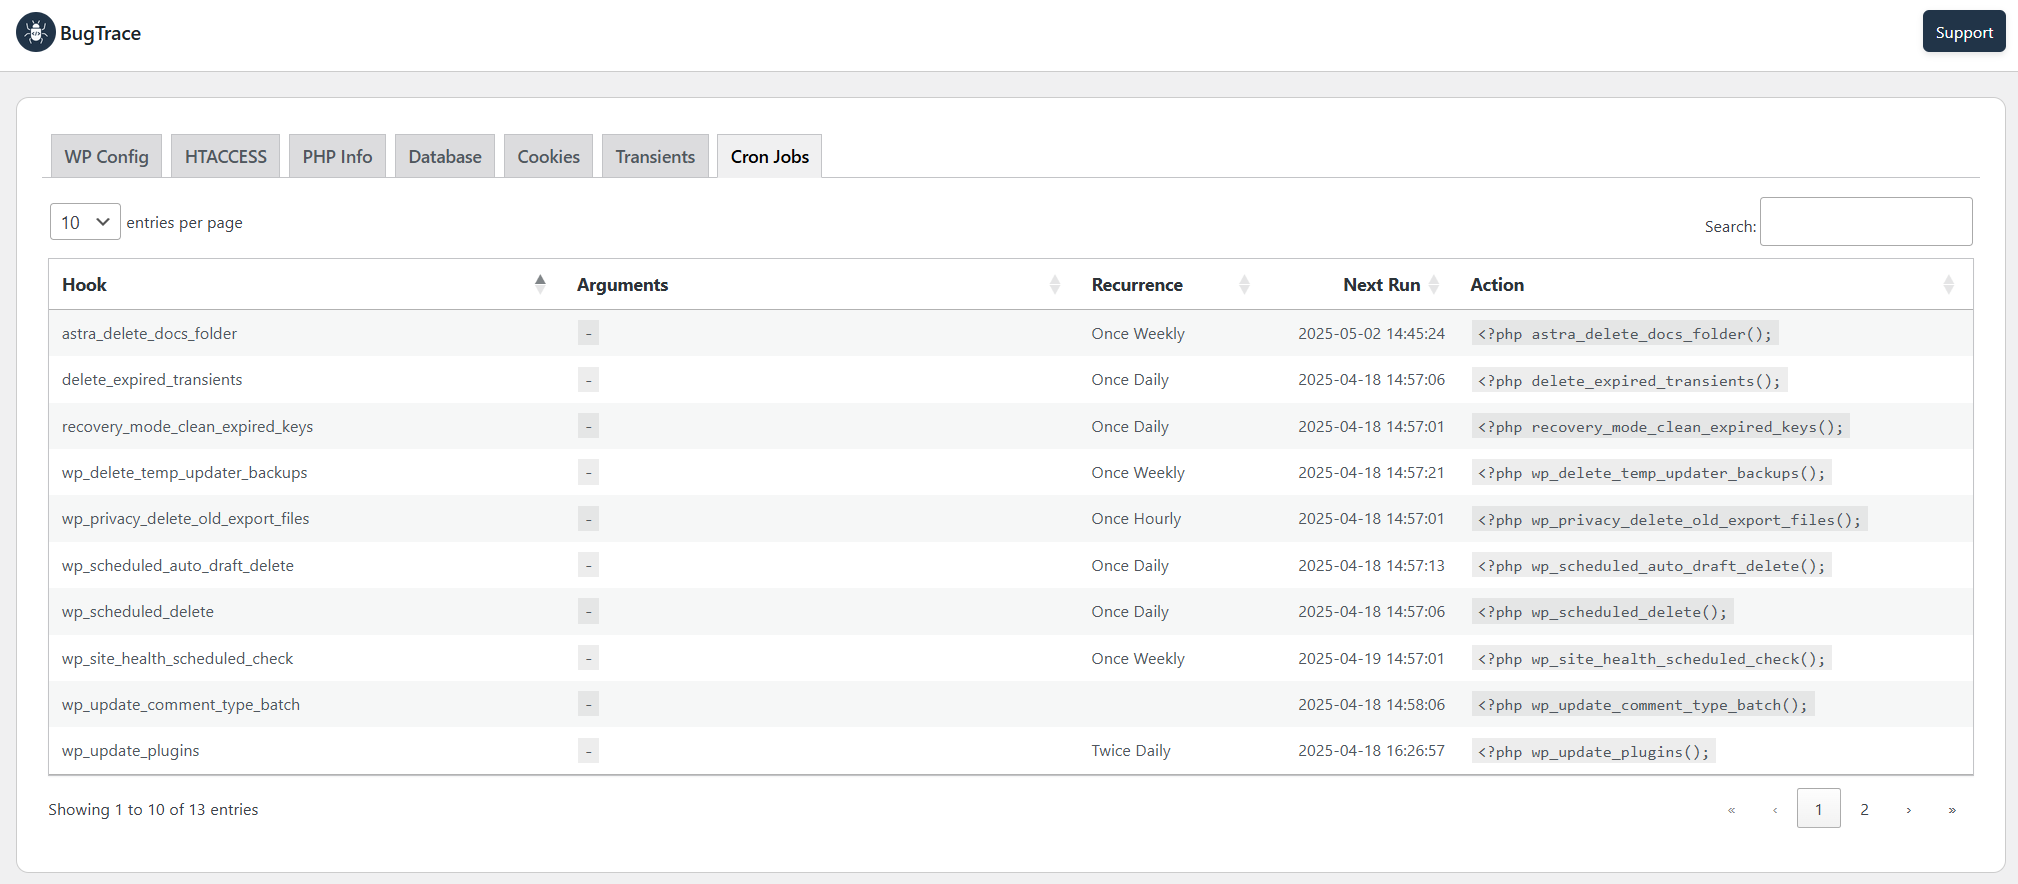
Can I use BugTrace to monitor WordPress cron jobs?
Yes, BugTrace includes a feature to view your scheduled WordPress cron jobs. This can help you verify that essential tasks are scheduled correctly and identify any unexpected or missing cron events that might be affecting your site's functionality.
Is BugTrace lightweight and will it impact my site's performance?
Absolutely. BugTrace is designed with a minimalist UI and focuses only on essential debugging functionalities. It's lightweight and should not add any noticeable performance overhead to your website's front-end or admin area during normal operation.
What kind of server information can I inspect with BugTrace?
Beyond specific file viewers, BugTrace allows you to see phpinfo() output for detailed PHP configuration, database table information (including size and row count), a list of active browser cookies (read-only), and WordPress transients (read-only). This helps in comprehensive server diagnostics.
How does the admin bar shortcut for the debug log enhance my workflow?
BugTrace adds a convenient shortcut to the WordPress admin bar. This allows you to quickly view, download, or clear the debug.log file from any page within the admin area, speeding up your debugging process significantly.
How does the auto-refresh feature for the debug log work?
The auto-refresh feature periodically reloads the debug log content within the BugTrace interface, allowing you to see new log entries as they are written without needing to manually refresh the page or the entire browser tab. You can also trigger a manual refresh at any time for immediate updates.