DebugPress: Debugger in Popup
| 开发者 | GDragoN |
|---|---|
| 更新时间 | 2026年7月1日 02:04 |
| 捐献地址: | 去捐款 |
| PHP版本: | 7.4 及以上 |
| WordPress版本: | 7.0 |
| 版权: | GPLv3 or later |
| 版权网址: | 版权信息 |
详情介绍:
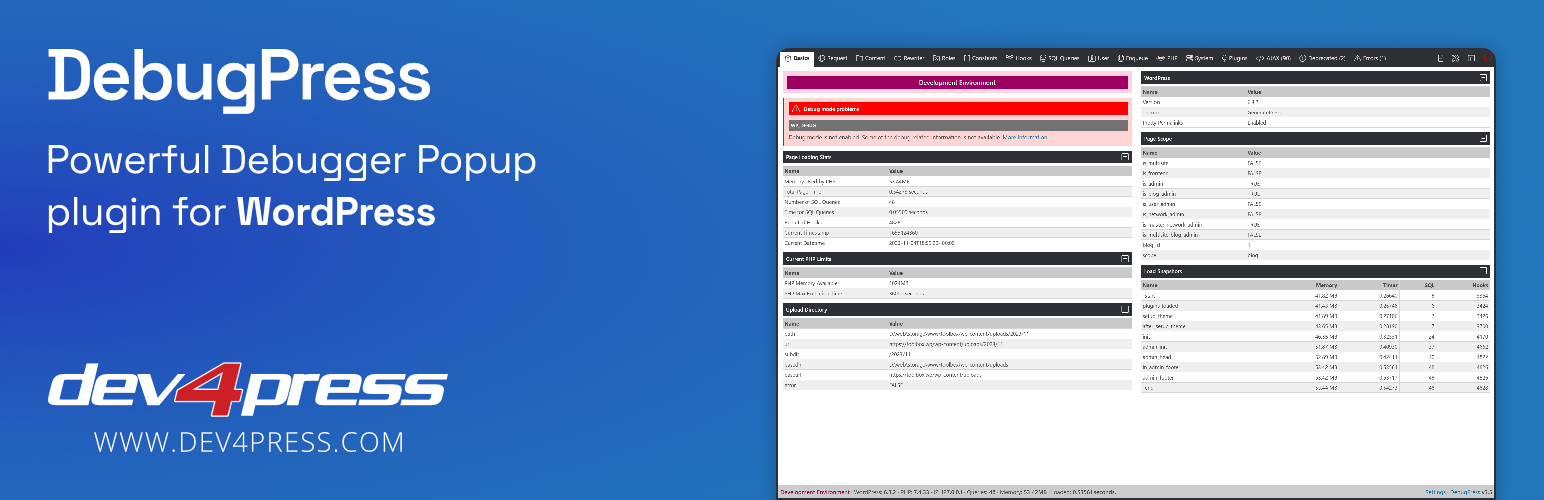
DebugPress is an easy-to-use plugin implementing popup for debugging and profiling currently loaded WordPress powered website page with support for intercepting AJAX requests. The main debugger window is displayed as a popup, activated through the button with the Bug integrated into WordPress Toolbar, or floating on the page.
The plugin currently has a total of 22 tabs in the popup debugger window, showing all kinds of information relevant to the current page, WordPress setup, background AJAX calls, and much more.
The plugin doesn't modify or replace any WordPress files or functions.
Home and GitHub
- Learn more about the plugin: DebugPress Website
- Contribute to plugin development: DebugPress on GitHub
- Basic
- Request (optional)
- Query (for frontend only)
- Content (optional)
- Roles (optional)
- Constants (optional)
- Hooks (optional)
- PHP (optional)
- Server (optional)
- Enqueue (optional)
- SQL Queries (if SQL queries logging is enabled)
- User (optional, if user is logged in only)
- HTTP (optional, if HTTP API calls are captured)
- bbPress (optional, on bbPress forum pages only)
- Freemius (optional, if Freemius SDK is active)
- Plugins (optional, if plugins store data)
- Errors (for all captured PHP errors)
- Doing It Wrong (for captured WordPress Doing It Wrong warnings)
- Deprecated (for captured PHP deprecated warnings)
- AJAX (for captured AJAX calls while page is active)
- Store (for any user stored objects during the page loading)
- Tools (internal and external tools links)
- Debug Log (load content on demand from WordPress 'debug.log')
- Layout (control the size, position and activation of the popup)
admin-ajax.php handler, and with every response, it returns HTTP headers with AJAX request basic execution information. Right now, plugin is not returning a list of logged errors or SQL queries, because both can produce huge output that goes over the HTTP header limits. Plan is to introduce these in the future plugin versions.
Info Panels
In the administration Tools menu, the plugin adds a DebugPress Info page showing several panels
- PHP Info: full formatted results from
phpinfo()function - OPCache Info: full settings and statistics for the OPCache PHP extension
- MySQL Variables: full MySQL settings retrieved from the database
- Plugin Documentation: DebugPress Website
- Support Forum: Dev4Press Support
安装:
General Requirements
- PHP: 7.4 or newer
- Tested with the latest PHP, version 8.5
- WordPress: 5.6 or newer
- Tested with the latest WordPress, version 7.0
- Upload folder
debugpressto the/wp-content/plugins/directory - Activate the plugin through the 'Plugins' menu in WordPress
- Plugin settings are available under WordPress 'Settings' panel
常见问题:
How can I enable WordPress Debug Mode?
To enable WordPress debug mode via wp-config.php, check out the article here: WordPress Setup.
How can I open Debugger popup?
If you have enabled debugger (for admin side and/or frontend), Debugger is activated via Bug button placed in the WordPress Toolbar or as a float button (depending on the settings). Since version 3.0, you can activate the button via keyboard shortcut, default combination is ctrl+shift+u, but it can be changed in the plugin settings.
Can I change the size and position of the popup?
Yes. Once the popup is open, you will find the Layout icon next to the button to close the popup. On the layout panel, you can change the location for the popup, size, modal status and auto activation on page load.
Where can I configure the plugin?
Open the WordPress 'Settings' menu, there you will find 'DebugPress' panel.
更新日志:
4.2 (2026.06.30)
- New: tested with WordPress 7.0
- New: tested and compatible with
PHP8.5 - New: eslint and stylelint support
- New: panel for Freemius
- Edit: reorganized SCSS code to modernize loading
- Edit: many improvements to the SCSS code and styling
- Edit: many improvements to the JS code
- Edit: Kint Pretty Print Library 6.1
- New: tested with WordPress 6.8
- New: tested and compatible with
PHP8.4 - New: additional functions for logging
- Edit: improvements to plugin initialization
- Edit: various small improvements and tweaks
- Edit: expanded support for Dev4Press Library
- Edit: Kint Pretty Print Library 6.0.1
- Fix minor issue with PHP 8.4 and error reporting
- New: tested with WordPress 6.7
- New: tested and compatible with
PHP8.4 RC 3 - New: using composer to load
Kintlibrary - New: various constants for KINT library control
- Fix: one more issue with the access to OPCache status information
- Fix: problem with the Tracker when closure makes a call #08
- Edit: few more updates and improvements
- Edit: replacement of some native with WordPress functions
- Edit: various small updates and tweaks
- Edit: Kint Pretty Print Library 5.1.1
- Fix: various PHP notices related to PHP 8.1 and newer
- Edit: few minor tweaks and changes
- Edit: updates to the plugin readme file
- Edit: small changes related to the PHP 8.3 compatibility
- Fix: various PHP notices related to PHP 8.1 and newer
- Edit: changes related to WordPress and PHP code standards
- Edit: updated Query object for page query conditionals
- Edit: updated Dev4Press Library Query detection versions
- Fix: few compare statements written as assignment
- Edit: Increase Kint Library depth levels to 12
- Edit: Kint Pretty Print Library 5.1.0
- Fix: Small issue with getting the OPCache version when not allowed by the server
- Fix: Internal debug to error log remain in the source code
- New: Tracker logs the trace for each HTTP API request made
- New: Tracker executes action for every completed HTTP API request
- New: AJAX Tracker executes action for every completed Admin AJAX request
- New: HTTP API log shows the trace and timestamps for each request
- New: Popup tools links to the coreActivity events and logs
- New: Popup header shows icons for tabs with labels with improved sizing
- New: Popup tabs show label or icon only, depending on the screen size
- Fix: Trace information for tracker HTTP API request was lost
- Fix: Function
apache_get_versionnot working on every server
- New: Updated some plugin system requirements
- Edit: KINT now loads own helper d() and s() functions
- Edit: Various styling improvements and tweaks
- Edit: Improved organization of the print libraries now moved to vendor directory
- Fix: MySQL tools panel showing error if the server information can't be retrieved
- Fix: Problem with the Info method for getting server IP in some cases
- Fix: Few more issues with Info method for getting database information
- New: Support for more versions of the Dev4Press Library
- New: System tab shows additional information about Apache
- New: System tab shows WordPress database overview information
- New: Remember open/close sections on some panels
- Edit: Some changes to the displayed System and Basic tabs
- Edit: Various small tweaks to the plugin PHP code
- Edit: Kint Pretty Print Library 5.0.7
- Fix: Few issues with Info method for getting database information
- New: Support for the deprecated hook run handling
- New: Execute actions when each error has been logged
- New: Deprecated tracking now logs the caller information
- Edit: Improved caller trace cleanup for error calls
- Edit: Display more relevant error source file and log for errors
- Edit: Errors tab moved to the end of the display order
- Edit: Changed tab order for several other debugger tabs
- Edit: Various small tweaks to the plugin PHP code
- Fix: Fatal error tracking calling default handler directly
- Fix: Sometimes errors not getting displayed in the Error tab
- New: Identify SQL queries sources for Dev4Press plugins
- New: Hooks panel can filter by the WordPress Admin callbacks
- Edit: Improved method for displaying button activation flags
- Edit: Many improvements to escaping variables for display
- Edit: Better optimized included images for logos
- Edit: Various small tweaks to the plugin PHP code
- Edit: Various small tweaks to the main JavaScript file
- Fix: Hooks panel not filtering MU Plugins
- Edit: Minor updates to the plugin readme file
- Edit: Various improvements to the PHP core code
- Fix: Warnings related to OPCache for some PHP configurations
- New: Modify debugger popup layout and size
- New: Modify debugger popup modal state
- New: Modify debugger popup opening state (auto, manual, remember state)
- New: Save active tab and show it first on next page load
- New: Trigger debugger popup display via keyboard shortcut
- New: Access Key option to enable loading on demand via URL
- New: Settings block and information for the On Demand access
- New: Settings block and information for shortcut key activation
- New: Admin bar button has basic stats dropdown menu
- New: Plugin settings Help tab with On Demand information
- New: Content tab split into Content and Rewrite tabs
- New: Basic tab shows currently active theme information
- New: Admin tab content moved to the Request tab
- New: Refreshed the debugger look with new icons
- New: Function to write log entry into custom info/log file
- New:
IPclass mostly rewritten and expanded - New: Mousetrap Javascript v1.6.5 library
- Edit: Few improvements to the plugin init and load process
- Edit: Various improvements to the PHP core code
- Edit: Changes to some plugin default settings
- Edit:
IPclass expanded Cloudflare IP range - Edit: Smart Animated Popup v2.0 library
- Del: Removed the dedicated Admin tab
- Fix: Few issues with the
IPclass range methods Full changelog: DebugPress Changelog