Diagram Factory
| 开发者 |
ipublia
thmufl |
|---|---|
| 更新时间 | 2017年8月3日 22:20 |
| 捐献地址: | 去捐款 |
| PHP版本: | 3.9 及以上 |
| WordPress版本: | 4.8.1 |
| 版权: | GPL3 or later |
| 版权网址: | 版权信息 |
详情介绍:
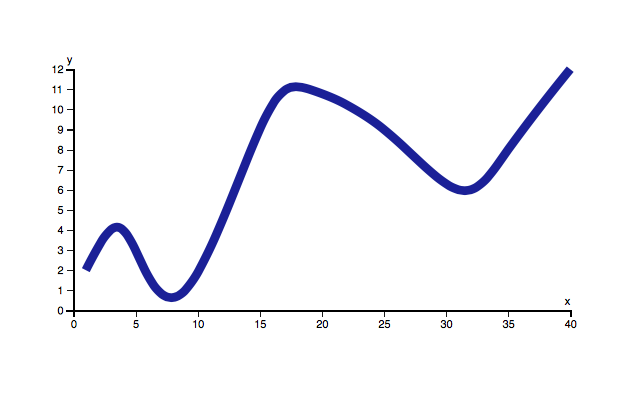
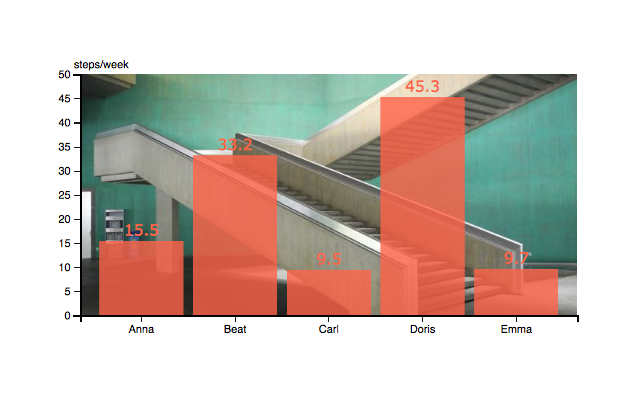
Add beautiful diagrams (charts) to your WordPress post and pages.
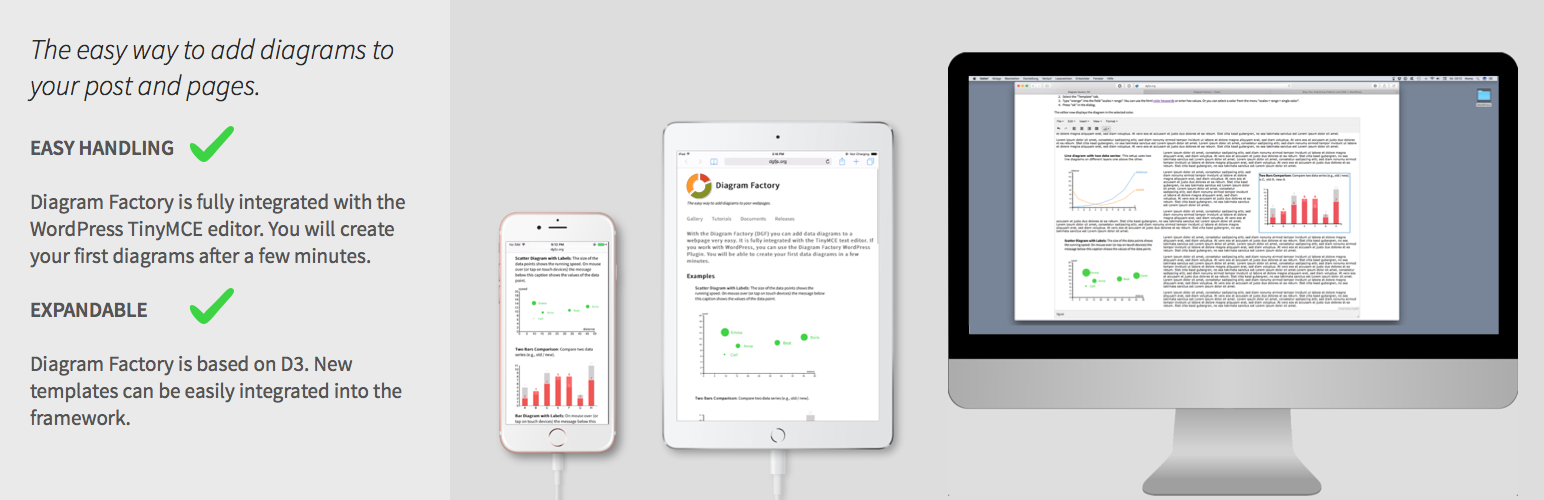
Easy handling
Diagram Factory is fully integrated with the WordPress TinyMCE editor. You will be able to create your first data diagrams immediately.
Combines the Strengths D3, TinyMCE and WordPress
Diagram Factory is based on D3 (Data-Driven-Documents) and TinyMCE. New templates can be easily integrated into the framework.
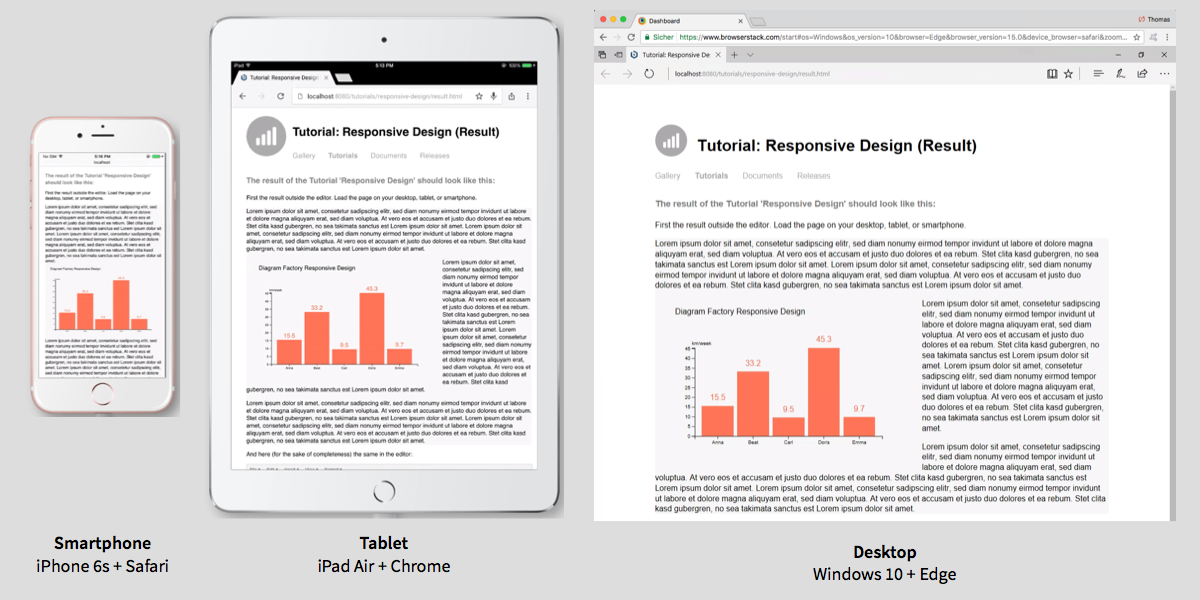
Responsive Design
With the Diagram Factory you can influence exactly how your diagrams will look on different platforms (smartphones, tablets, desktops, etc.). All diagrams can have zoom and pan to let the user focus on details.
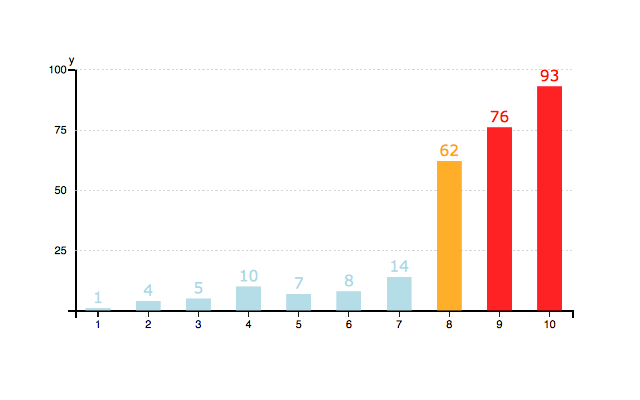
Adapts to your needs
Diagram Factory gives you many possibilities to design data diagrams according to your ideas. You will create expressive data diagrams in a short time.
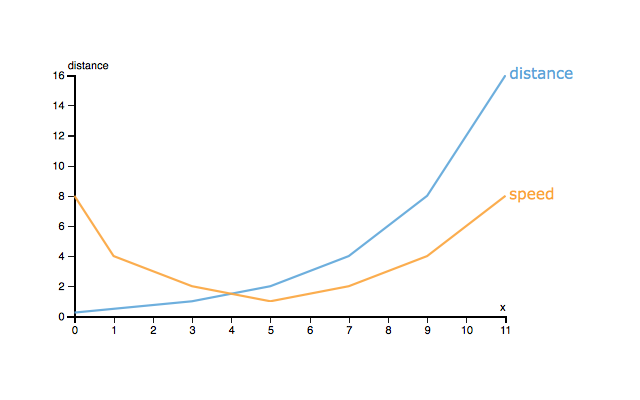
Layered approach
Diagram Factory has a layered approach. Different diagram types can be combined with each other. This gives a great deal of flexibility in the design of your data visualization.
Hosted on Github and tested on many platforms
The Diagram Factory documentation and source code are hosted on Github. Diagram Factory is constantly tested and runs in all common environments. Visit the Diagram Factory Wiki for a detailed list.
Product Homepage
On the Product Homepage you will find a Gallery with sample applications and Tutorials.
安装:
- Install and activate the plugin through the 'Plugins' menu in WordPress
- Optional: Define your custom setups in the 'Diagram Factory' menu in WordPress
屏幕截图:
常见问题:
In which environments was the software tested?
Diagram Factory is constantly tested and runs in all common environments. Visit the DGF Wiki for a detailed list.
Where can I try the software?
You can work with a live installation of the editor in the Diagram Factory Tutorials. Select the '101' and create your first diagram.
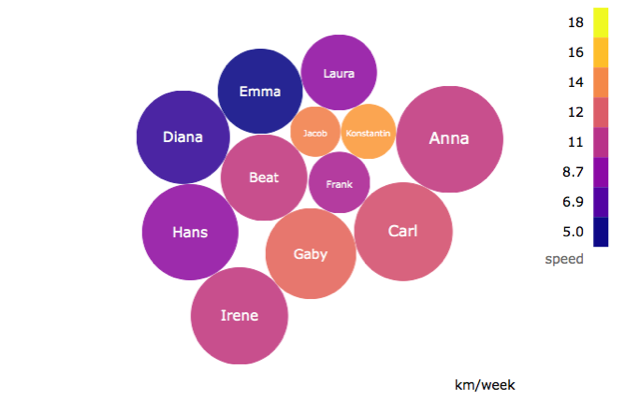
The "bubble diagram" setup is not displayed. What do I have to do?
Add the setup "dgf.setupHierarchic", then it should be displayed.
更新日志:
0.9.83
- Maintenance release for WordPress 4.8.1
- Fix
- Removed gallery from basic distribution of the plugin.
- Added zoom/pan.
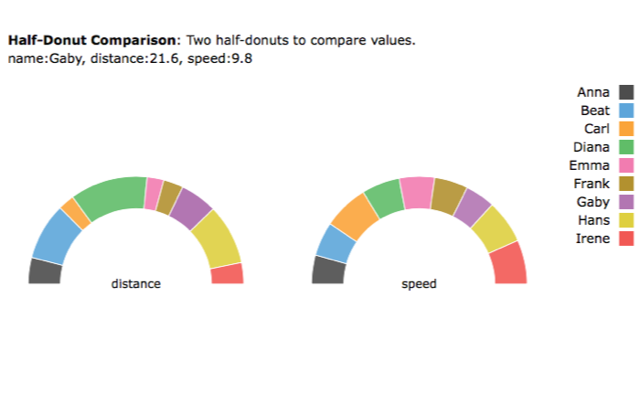
- Added half donut setups.
- Added half donut comparison setups.
- Reload data only when diagram at least partially visible.
- Enhanced layer handling (z-index, transformations).
- Added legends for ordinal, threshold and sequential scales.
- Added setup for chromatic scales (dgf.setupD3ScaleChromatic).
- Fixes
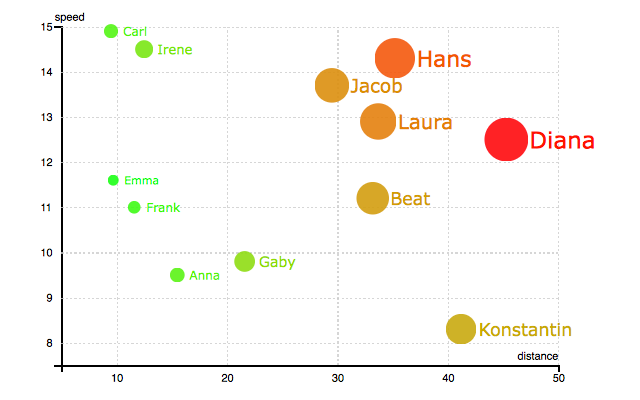
- Added bubble diagrams.
- Fixes
- Fixed setup errors (y1 scale).
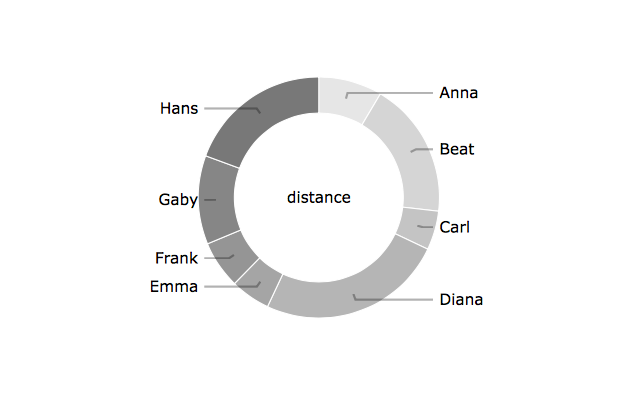
- Added pie and donut diagram.
- Fixed problems when deleting layers.
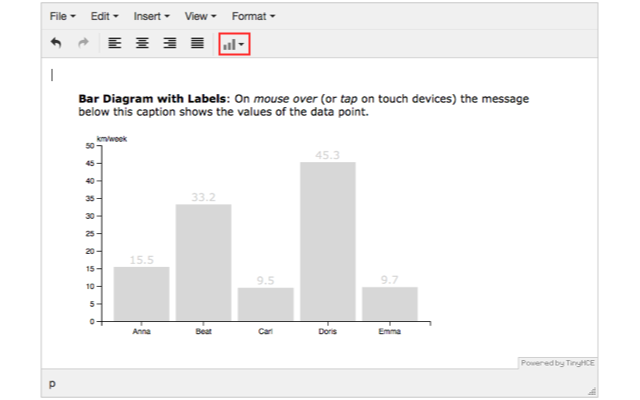
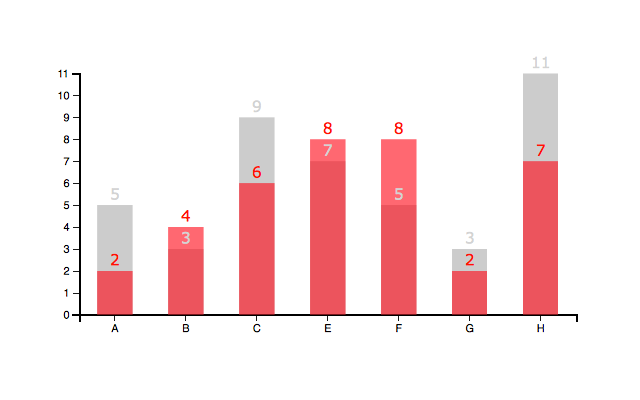
- Added "two bars compare" setup.
- Added automatic mapping from axis labels to data keys.
- Fixed dsv reader problems with tabs.
- Added a 'responsive css' style. With this, you can control the behavior on different devices.
- The inconsistent behavior when creating new diagrams has been solved.
- Added the html code to setup tab. You can copy this directly into your webpage to display the diagram.
- Fixed caching problem of readers.
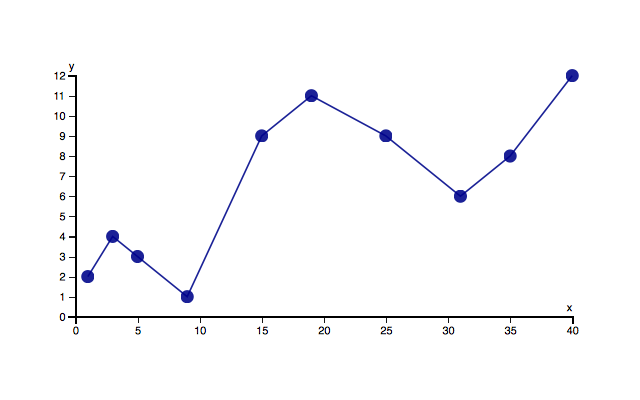
- Added scatter diagram setup.
- Added gallery setup (dgf.setupGallery).
- Fixed problems with admin menu position.
- Initial release on wordpress.org