Factmint Charts
| 开发者 | chrismichaelscott |
|---|---|
| 更新时间 | 2015年3月20日 23:11 |
| PHP版本: | 4.1.1 及以上 |
| WordPress版本: | 4.1.1 |
| 版权: | MIT |
| 版权网址: | 版权信息 |
详情介绍:
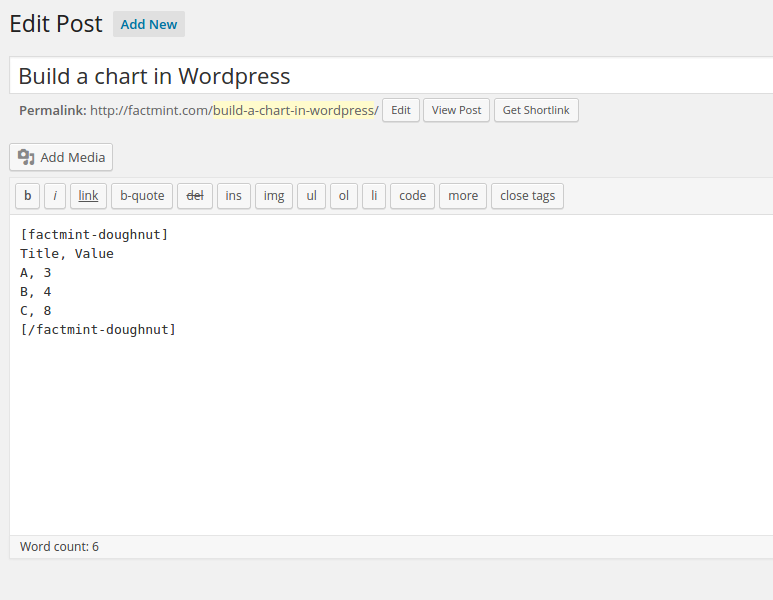
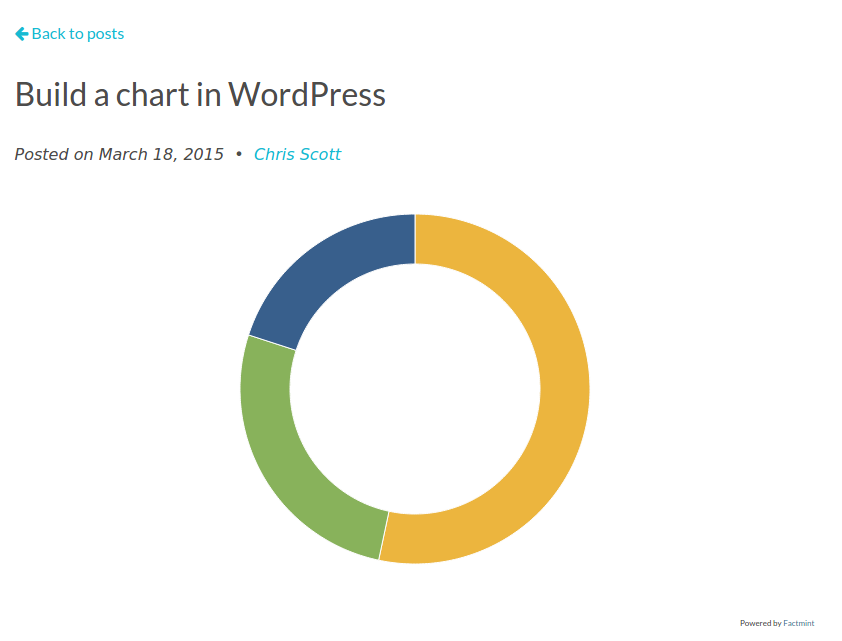
Factmint Charts is used to progressively enhance HTML tables into interactive SVG data visualizations. This plugin provides shortcodes for creating those charts. Current charts available are:
- Pie Chart = [factmint-pie]
- Doughnut Chart = [factmint-doughnut]
- Line Chart = [factmint-line]
- Stacked Area Chart = [factmint-stacked-area]
- Candlestick Chart = [factmint-candlestick]
- Scatter Graph = [factmint-scatter]
- Bubble Chart = [factmint-bubble]
- Bar (or column) Chart = [factmint-column-bar]
安装:
- Install and activate the plugin
- Go to http://charts.factmint.com (log in required) and register your domain Factmint Charts are free to use for non-commercial entities and commercial licences are available (see http://factmint.com/charts/).