
FizteQ Pulse - Monitoring and error tracking
| 开发者 | fizteq |
|---|---|
| 更新时间 | 2026年5月18日 14:13 |
| PHP版本: | 7.4 及以上 |
| WordPress版本: | 7.0 |
| 版权: | GPLv2 or later |
| 版权网址: | 版权信息 |
详情介绍:
- PHP errors & exceptions — Fatal errors, uncaught exceptions, and user errors with full stack traces
- Plugin changes — Activations, deactivations, installs, updates, and pending updates
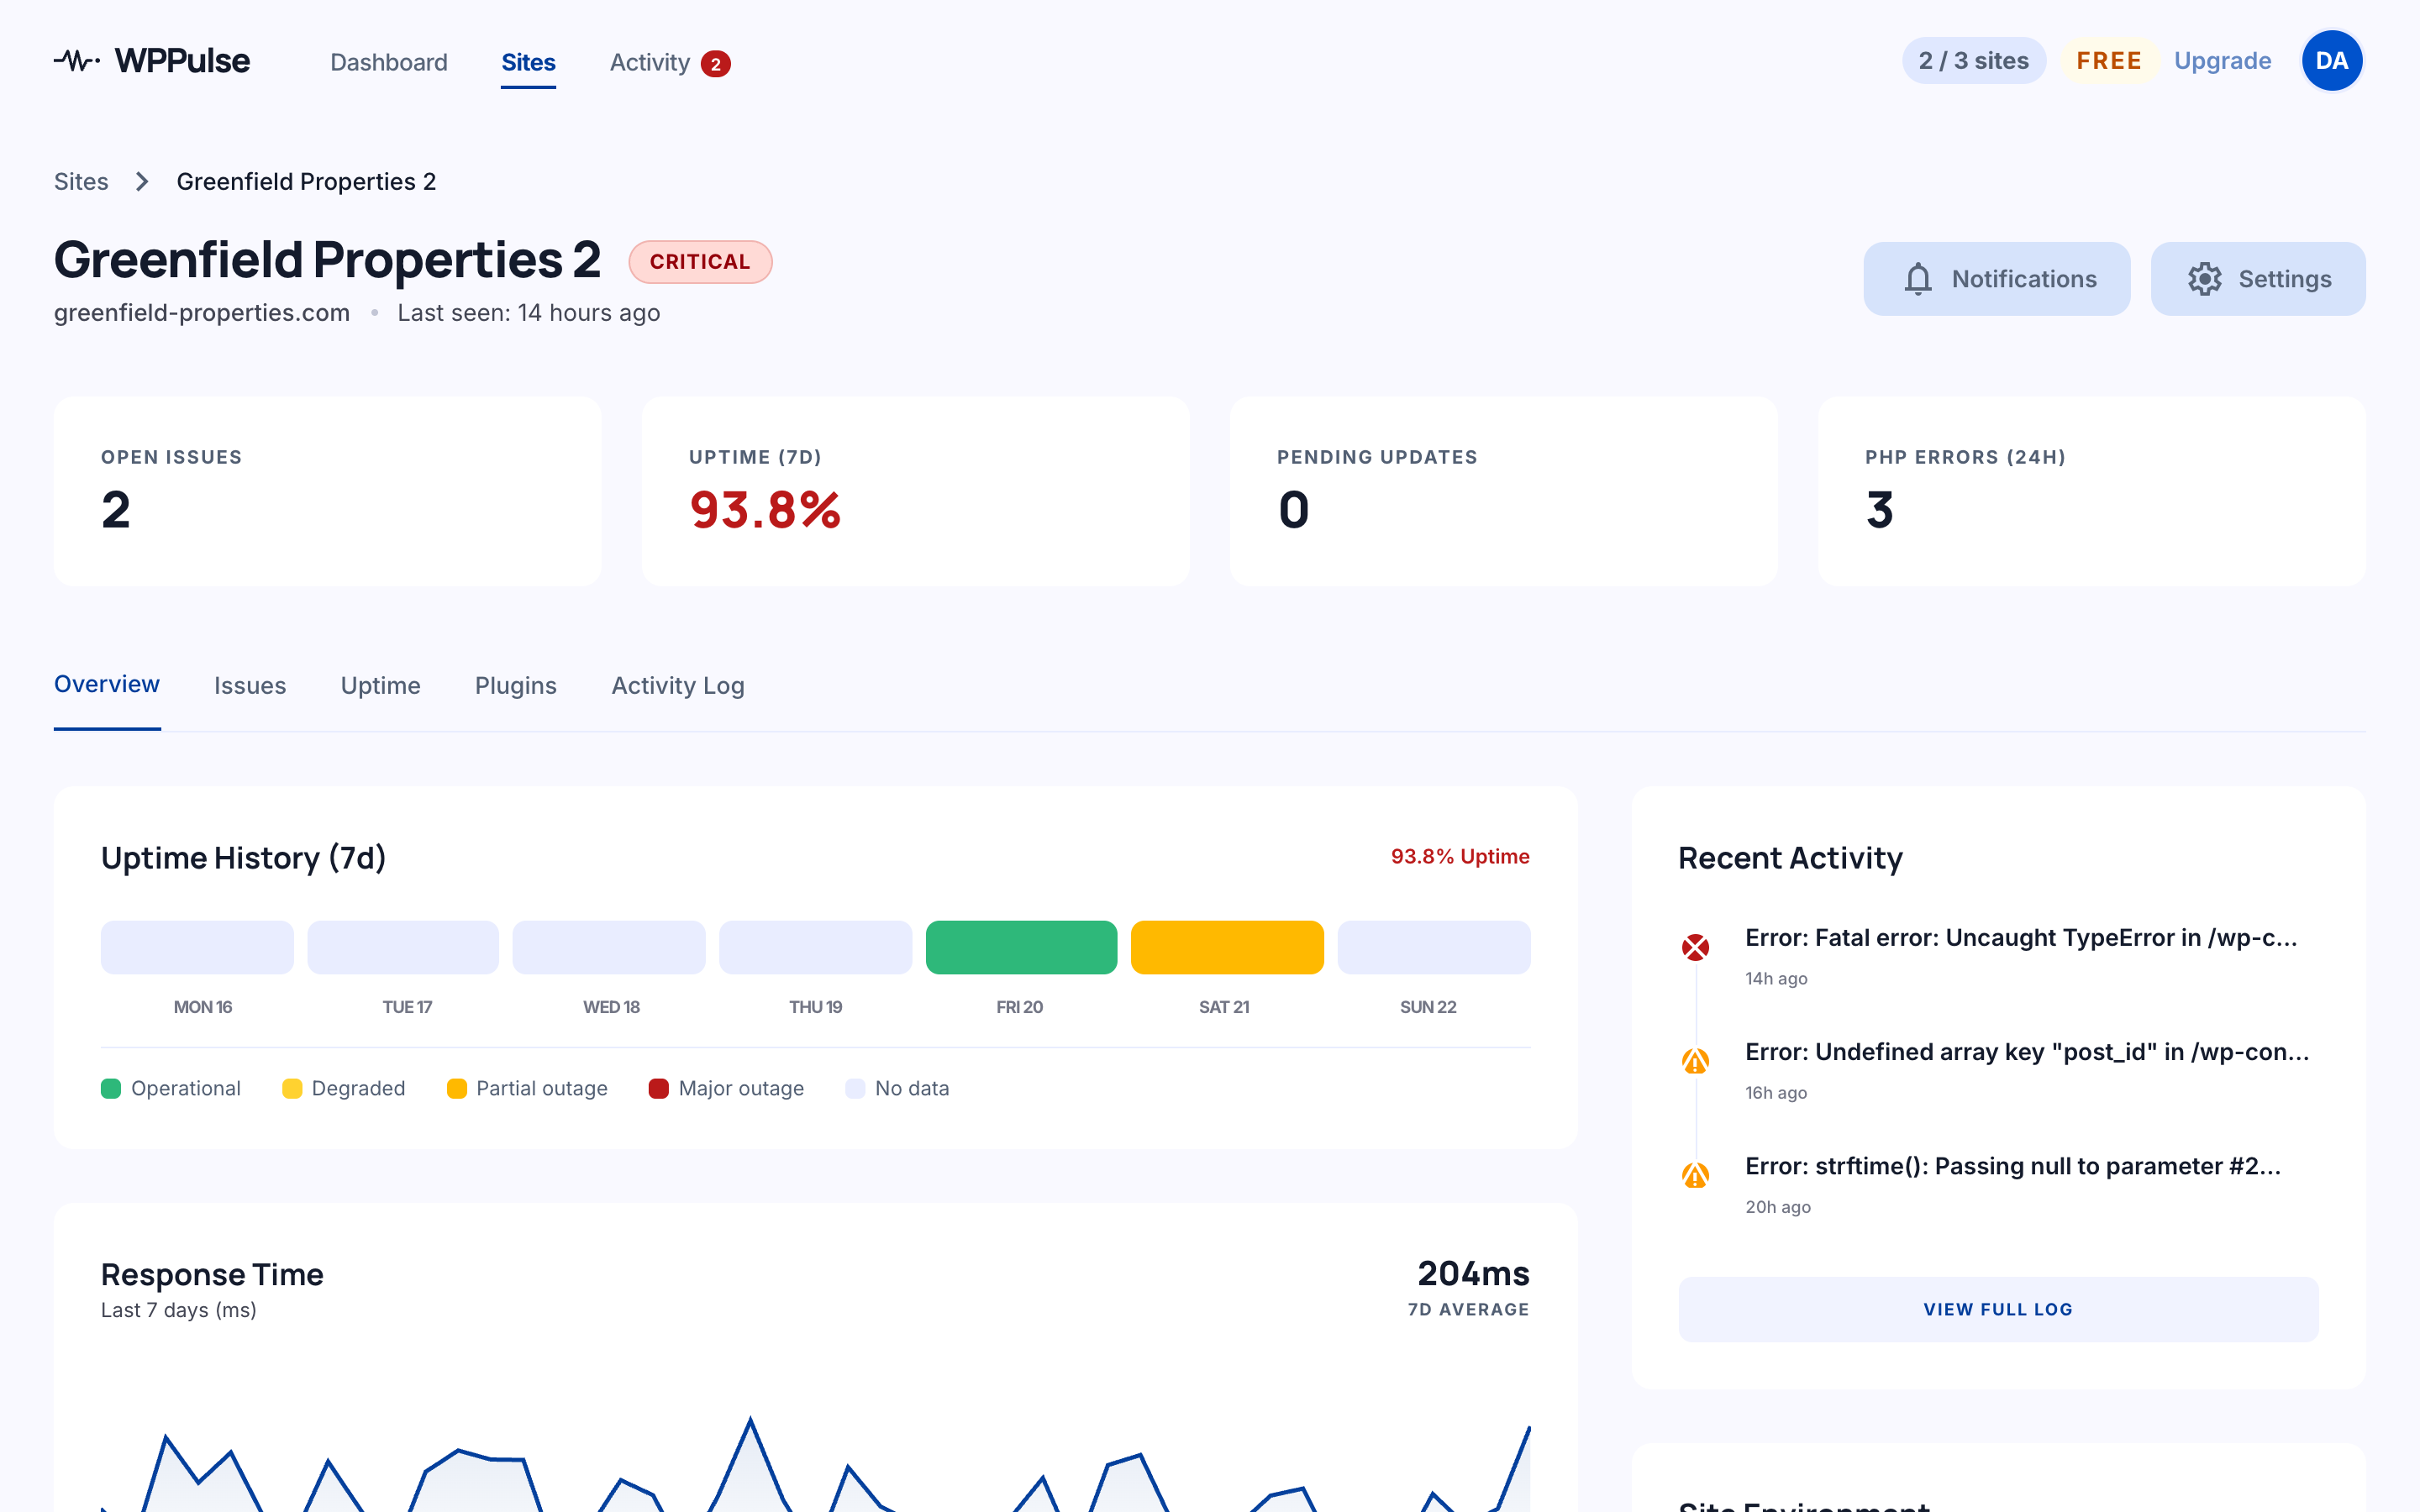
- WordPress core updates — Get alerted when a new WordPress version is available
- Security events — Admin user creation, deletion, and role changes
- Database errors — Query failures with sanitised error details
- REST API errors — 4xx and 5xx responses on WordPress REST endpoints
- Cron job failures — Detect overdue or silently failing scheduled tasks
- Server resources — Disk space and memory usage warnings
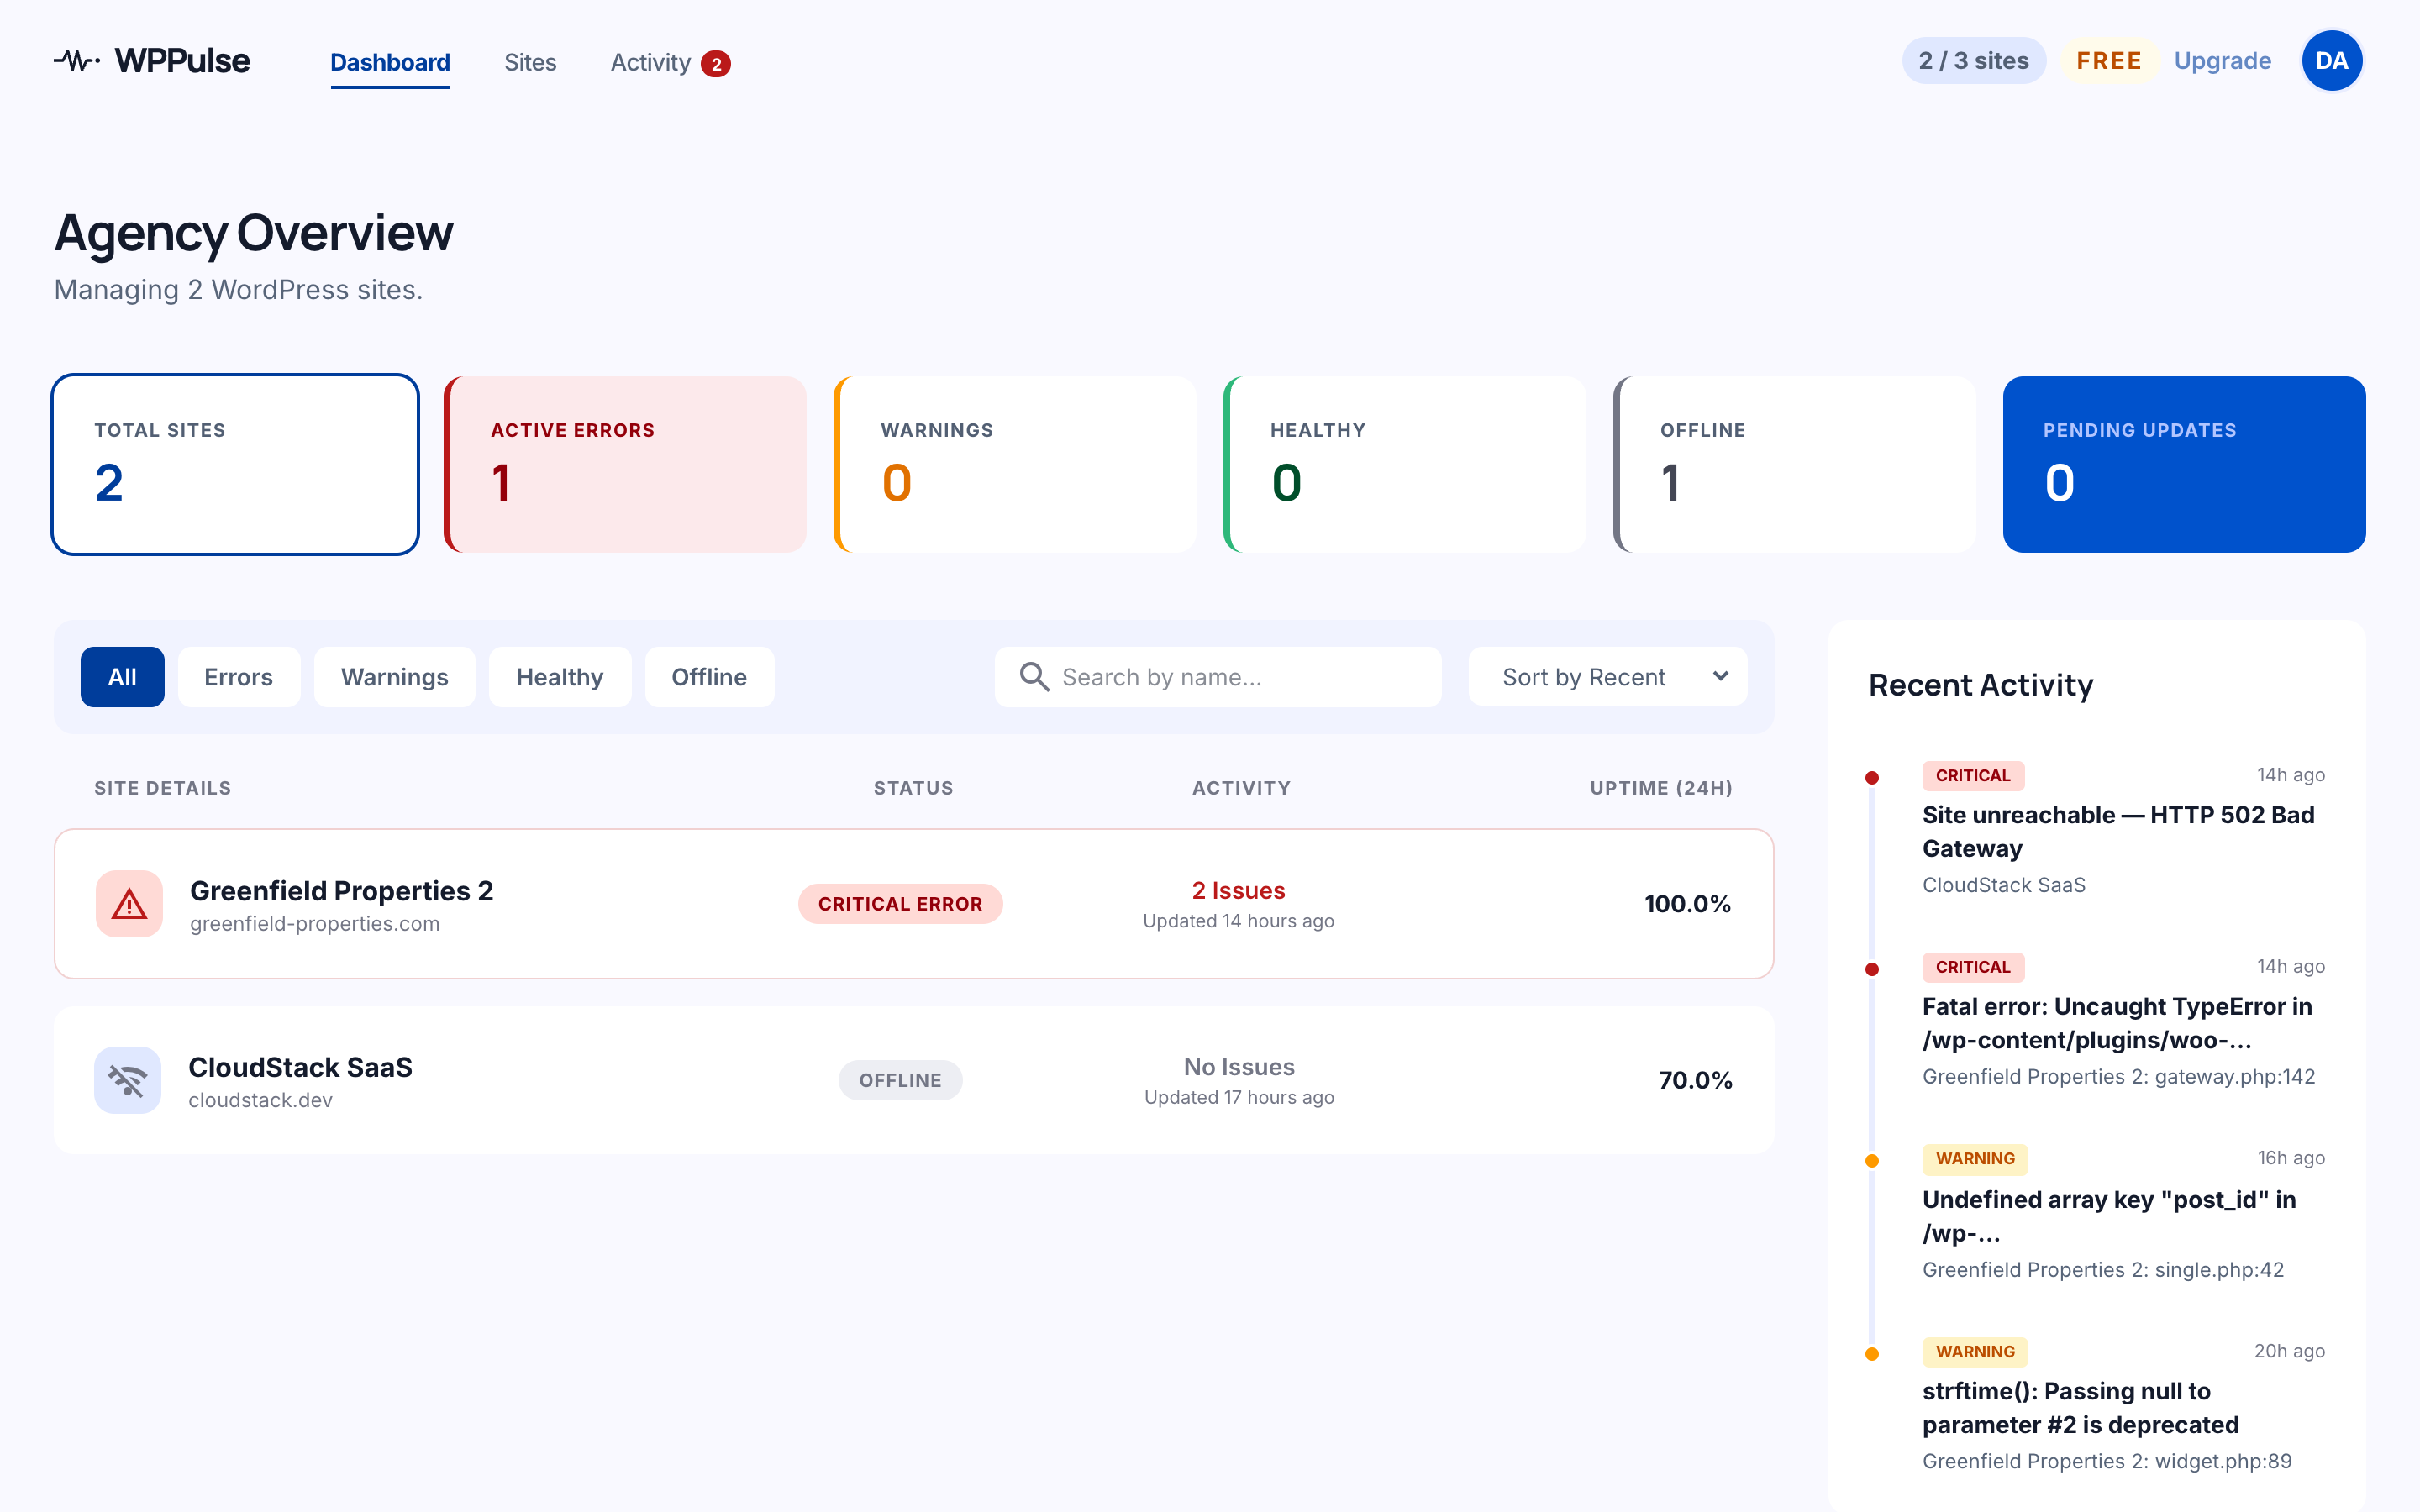
- Multi-site dashboard — See all your client sites at a glance with status indicators
- Smart alerts — Digest-based notifications so you don't get spammed
- 4 notification channels — Email, Telegram, Discord, and Slack
- WordPress-native — Purpose-built for WordPress, not a generic error tracker
- Privacy first — Sensitive data (passwords, tokens, PII) is automatically filtered before anything leaves your site
- EU-hosted & GDPR-compliant — Servers in Bucharest, Romania. No data leaves the EU.
- Lightweight — No frontend JavaScript, no database tables, no impact on your visitors
- Sign up at wp-pulse.app and add your site
- Install this plugin and enter the API key from your dashboard
- That's it — errors and events start flowing to your dashboard immediately
wp-pulse.app. No data is transmitted until you configure the plugin with your API key. The plugin does not contact any external server until you explicitly connect it.
Data transmitted to WPPulse:
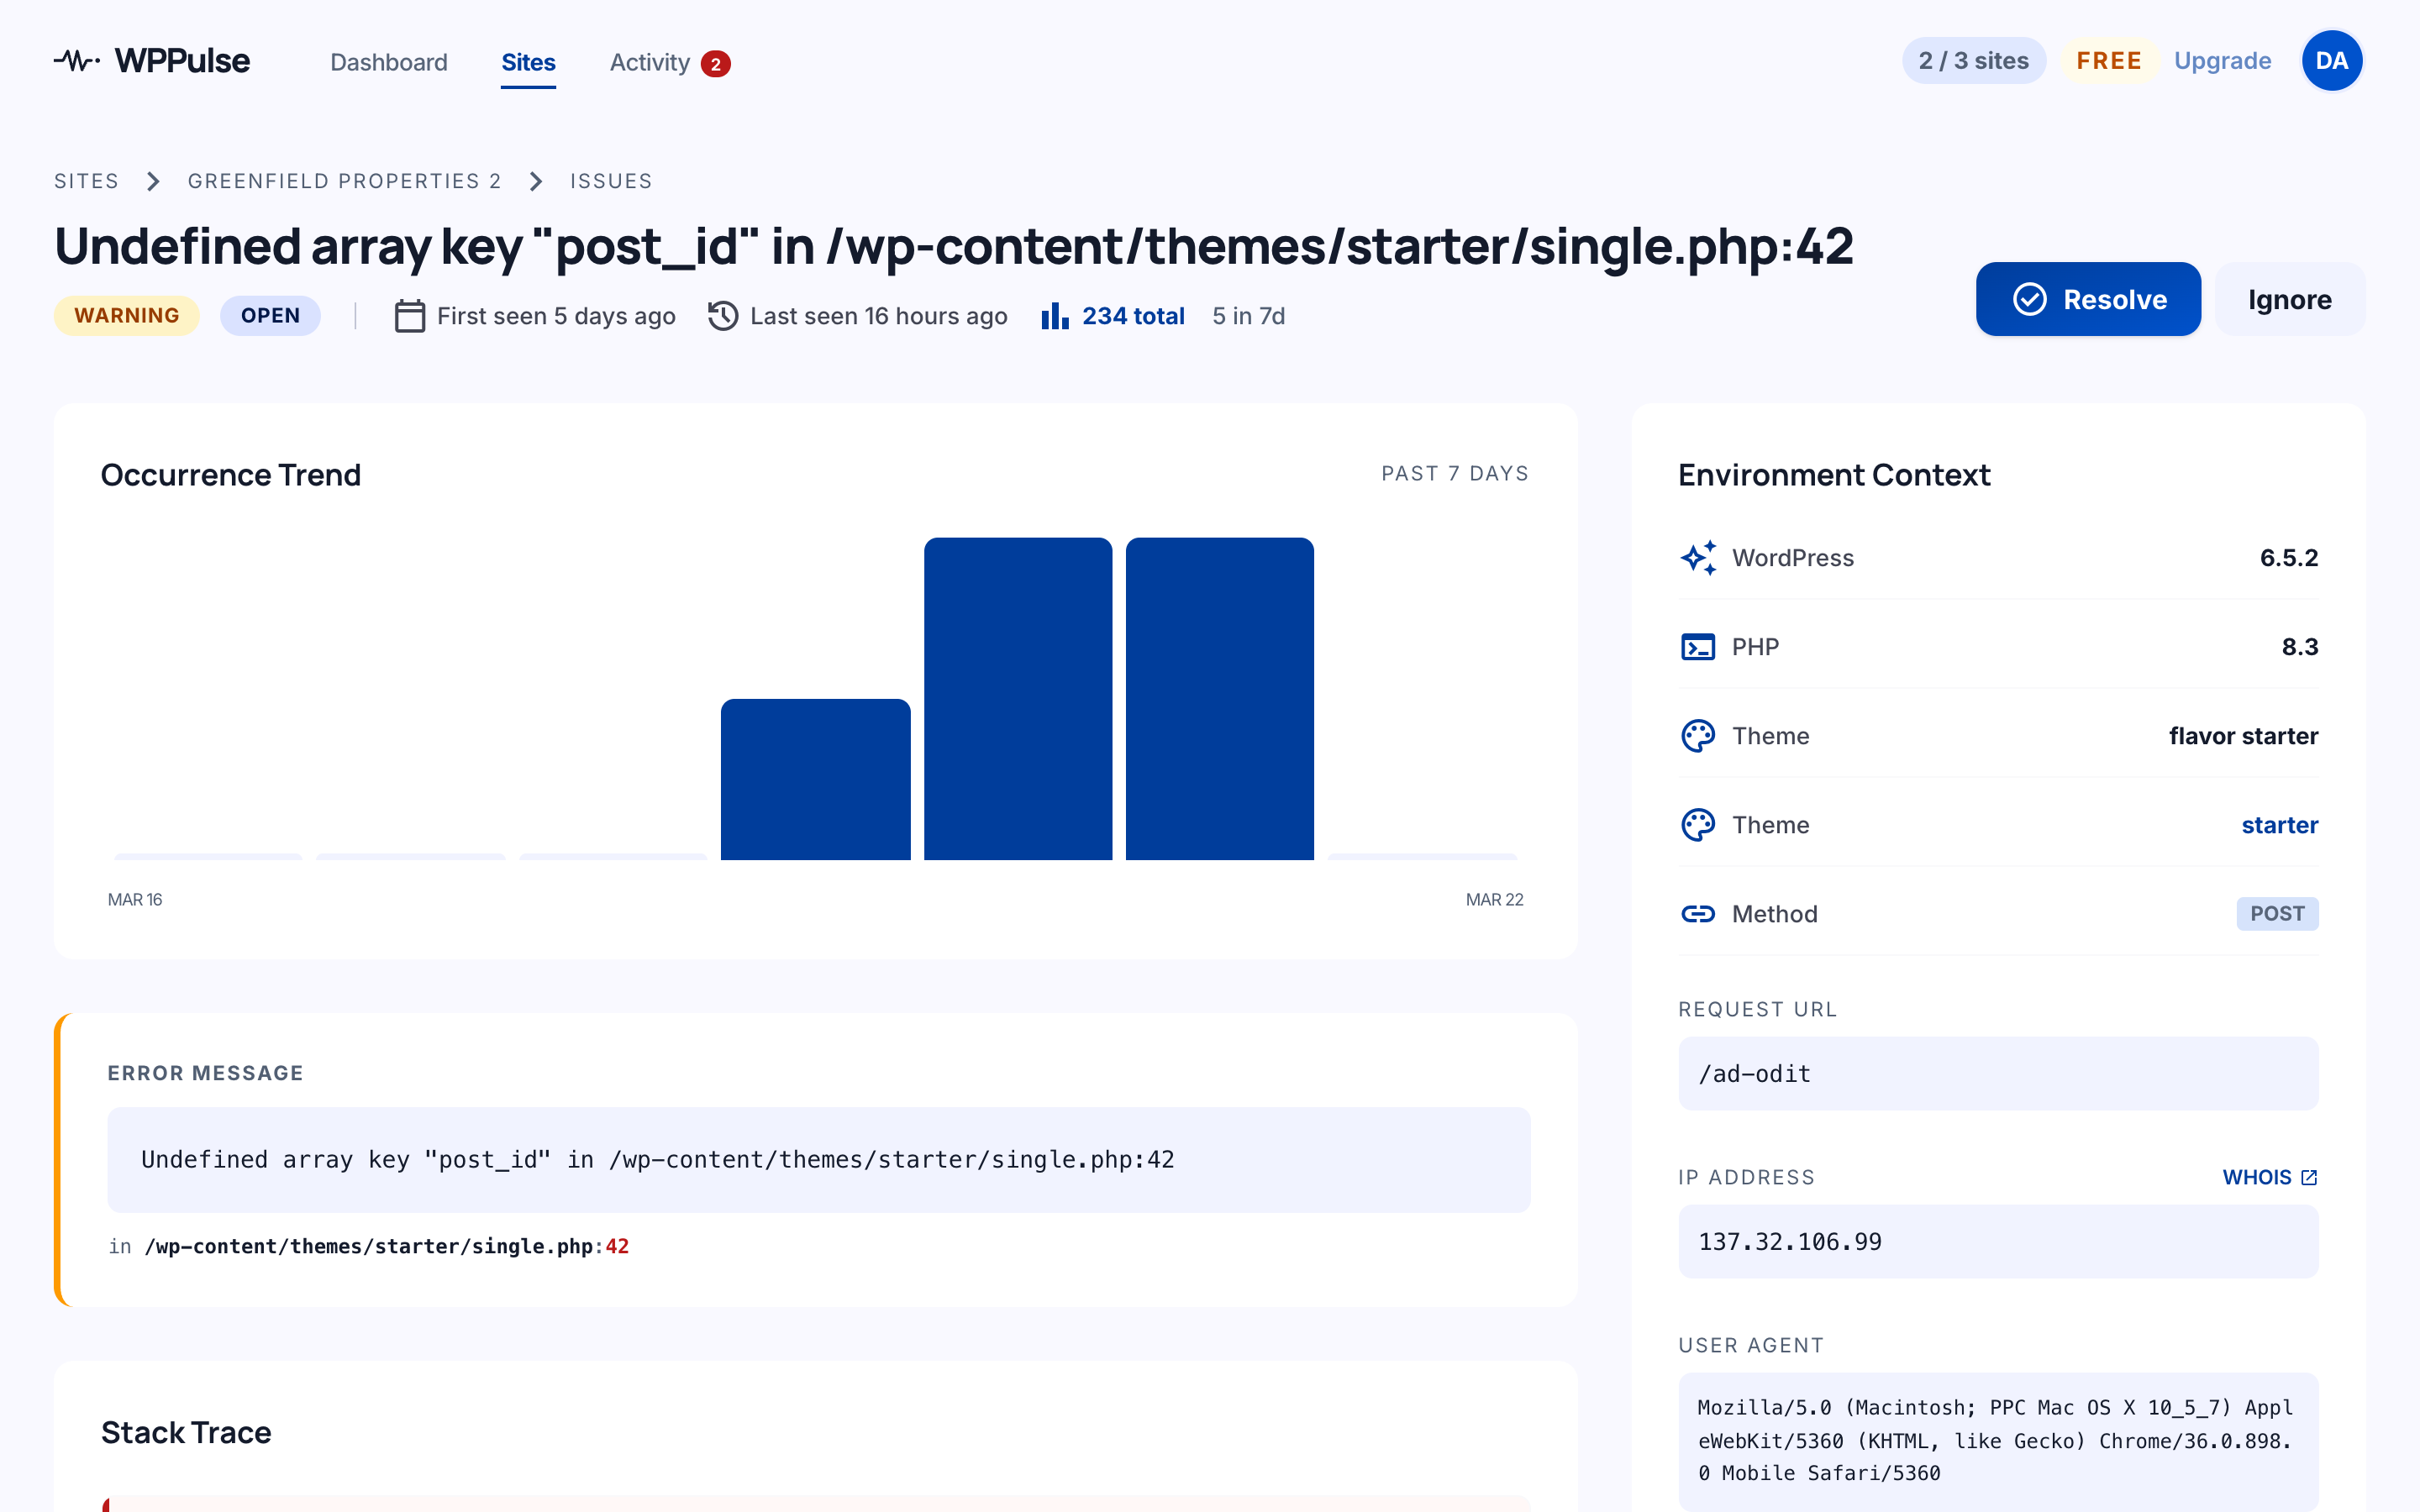
- PHP error details: error class, message, file path (relative, server root stripped), line number, stack trace
- Plugin events: activation, deactivation, install, update, pending updates
- Security events: admin user creation, deletion, role changes (user ID and role only — no names or emails)
- Database errors: sanitised error message and query (all literal values replaced with placeholders)
- REST API errors: route, method, status code
- Cron failures: hook name and schedule
- Resource warnings: disk space and memory usage percentages
- Environment: PHP version, WordPress version, active theme name, multisite status, OS name, plugin version
- Request context (on errors only): HTTP method, URL path (no query string), filtered headers, filtered POST/GET fields, user agent, IP address
[Filtered] before transmission. You can add custom fields on the settings page.
Service links:
WPPulse is operated by FizteQ Solutions SRL (Romania, EU). All data is processed and stored on servers located in Bucharest, Romania.
安装:
- Go to Plugins > Add New in your WordPress admin
- Search for FizteQ Pulse
- Click Install Now, then Activate
- Go to FizteQ Pulse in the admin sidebar
- Enter your Dashboard URL and API key (get these from wp-pulse.app)
- Click Test Connection to verify everything works
- Download the plugin ZIP file
- Go to Plugins > Add New > Upload Plugin
- Upload the ZIP file and click Install Now
- Activate the plugin and configure it under the FizteQ Pulse menu
- Dashboard URL — Pre-filled with
https://wp-pulse.app. No change needed unless directed otherwise. - API Key — Your site-specific key from the FizteQ Pulse dashboard
屏幕截图:
常见问题:
Do I need a WPPulse account?
Yes. The plugin sends monitoring data to your WPPulse dashboard at wp-pulse.app. You can sign up for a free account to get started.
What data does the plugin send?
The plugin sends error details (message, file, stack trace), plugin change events, and environment information (PHP version, WordPress version, active theme). Sensitive fields like passwords, tokens, emails, and credit card numbers are automatically filtered and never transmitted.
Does it slow down my site?
No. The plugin hooks into WordPress events and only runs when something happens (an error, a plugin change, etc.). It adds no frontend JavaScript, no database tables, and no queries to page loads. API calls use a 10-second timeout so they never block your site.
What happens if the connection to WPPulse is down?
Events are automatically queued locally (up to 50 events) and retried with exponential backoff. Once the connection is restored, all queued events are sent in a single batch. No data is lost.
Can I control which monitors are active?
Yes. Monitors are toggled from the WPPulse dashboard. After making changes there, click Sync Config in the plugin settings to pull the latest configuration.
Can I add custom fields to the privacy filter?
Yes. Go to the WPPulse settings page and add field names under Additional Filtered Fields (one per line). These are merged with the 34 built-in filtered fields. You can also use the wppulse_sensitive_body_keys and wppulse_sensitive_header_keys filters in code.
Is it GDPR-compliant?
WPPulse is built by an EU company (FizteQ Solutions SRL, Romania) and hosted entirely within the EU. Sensitive data is filtered before transmission, and the plugin does not use cookies or track visitors. See our privacy policy and DPA for full details.
Does it work with WP-CLI?
The plugin detects WP-CLI and command-line contexts. Error monitoring works in CLI mode, but request-specific data (URL, headers, POST body) is not captured since there is no HTTP request.
Does it work on multisite?
Yes. The plugin reports the multisite status as part of the environment data. Install and configure it on each site in the network where you want monitoring.
更新日志:
- Verified compatibility with WordPress 7.0 — bumped "Tested up to"
- REST API errors now include request context (URL, method, IP, user, user agent, query params) and the underlying WP REST error code and message — no more blind 400/500 reports
- Shared request-context helper on the base monitor class — all future monitors get the same context for free
- Send structured user context (ID, login, role) with plugin and security events for richer audit trail
- Pre-fill Dashboard URL with https://wp-pulse.app on activation
- Update installation instructions with correct plugin name and search term
- New: subscription status awareness — admin notices for limited, past due, and cancelled subscription states
- New: handles 402 API responses when site monitoring is paused due to plan limits
- Improvement: subscription status stored as WP option for LiteSpeed Object Cache compatibility
- Rename plugin display name to "FizteQ Pulse" to comply with WordPress.org trademark guidelines
- Enqueue admin CSS and JS via wp_enqueue_style/wp_enqueue_script instead of inline tags
- Make configuration notice dismissible
- Sanitize filtered keys with sanitize_key() in register_setting
- Move WordPress.org directory assets out of plugin zip
- Fix: remove translation update tracking — produces misleading same-version alerts
- Fix: use hook name for cron failure fingerprint deduplication
- Fix: flush monitor config option cache on settings change
- Fix: persist monitor config in option to survive cache flushes
- Fix: add heartbeat diagnostics to test connection
- Send immediate heartbeat after successful test connection for faster wizard detection
- Fix: Send site domain header for server-to-server API authentication
- Remove placeholder text from WPPulse URL field
- Initial release
- 8 monitors: PHP errors, plugins, core updates, security, database, REST API, cron, resources
- Failsafe event queue with exponential backoff
- Sensitive data filtering (34 built-in fields + custom fields)
- Dual scheduling: WP-Cron or system cron
- HTTPS enforcement and SSL verification on all API calls
- Auto-resolve when issues are fixed
- GDPR-friendly: no cookies, no visitor tracking, EU-hosted