Hook Timer
| 开发者 | sgrant |
|---|---|
| 更新时间 | 2015年2月12日 03:51 |
| 捐献地址: | 去捐款 |
| PHP版本: | 4.0 及以上 |
| WordPress版本: | 4.1 |
| 版权: | GPLv2 or later |
| 版权网址: | 版权信息 |
详情介绍:
Hook Timer attaches to the start and end of each action and filter, stores
the timestamp, and when the hook finishes, logs the total time spent. If
you want to examine why a page is slow or aren't sure where the majority of
your page load time is spent, this plugin will show you the most costly
hooks in your installation.
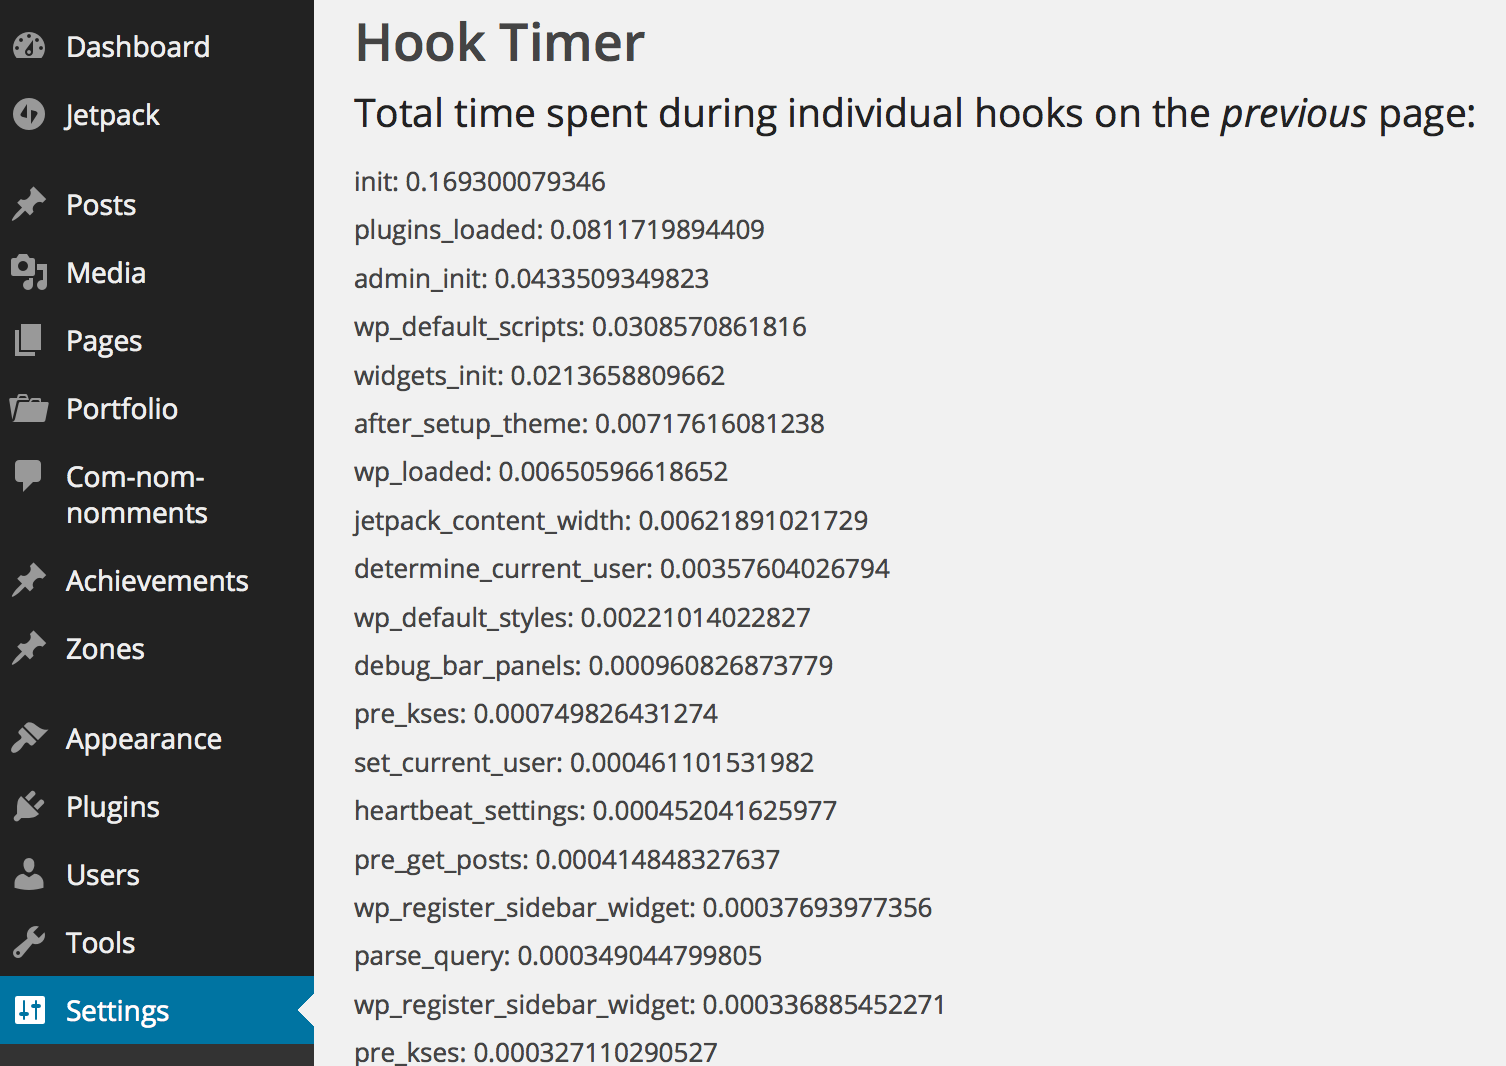
Hook Timer appears as a menu option in your admin dashboard, and displays
the total time spent in each hook on the previous page load. This allows
you to load a particular page that's slow, then to view the results in the
admin dashboard immediately after.
安装:
Place all the files in a directory inside of wp-content/plugins (for example,
hook-timer), and activate the plugin.
You can find the admin page under Settings, titled Hook Timer.
屏幕截图:
常见问题:
Where can I find the Hook Timer results?
You can find the Hook Timer page in the admin dashboard, under Settings, titled Hook Timer.
更新日志:
1.0
- First release!
