Iced Visualization Charts
| 开发者 | harshaperla |
|---|---|
| 更新时间 | 2013年6月13日 02:44 |
| 捐献地址: | 去捐款 |
| PHP版本: | 2.9 及以上 |
| WordPress版本: | 3.5.1 |
详情介绍:
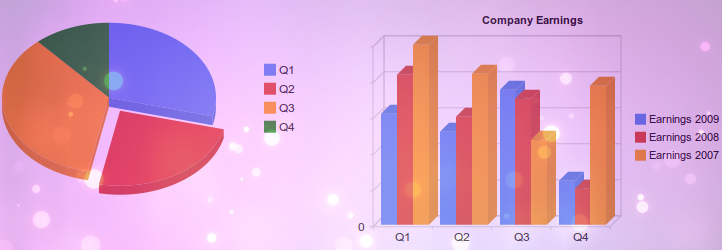
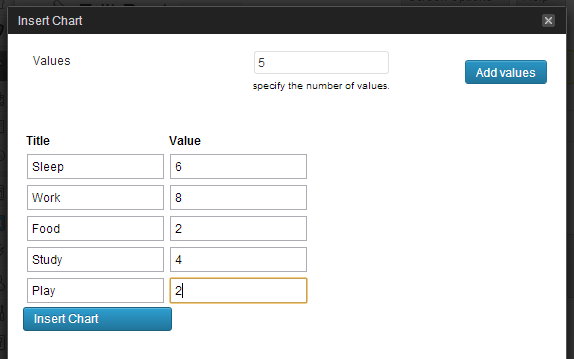
Have you ever wanted an easy way to insert Google charts to posts? With this plugin you can easily add a Visualization (Currently supports PieChart, BarChart, ColumnChart) by clicking a button in the editor and inputing data. The UI inserts shortcode as placeholders for charts.
This plugin loads the Google Visualization API JavaScript in the footer, only in the pages where chart is inserted.
For more details, visit plugin homepage: IcedApp
安装:
- Upload "Iced Visualization Chart" plugin to the
/wp-content/plugins/directory - Activate the plugin through the 'Plugins' menu in WordPress admin
屏幕截图:
常见问题:
I installed the plugin, What next?
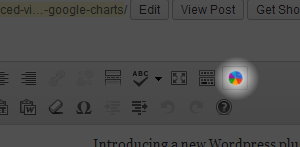
You are done! When you add a post, note a button added to the editor toolbar. Click that to insert the pie chart
I wanted other type of the chart :(
Sorry. In this version, You will be able to add only PieChart, BarChart and ColumnChart. Other options will be added in the next release, soon!
How to configure? I don't see any settings page!
There is no settings or configuration provided as of now. Everything you can do is available in post editor.
更新日志:
0.4
- Now support Bar Chart and Column Chart along with Pie Chart
- Now you can display multiple charts in a same page/post