Inline Google Spreadsheet Viewer
| 开发者 |
maymay
meitar |
|---|---|
| 更新时间 | 2020年5月14日 15:30 |
| 捐献地址: | 去捐款 |
| PHP版本: | 4.0 及以上 |
| WordPress版本: | 5.4 |
| 版权: | GPL-3.0 |
| 版权网址: | 版权信息 |
标签
下载
详情介绍:
- Update your blog post or page whenever a Google Spreadsheet or CSV file changes.
- Create beautiful interactive graphs and charts from your Google Spreadsheet or CSV files with ease.
- Customize the table's or chart's look and feel using a powerful and flexible query language and a plethora of configuration options.
- Use data from a variety of different sources: Google Spreadsheets, Google Apps Scripts, CSV files, your WordPress database, or a remote MySQL database.
- Embed almost any online document to view without leaving your blog.
- Do not email me expecting a reply. I will delete your email.
- Do not post on the support forum expecting a reply from me. I will not read your posting and will therefore not respond.
- actually read this document, or
- use the Internet to search for answers previously answered elsewhere, or
- seek help from someone other than me.
[gdoc key=""] WordPress shortcode. The only required parameter is key, which specifies the document you'd like to retrieve. All additional attributes are optional.
Google Spreadsheets
After saving the appropriate Sharing setting, copy the URL you use to view the Google Spreadsheet from your browser's address bar into the shortcode. For example, to display the spreadsheet at https://docs.google.com/spreadsheets/d/ABCDEFG/edit#gid=123456, use the following shortcode in your WordPress post or page:
[gdoc key="https://docs.google.com/spreadsheets/d/ABCDEFG/edit#gid=123456"]
CSV files
Using a CSV file works the same way as Google Spreadsheets. Set the key to the URL of the file to display it as an HTML table:
[gdoc key="http://example.com/research_data.csv"]
HTML Tables
Customizing the HTML tables that are produced is easy. For instance, to supply the table's title, <caption>, and a customized class value, you can do the following:
[gdoc key="ABCDEFG" class="my-sheet" title="Tooltip text displayed on hover"]This is the table's caption.[/gdoc]
The above shortcode will produce HTML that looks something like the following:
This is the table's caption.
By default, all tables are progressively enhanced with jQuery DataTables to provide sorting, searching, and pagination functions on the table display itself. If you'd like a specific table not to include this functionality, use the no-datatables class in your shortcode. For instance:
[gdoc key="ABCDEFG" class="no-datatables"]
Web addresses and email addresses in your data are turned into links. If this causes problems, you can disable this behavior by specifying no to the linkify attribute in your shortcode. For instance:
[gdoc key="ABCDEFG" linkify="no"]
Each table can be customized per-table, using shortcode attributes, or globally for your entire site, using the plugin's settings screen. You can freeze the table header, columns, control pagination length, and more. Refer to the Other Notes section for a full listing of supported customization attributes.
Charts
Data from Google Spreadsheets or CSV files can be graphed in interactive charts. To visualize your data as a chart, add the chart attribute to your shortcode and supply a supported chart type. You can make:
AnnotatedTimeLinechartsAnnotationchartsAreachartsBarchartsBubblechartsCandlestickchartsColumnchartsCombochartsGaugechartsGeochartsHistogramchartsLinechartsPiechartsScatterchartsSteppedarea chartsTimelinecharts
query attribute. This lets you interact with the data in your Google Spreadsheet or CSV file as though it were a relational database table. For instance, if you wish to display the team that scored the most goals on your website, you might use a shortcode like this to query your Google Spreadsheet and display the highest-scoring team, where the team name is the first column (column A) and that team's score is the second column (column B):
[gdoc key="ABCDEFG" query="select A where max(B)"]
Queries are also useful if your spreadsheet contains complex data from which many different charts can be created, allowing you to select only the parts of your spreadsheet that you'd like to use to compose the interactive chart.
Using a MySQL Database
After an administrator enables the SQL queries option in the plugin's settings screen, privileged users can also retrieve data from the WordPress database by supplying the keyword wordpress to the key attribute of your shortcode along with a valid MySQL SELECT statement. This can be useful for displaying information that other plugins save in your website's database or that WordPress itself maintains for you.
For example, to show a table of user registration dates from the current blog:
[gdoc key="wordpress" query="SELECT display_name AS Name, user_registered AS 'Registration Date' FROM wp_users"]
Remote MySQL databases are also accessible by supplying a MySQL connection URL with valid access credentials. For example, to show the prices from an inventory database hosted by a MySQL server at server.example.com by logging in as user with the password password and querying for items that are in stock:
[gdoc key="mysql://user:password@server.example.com/inventory" query="SELECT sku AS 'Item No.', product_name AS Product, price AS Price WHERE in_stock=TRUE"]
Using Google Apps Script Web Apps
You can also supply the URL endpoint of any Google Apps Script Web App to retrieve the output from that app and insert it directly into your WordPress post or page. This works exactly the same way as Google Spreadsheets do, so you can use this feature to display arbitrary data on your WordPress site.
For example, suppose you maintain a GMail account for fans of your podcast to write you questions, and you want to automatically display some information from these emails on your website. Using GMail filters and labels, you can access these emails through a Google Apps Script that reads your email, counts the number of mail messages in your different labels, and returns that count as an HTML list fragment. Deploy that Google Apps Script as a Web App and supply its URL to the gdoc shortcode:
[gdoc key="https://script.google.com/macros/s/ABCDEFG/exec"]
Now your website is automatically updated whenever you receive a new question in email from your listeners.
Embedding other documents
You can also supply the URL of any file online to load a preview of that file on your blog. To do so, supply the file's URL as your key:
[gdoc key="http://example.com/my_final_paper.pdf"]
To tweak the way your preview looks, you can use the width, height, or style attributes:
[gdoc key="http://example.com/my_final_paper.pdf" style="min-height:780px;border:none;"]
安装:
- Upload the unzipped
inline-google-spreadsheet-viewerfolder to the/wp-content/plugins/directory. - 通过WordPress的“插件”菜单激活插件。
- Use the
[gdoc key="ABCDEFG"]shortcode wherever you'd like to insert the Google Spreadsheet.
- PHP 5.3 or later is required.
屏幕截图:
. If your spreadsheet was created a while ago and still uses an "old" style Google Spreadsheet, [use the "Publish as a webpage" option](https://support.google.com/docs/answer/183965). Make a note of the URL of your Google Spreadsheet's editing page.](https://cdn.jsdelivr.net/wp/inline-google-spreadsheet-viewer/assets/screenshot-1.png)
![On-screen help gives you instructions for using the plugin where you need it. Paste the address of your Google Spreadsheet into the `key` parameter of the plugin's shortcode (`[gdoc key="YOUR_SPREADSHEET_URL_HERE"]`), then save your post.](https://cdn.jsdelivr.net/wp/inline-google-spreadsheet-viewer/assets/screenshot-2.png)
 for coding details.](https://cdn.jsdelivr.net/wp/inline-google-spreadsheet-viewer/assets/screenshot-3.png)
 for a detailed list.](https://cdn.jsdelivr.net/wp/inline-google-spreadsheet-viewer/assets/screenshot-4.png)
 to pinpoint the exact data you want. Over 50 additional configuration options let you customize the exact way your graphs, charts, and tables look.](https://cdn.jsdelivr.net/wp/inline-google-spreadsheet-viewer/assets/screenshot-5.png)
其他记录:
gdoc) that can do many things through a combination of shortcode attributes. Every attribute must have a value. These attributes and their recognized values are documented here.
key- Specifies the document to retrieve.- required Every
gdocshortcode must have one and only onekeyattribute. (All other attributes are optional.) keycan be one of six types:- The fully-qualified URL of a Google Spreadsheet that has been publicly shared, like
[gdoc key="https://docs.google.com/spreadsheets/d/ABCDEFG/htmlview#gid=123456"] - The fully-qualified URL of a Google Apps Script Web App, like
[gdoc key="https://script.google.com/macros/s/ABCDEFG/exec"] - The fully-qualified URL of a CSV file or a web service endpoint that produces CSV data, like
[gdoc key="http://viewportsizes.com/devices.csv"] - The fully-qualified URL of a document on the Web. PDF, DOC, XLS, and other file formats supported by the Google Docs Viewer will be rendered using the Viewer, like
[gdoc key="http://example.com/my_final_paper.pdf"] - The keyword
wordpressto make a SQL query against the current blog's database, like[gdoc key="wordpress" query="SELECT * FROM custom_table"] - A MySQL connection URL to make a SQL query against an arbitrary MySQL server, like
[gdoc key="mysql://user:password@server.example.com:12345/database" query="SELECT * FROM custom_table"] chart- Displays Google Sheet data as a chart instead of a table. Valid values are:AnnotatedTimeLineAnnotationAreaBarBubbleCandlestickColumnComboGaugeGeoHistogramLinePieScatterSteppedTimelineclass- An optional custom HTMLclassvalue or space-separated list of values. The following class names are treated specially:no-datatablesdeactivates all DataTables features.no-responsivedeactivates only DataTables' Responsive features.FixedHeaderor its synonym,FixedHeader-top, freezes the table header (its<thead>content) to the top of the window while scrolling vertically.FixedHeader-footerfreezes the table footer (its<tfoot>content) to the bottom of the window while scrolling vertically.FixedHeader-leftorFixedHeader-rightfreezes the left- or right-most column of the table while scrolling horizontally. (You will also need to setdatatables_scroll_x="true"in your shortcode to enable horizontal scrolling.)FixedColumns-left-NorFixedColumns-right-Nfreezes the left- or right-mostNcolumns in the table, respectively. For example,class="FixedColumns-left-3"will freeze the three left-most columns.csv_headers- Whether or not to include textual headers in Google Sheet CSV exports when usingqueryorchart. (Default:0, which is to exclude them, which is equivalent to the Google default. Use1to include them.)expire_in- How long to cache responses for, in seconds. Set this to0to cache forever. (Default:600, which is ten minutes.)footer_rows- A number specifying how many trailing rows to place in the output's<tfoot>element. (Default:0.)header_cols- A number specifying how many column cells should be written with<th>elements. (Default:0.)header_rows- A number specifying how many leading rows to place in the output's<thead>element. (Default:1.)height- Height of the containing HTML element. Tables ignore this, usestyleinstead. (Default: automatically calculated.)http_opts- A JSON string representing options to pass to the WordPress HTTP API, like[gdoc key="ABCDEFG" http_opts='{"method": "POST", "blocking": false, "user-agent": "My Custom User Agent String"}'].lang- The ISO 639 language code declaring the human language of the spreadsheet's contents. For instance, usenl-NLto declare that content is in Dutch. (Default: your site's global language setting.)linkify- Whether or not to automatically turn URLs, email addresses, and so on, into clickable links. Set tonoto disable this behavior. (Default:true.)query- A Google Query Language query if the data source is a Google Spreadsheet or CSV file, or a SQLSELECTstatement if the data source is a MySQL database. Note: Arrow bracktets (<and>) in queries must be URL-encoded (%3Cand%3E, respectively) to avoid confusing the WordPress HTML parser. (Default: none.)strip- The number of leading data source rows to omit from the resulting HTML table. (Default:0.)style- An inline CSS rule applied to the containing HTML element. For example, to set a fixed height on a table, use[gdoc key="ABCDEFG" style="height: 480px;"]. (Default: none.)summary- A brief description of the information displayed for thesummaryattribute of the resulting HTML<table>. Web pages written in HTML5 should not use this; use a table caption instead. (Default: none.)title- An optional title for your data visualization or table. This is usually displayed in Web browsers as a tooltip when a user hovers over the table or is shown as the headline of a chart. (Default: none.)use_cache- Whether or not to cache spreadsheet data. Set this tonoto disable caching for that shortcode invocation. (Default:true.)width- Width of the containing HTML element. Tables ignore this, usestyleinstead. (Default:100%.)
chart attribute.
The complete list of attributes for configurable chart options is below. Refer to Google's Chart Gallery documentation for the type of chart you are using to learn more about which chart types support which chart options.
chart_aggregation_targetchart_all_values_suffixchart_allow_htmlchart_allow_redrawchart_animationchart_annotationschart_annotations_widthchart_area_opacitychart_avoid_overlapping_grid_lineschart_axis_titles_positionchart_background_colorchart_barschart_bubblechart_candlestickchart_chart_areachart_color_axischart_colorschart_crosshairchart_curve_typechart_data_opacitychart_dataless_region_colorchart_date_formatchart_default_colorchart_dimensionschart_display_annotationschart_display_annotations_filterchart_display_date_bar_separatorchart_display_exact_valueschart_display_legend_dotschart_display_legend_valueschart_display_modechart_display_range_selectorchart_display_zoom_buttonschart_domainchart_enable_interactivitychart_enable_region_interactivitychart_explorerchart_fillchart_focus_targetchart_font_namechart_font_sizechart_force_i_framechart_green_colorchart_green_fromchart_green_tochart_h_axeschart_h_axischart_heightchart_highlight_dotchart_interpolate_nullschart_is_stackedchart_keep_aspect_ratiochart_legendchart_line_widthchart_magnifying_glasschart_major_tickschart_marker_opacitychart_maxchart_minchart_minor_tickschart_number_formatschart_orientationchart_pie_holechart_pie_residue_slice_colorchart_pie_residue_slice_labelchart_pie_slice_border_colorchart_pie_slice_textchart_pie_slice_text_stylechart_pie_start_anglechart_point_shapechart_point_sizechart_red_colorchart_red_fromchart_red_tochart_regionchart_resolutionchart_reverse_categorieschart_scale_columnschart_scale_formatchart_scale_typechart_selection_modechart_serieschart_size_axischart_slice_visibility_thresholdchart_sliceschart_tablechart_themechart_thicknesschart_timelinechart_title_positionchart_title_text_stylechart_tooltipchart_trendlineschart_v_axeschart_v_axischart_widthchart_wmodechart_yellow_colorchart_yellow_fromchart_yellow_tochart_zoom_end_timechart_zoom_start_time
no-datatables class.
The complete list of core DataTables customization attributes is below. Please refer to the DataTables Options reference for more information about each particular option.
datatables_auto_widthdatatables_defer_renderdatatables_infodatatables_j_query_UIdatatables_length_changedatatables_orderingdatatables_pagingdatatables_processingdatatables_scroll_xdatatables_scroll_ydatatables_searchingdatatables_server_sidedatatables_state_savedatatables_ajaxdatatables_datadatatables_defer_loadingdatatables_destroydatatables_display_startdatatables_domdatatables_length_menudatatables_order_cells_topdatatables_order_classesdatatables_orderdatatables_order_fixeddatatables_order_multidatatables_page_lengthdatatables_paging_typedatatables_rendererdatatables_retrievedatatables_scroll_collapsedatatables_search_colsdatatables_search_delaydatatables_searchdatatables_state_durationdatatables_stripe_classesdatatables_selectdatatables_tab_indexdatatables_column_defsdatatables_columns
datatables_buttonsfor customizing the DataTables Buttons extension
常见问题:
Will my website be updated when my Google Spreadsheets change?
Yes. Changes you make to your Google Spreadsheets will be shown on your website within a few minutes.
To improve your website's performance, Inline Google Spreadsheet Viewer automatically caches spreadsheets for 10 minutes. If you are making many changes quickly and/or you don't want to wait for the cache to expire on its own, you can add the use_cache="no" attribute to your shortcode to disable the caching mechanism:
[gdoc key="ABCDEFG" use_cache="no"]
After you save and reload the page, you should see near-instant updates. Note that disabling the plugin's cache can result in decreased performance. Disabling the cache is recommended only for relatively small spreadsheets (less than 100 rows or so) or for debugging purposes.
The default style is ugly. Can I change it?
Yes, if you're able to change your theme's style sheet. The plugin renders HTML with plenty of CSS hooks. Use the igsv-table class from your style sheets to target the plugin's <table> element.
Additionally, each row (<tr>) and cell (<td>) is assigned a specific class attribute value. The first <tr> element is assigned the row-1 class, the second is assigned row-2, and the last row-N where N is the number of rows in the rendered table. Similarly, each cell is assigned a class based on its columnar position; the first cell in a row is assigned the col-1 class, the second col-2, and so on:
.igsv-table .row-2 .col-5 { / styles for the cell in the 2nd row, 5th column / }
Finally, both rows and cells (based on columns) are assigned an additional class of either odd or even, allowing for easy zebra-striping in CSS3 non-conformant browsers.
.igsv-table tr.odd { / styles for odd-numbered rows (row 1, 3, 5...) / }
.igsv-table tr.even { / styles for even-numbered rows (row 2, 4, 6...) / }
.igsv-table td.odd { / styles for odd-numbered cells (column 1, 3, 5...) / }
.igsv-table td.even { / styles for even-numbered cells (column 2, 4, 6...) / }
A table appears, but it's not my spreadsheet's data! And it looks weird!
If you're still using the "old" Google Spreadsheets, you should triple-check that you've published your spreadsheet. Google provides instructions for doing this. Be sure to follow steps 1 and 2 in Google Spreadsheets Help: Publishing to the Web. If you're using the "new" Google Spreadsheets, be sure you've selected either the "Public on the web" or "Anyone with the link" Sharing options for your Google Spreadsheet.
A Google Login page appears where my Google Apps Script output should be.
If a Google Login page appears instead of the output of your GAS Web App, double check that you've deployed your Web App with the "Anyone, even anonymous" access permission. Learn more about GAS Web App permissions.
Nothing appears where my chart should be.
The best way to determine what's wrong with a chart that isn't displaying properly is to try displaying the chart's data as a simple HTML table (by removing the chart attribute from your shortcode), and seeing what the tabular data source looks like.
Charts most likely fail to display because of a mismatch between the chart you are using and the format of your spreadsheet.
Each type of chart expects to retrieve data with a certain number of rows and/or columns. If your Google Spreadsheet is not already designed to create data for a chart, you might be able to use the query attribute to select only the rows and/or columns that the chart you're using expects. Otherwise, consider creating a new sheet with the proper formatting and setting it as the key in your shortcode.
To learn more about the correct spreadsheet formats for each chart type, please refer to Google's Chart Gallery documentation for the type of chart you are using.
Can I remove certain columns from appearing on my webpage?
If you're using the "new" Google Spreadsheets, you can strip out columns by selecting only those columns you wish to retrieve by passing a Google Charts API Query Language query to the shortcode's query attribute. For example, to retrieve and display only the first, second, and third columns in a spreadsheet, use a shortcode like this:
[gdoc key="ABCDEFG" query="select A, B, C"]
Alternatively, you can hide columns using CSS with code such as, .col-4 { display: none; }, for example.
How do I change the default settings, like can I turn paging off? Can I change the page length? Can I change the sort order?
All of these DataTables options are accessible through shortcode attributes. The shortcode attribute is an underscore-separated version of the DataTables's CamelCase'ed option name, prefixed with datatables_. For instance, to turn off paging, you need to set the DataTables paging option to false, so you would use a shortcode like this:
[gdoc key="ABCDEFG" datatables_paging="false"]
Similarly, to change how many rows appear per page, you need to use the DataTables pageLength option, setting it to a number. Its default is 10, so if you wanted to show 15 rows per page, you would use a shortcode like this:
[gdoc key="ABCDEFG" datatables_page_length="15"]
Some DataTables options need to be given JavaScript array literals, such as in the case of the DataTables order option, which controls the initial sort order for a table. However, using square brackets ([ and ]) inside a shortcode confuses the WordPress parser, so these characters must be URL-escaped (into %5B and %5D, respectively). Suppose you want your table to be sorted by the second column in descending order (instead of the first column in ascending order, which is the default). You need to supply a 2-dimensional array such as [[ 1, "desc" ]] to DataTable's order option (column counting begins at 0). In a shortcode, with the square brackets URL-escaped, this becomes:
[gdoc key="ABCDEFG" datatables_order='%5B%5B 2, "desc" %5D%5D']
Note that when a JSON string literal is supplied in a shortcode attribute ("desc"), it must be double-quoted, so the shortcode attribute value itself must be single-quoted.
Alternatively, if you're able to add JavaScript to your theme, you can do all of these things, and more because any and all DataTables-enhanced tables can be modified by using the DataTables API.
For instance, to disable paging, add a JavaScript to your theme that looks like this:
jQuery(window).load(function () {
jQuery('#igsv-MY_TABLE_KEY').dataTable().api().page.len(-1).draw();
});
Or, to have your DataTables-enhanced table automatically sort itself by the second column in descending order:
jQuery(window).load(function () {
jQuery('#igsv-MY_TABLE_KEY').dataTable().api().order([1, 'desc']).draw();
});
(Replace MY_TABLE_KEY with the Google Spreadsheet document ID of your spreadsheet, of course.)
Please refer to the DataTables API reference manual for more information about customizing DataTables-enhanced tables.
Another option for sorting your table, for example, is to use the query attribute and pass along an appropriate Google Charts API Query Language query that includes an order by clause. In this case, however, you may want to disable DataTables's client-side sorting, as the data will be sorted in the HTML source.
How do I customize my chart?
Using specific shortcode attributes, you can choose from a huge number of configurable options to customize the look and feel of your chart. The specific shortcode attributes available to you depend on the type of chart you chose. Refer to the Google Chart API documentation to learn which configuration options are available for which type of charts.
Each configuration option is accessible through a shortcode of a similar name. For instance, the colors configuration option is accessible to you through the chart_colors attribute. It accepts a list of colors, which you supply to the shortcode in a similar way as you might provide a class value:
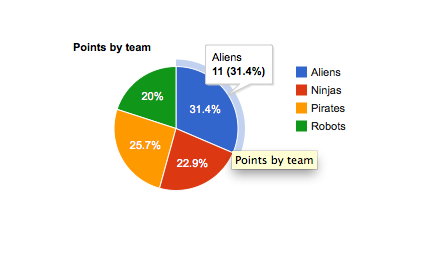
[godc key="ABCDEFG" chart="Pie" chart_colors="red green"]
To create a 3D chart, specify chart_dimensions="3".
With a few exceptions, the name of a shortcode attribute is always an underscore-separated translation of the camelCase name of the option in the Google Chart API. For instance, to disable chart interactivity by setting the chart's enableInteractivity option to false, use a shortcode like:
[gdoc key="ABCDEFG" chart="Pie" chart_enable_interactivity="false"]
Some configuration options call for an Object value. For these, the shortcode attribute value should be a JSON object. For instance, to use the different properties of the backgroundColor option:
[gdoc key="ABCDEFG" chart="Pie" chart_background_color='{"fill":"yellow","stroke":"red","strokeWidth":5}']
Note that when a JSON object is used as a value, the shortcode attribute's value must be single-quoted.
See Other Notes for a complete list of attribute for configurable chart options.
Why am I getting errors when I try to use the query attribute?
If your query includes an angle bracket, such as a less than (<) or a greater than (>) sign, WordPress will assume you are trying to write HTML and strip everything except the first word of your query, resulting in a syntax error. Instead, use the URL-encoded equivalents of these characters (%3C and %3E, for < and >, respectively), which WordPress will pass to the plugin unmolested and which the plugin is specifically aware of how to handle correctly.
How do I remove unneeded stylesheets or JavaScripts that this plugin adds?
Use the gdoc_enqueued_front_end_styles or gdoc_enqueued_front_end_scripts filter hooks. For instance, to prevent the plugin from enqueueing the JavaScript file for the Google Charts, use code like the following in your theme's functions.php file:
function igsv_dequeue_google_charts_script ($scripts) {
unset($scripts['igsv-gvizcharts']);
return $scripts;
}
add_filter('gdoc_enqueued_front_end_scripts', 'igsv_dequeue_google_charts_script')
See the Other Notes page for a full list of registered script and stylesheet handles this plugin uses.
更新日志:
- Maintenance: Update DataTables libraries. No backwards incompatible changes are expected.
- Enhancement: New
csv_headersshortcode attribute adds support for Google Sheet Query Language HTTP endpointheadersparameter. Usingcsv_headers=1in your shortcode may help if you find headers exported from a Google Sheet are missing.
- Compatibility: Officially support WordPress 5.x and the Block Editor. This update removes the deprecated QuickTags integration from the Classic Editor and fixes minor author-side rendering bugs on WP 5.x.
- Bugfix: Protect against "Undefined index" error when a user enters an incomplete
keyvalue.
- Bugfix: Fix incorrect spacing causing invalid HTML table row markup.
- Bugfix: Fix invalid HTML output affecting some CSS hooks.
- Feature: Add HTML IDs to table rows. Thanks, @ThaiWood. :)
- Bugfix: Compatibility with PHP 7.0 and later.
- Update DataTables libraries to current release versions.
- Minor code cleanup. (Fixes broken links in readme, code style, etc.)
- Bugfix: Remove
chart_legend_positionattribute and update the documentation. This should bechart_legendwith a JSON object attribute value.
- Enhancement: Google Charts now accept fallback content as part of the shortcode like other options.
- Bugfix: Support URL-encoded MySQL connection strings.
- Security: MySQL datasources have been hardened, but their HTML IDs have changed. If you have styles or scripts looking for specific HTML IDs, you will need to update those resources to match the newly generated ID values.
- Bugfix: Fix errors when using MySQL databse access shortcodes.
- Feature: Support Google GeoCharts using the
Geochart type ([gdoc key="ABCDEFG" chart="Geo"]). - Bugfix: Exception handling no longer fails to return a human-readable error when using SQL data sources.
- Bugfix: Fix regression during activation.
- Automatically force new-style URLs for
keyattribute values that are still using deprecated old-style document IDs. - Bugfix: Fix collision with class names in some cases. This change requires the use of PHP 5.3 or later.