Plugin Name
| 开发者 | thmufl |
|---|---|
| 更新时间 | 2017年6月15日 22:59 |
| PHP版本: | 3.0.1 及以上 |
| WordPress版本: | 4.8 |
| 版权: | GPLv2 or later |
| 版权网址: | 版权信息 |
详情介绍:
IPU-Chart will be replaced by Diagram Factory in the near future. The Diagram Factory Plugin is much easier to use because it provides a dialog-based user interface. Try it!
IPU-Chart is a Wordpress shortcode to create many different chart types inside your blog or page. It works perfectly on large computer screens as well as on tablets and smaller mobile screens. The data to display can reside directly in the document or it can be fetched from a remote service.
IPU-Chart has many options to style a chart. Add your own color palette or use the functions to generate color palettes that come with the plugin.
Features
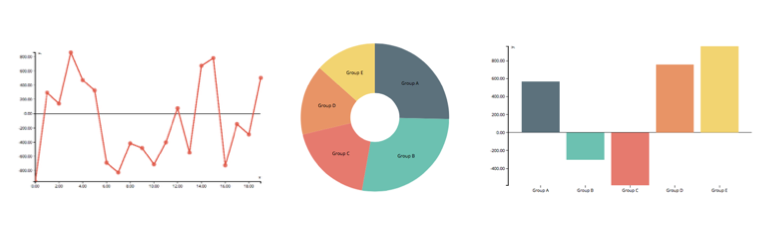
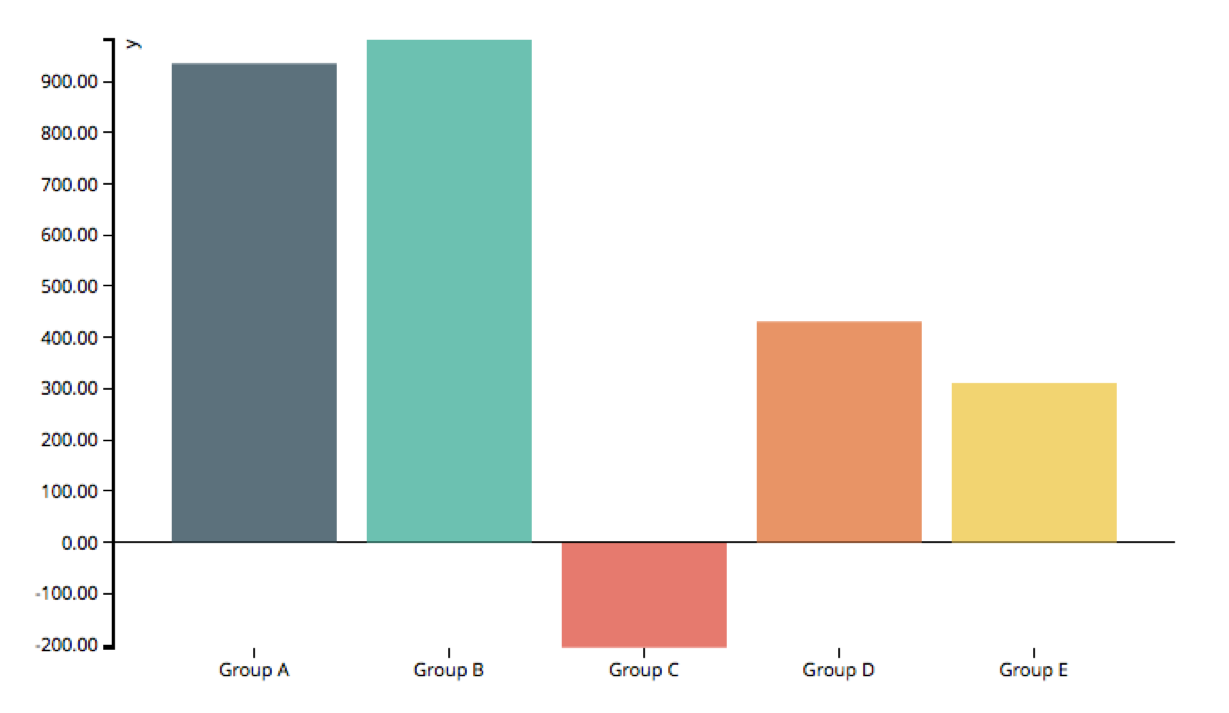
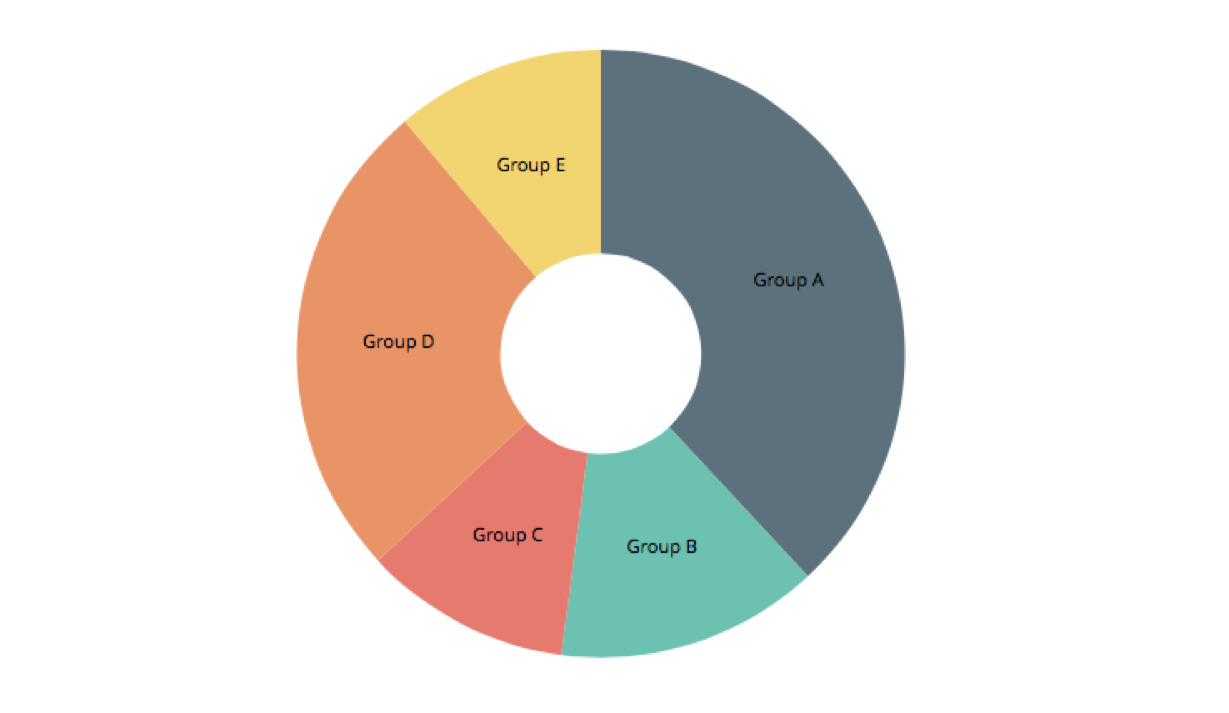
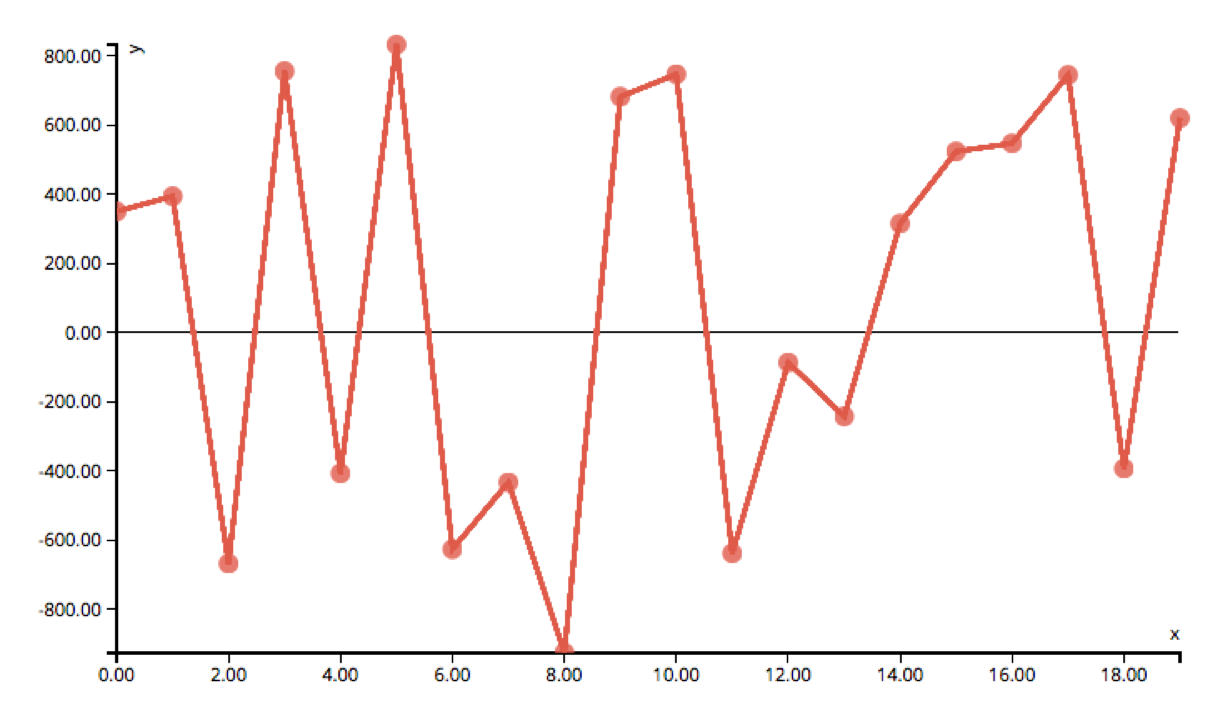
- Creates bar, line, pie, donut, scatter, bubble and world map charts
- Supports data in json, csv or tsv format (Excel, Numbers)
- Lets you enter the data directy in a blog or page
- Loads the data from a remote service (database)
- Updates the data automatically if desired
- Has many options to style a chart with css or built-in color functions
...

[ip4]{
"template": ip4.barChart(),
"parentElement": "#kcal",
"data": {
"reader": ip4.dataReader()
.data([ {"x": "Apple", "y": 55 },
{"x": "Avocado", "y": 145 },
{"x": "Banana", "y": 95 },
{"x": "Grapefruit", "y": 30 },
{"x": "Kiwi", "y": 55 } ])
},
"d3": {
"yLabel": "kilo calories (kcal)"
}
}[/ip4]
To display a line or pie chart just enter ip4.lineChart() or ip4.pieChart() as template.
Data refresh the data from an url every 20 seconds:
...

[ip4]{
"template": ip4.barChart(),
"parentElement": "#kcal",
"data": {
"reader": ip4.dataReader()
.uri("http://example.org/kcal")
.interval(20000)
},
"d3": {
"yLabel": "kilo calories (kcal)"
}
}[/ip4]
Note for existing users: The attribute-based, old interface is still included in the plugin.
Further Information
- The ip4 User Guide for detailed descriptions and examples.
- The IPU-Chart User Guide for the legacy interface.
- The Support Forum.
安装:
- Upload
ipu-chartto the/wp-content/plugins/directory - Activate the plugin through the 'Plugins' menu in WordPress
屏幕截图:
更新日志:
1.0.6
- Fixed name conflicts.
- Fixed javascript path problem.
- Maintenance release, updated d3 library.
- Minor bug fixes.
- Adapter called now with inline json data.
- Fixed error when loading json data from an url
- Bug fixes
- Bug fix
- Pie Charts with ip4 interface added
- Stacked Bar Charts with ip4 interface added (Extension)
- Bug fixes and speed enhancements
- Line charts with ip4 interface added
- Changed group/value data attributes for bar charts to x/y
- Minor bug fixes
- Missing libraries added
- ip4 template engine
- json configuration for bar charts
- automatic data updates via definable update interval
- color palettes and color functions
- Fixed tooltips in Google Chrome.
- Fixed license activation problems with multi series extension.
- Tested with WordPress 3.6
- Minor bug fixes and name changes.
- Support for negative values in horizontal bar charts added.
- Second shortcode set with prefix 'ipu-' added.
- Support for multi-series extension added.
- Support for json added.
- Support for data adapters added.
- Minor layout changes (tooltip).
- Better calculation of left margin for bar, scatter and line charts
- Update for bubble charts with 0 values in the data series
- Sor for bubble charts
- Minor update for interoperability with the editor.
- Bubble charts added
- Patch for number formats
- World Map chart type (map.world.countries) added
- number (n) as format added
- Improvements in formatting numbers
- Support for tab separated (tsv) data added
- [tsv] shortcode added
- Scatter charts added
- Shortcodes inside [csv][/csv] are processed now
- Minor bug fixes
- Bug fixes documentation
- Labels for x- and y-axis added
- Some bugs fixes
- Donut charts added
- Attribute 'interpolate' added
- Attribute 'animate' added
- Enhanced error handling when loading csv data
- Pie charts added
- Line charts added
- Vertical bar charts added
- Support for remote cvs loading added
- Attribute 'style' added
- Attribute 'img' added
- Changes in format definitions
- Initial version with horizontal bar charts