Kint Debugger
| 开发者 |
misternifty
chriswallace cdillon27 |
|---|---|
| 更新时间 | 2019年1月18日 23:20 |
| PHP版本: | 2.5 及以上 |
| WordPress版本: | 5.0 |
| 版权: | GPLv2 or later |
| 版权网址: | 版权信息 |
详情介绍:
This plugin is up for adoption.Kint Debugger is a simple wrapper for Kint, a debugging tool to output information about variables and traces in a styled, collapsible format that makes understanding deep arrays and objects easier. No more adding PRE tags before print_r or var_dump! Kint Debugger works well with the Debug Bar plugin by creating its own panel to display your debug results. Basic Usage
<?php d( $var ); ?>
Examples:
<?php global $post; $term_list = wp_get_post_terms( $post->ID, 'my_taxonomy', array( 'fields' => 'all' ) ); d( $term_list ); ?>
Kint Debugger also provides some helper functions for dumping variables that are frequently needed.
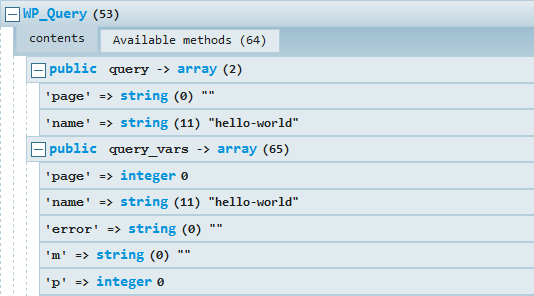
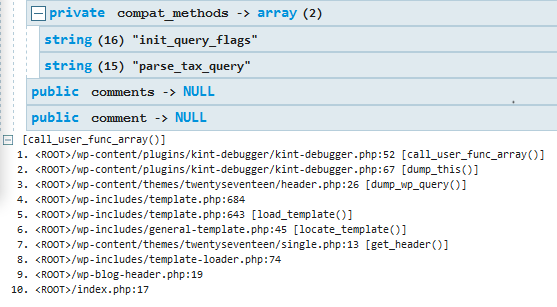
dump_wp_query()dump_wp()dump_post()dump_this( $var, $inline = false )- explained below
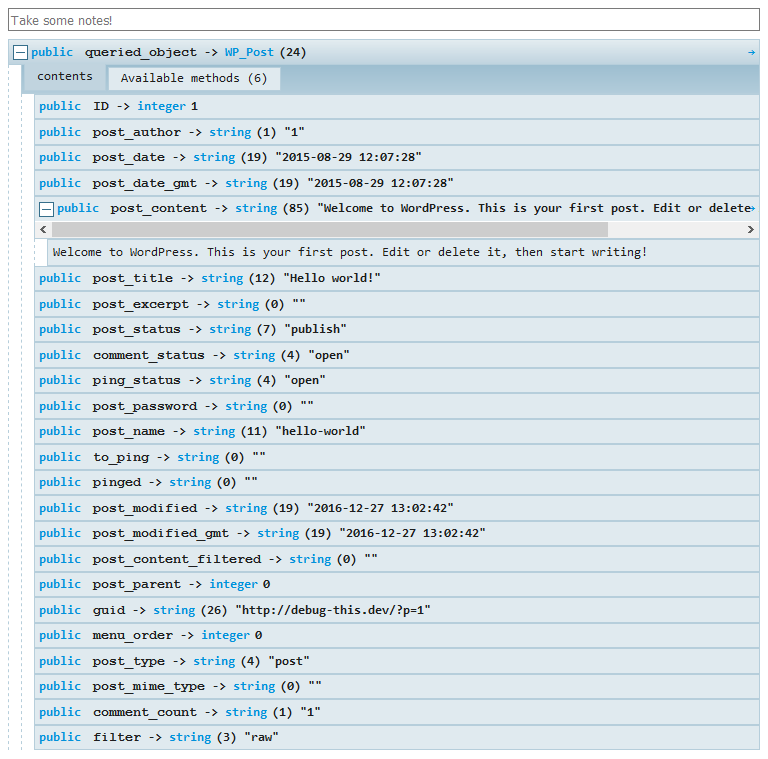
<?php dump_post(); ?>
<?php add_action( 'wp_head', 'dump_post' ); ?>
Obviously, if this plugin is not active, calls to the helper functions will cause errors.
Your Own Functions
If you are dumping the same information in different places, consider writing your own helper functions in your theme's functions file or an mu-plugin. For example:
<?php function my_dump_terms() { global $post; $term_list = wp_get_post_terms( $post->ID, 'my_taxonomy', array( 'fields' => 'all' ) ); d( $term_list ); } ?>
Then at strategic points in your theme or plugin:
<?php my_dump_terms(); ?>
With Debug Bar
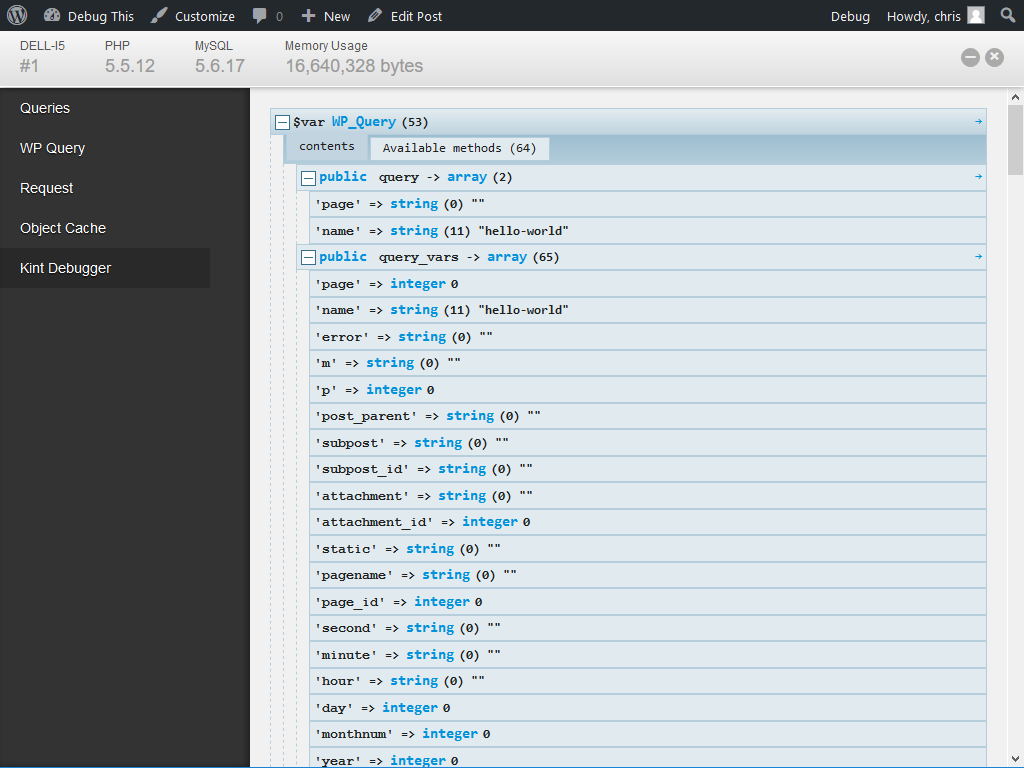
By default, when Debug Bar is installed and active, Kint Debugger will send d() output to its Debug Bar panel.
To print debug output inline instead, as if Debug Bar was not active, declare the constant KINT_TO_DEBUG_BAR in your config.php (or really anywhere before your d() call):
define( 'KINT_TO_DEBUG_BAR', false );
Or to print a specific dump inline, use a helper function with the parameter $inline. The generic dump_this() takes $inline as the second parameter.
Examples:
<?php dump_post( true ); ?>
<?php global $post; $term_list = wp_get_post_terms( $post->ID, 'my_taxonomy', array( 'fields' => 'all' ) ); dump_this( $term_list , true ); ?>
Kint Debugger overrides Kint's d() function in order to buffer its output for Debug Bar. If you already have a modified d() function, you need to prevent the override in one of two ways.
- Move your modified d() function to an mu-plugin. Kint Debugger checks if the function exists before declaring it so putting yours in an mu-plugin is the only way to ensure it exists first.
- Declare KINT_TO_DEBUG_BAR as described above.
kint_debug_display filter. For example, to prevent non-admins from seeing the debug output:
add_filter( 'kint_debug_display', function( $allow ) { return is_super_admin(); } );
Try these plugins too
- What The File - Identify template files without fail.
- Debug This - Peek under the hood with sixty debugging reports just one click away.
安装:
- Go to Plugins > Add New.
- Search for "kint debugger".
- Click "Install Now".
- Download the zip file.
- Upload the zip file via Plugins > Add New > Upload.
屏幕截图:
常见问题:
I have called a debug function, but I can't find the output.
If Debug Bar is installed and active, your debug results will be displayed on the "Kint Debugger" panel. Otherwise, your debug results will be inserted into the current page's HTML.
Can I change the style of the output?
Currently, the Kint library includes some themes and a config file. Feel free to configure as you see fit. In order to leave the Kint library intact, the plugin does not provide additional configuration. Fortunately, the developers of Kint are working on version 2 which will make it easier to configure and extend it.
更新日志:
1.2
- Fix bug when adding Debug Bar panel.
- Fix bug when Query Monitor is installed but Debug Bar is not.
- Fix integration with Debug Bar
- Add new helper function
dump_this() - Add
KINT_TO_DEBUG_BARcheck - Add
kint_debug_displayfilter
- Upgrade Kint library
- Move Kint to vendor folder
- Add Debug Bar support
- Add Kint 0.3.2 and create dump_wp_query(), dump_wp(), and dump_post() functions


