
KloudStack Observability for Azure
| 开发者 | kloudstack |
|---|---|
| 更新时间 | 2026年9月27日 16:03 |
| PHP版本: | 7.4 及以上 |
| WordPress版本: | 7.1 |
| 版权: | GPLv2 or later |
| 版权网址: | 版权信息 |
详情介绍:
KloudStack Observability for Azure connects a WordPress site to Azure Application Insights, so
you can see request performance, errors and browser telemetry in Azure Monitor alongside the
rest of your Azure estate.
The plugin is built specifically for WordPress hosted on Azure. It reads its configuration from
App Service application settings automatically, names telemetry using the Azure site, slot and
region so one Application Insights resource can serve many sites, and produces a telemetry
schema designed to work with Azure Monitor workbooks.
Features
- Server-side request telemetry with normalised route names
- Uncaught exception and fatal error telemetry
- Browser telemetry via the official Application Insights JavaScript SDK
- Correlation between browser and server telemetry using W3C trace context
- Automatic Azure environment detection — App Service, Container Apps, AKS and Virtual Machines
- Cloud role naming from the Azure site and deployment slot
- Configurable sampling to control Azure ingestion cost
- Privacy controls: IP anonymisation, query-string redaction, consent gating
- Built-in diagnostics self-test and WordPress Site Health integration
安装:
- Install and activate the plugin.
- If your site runs on Azure App Service, add
APPLICATIONINSIGHTS_CONNECTION_STRINGto your application settings. The plugin will detect it automatically. - Otherwise, go to Tools > KloudStack Observability and paste your Application Insights connection string.
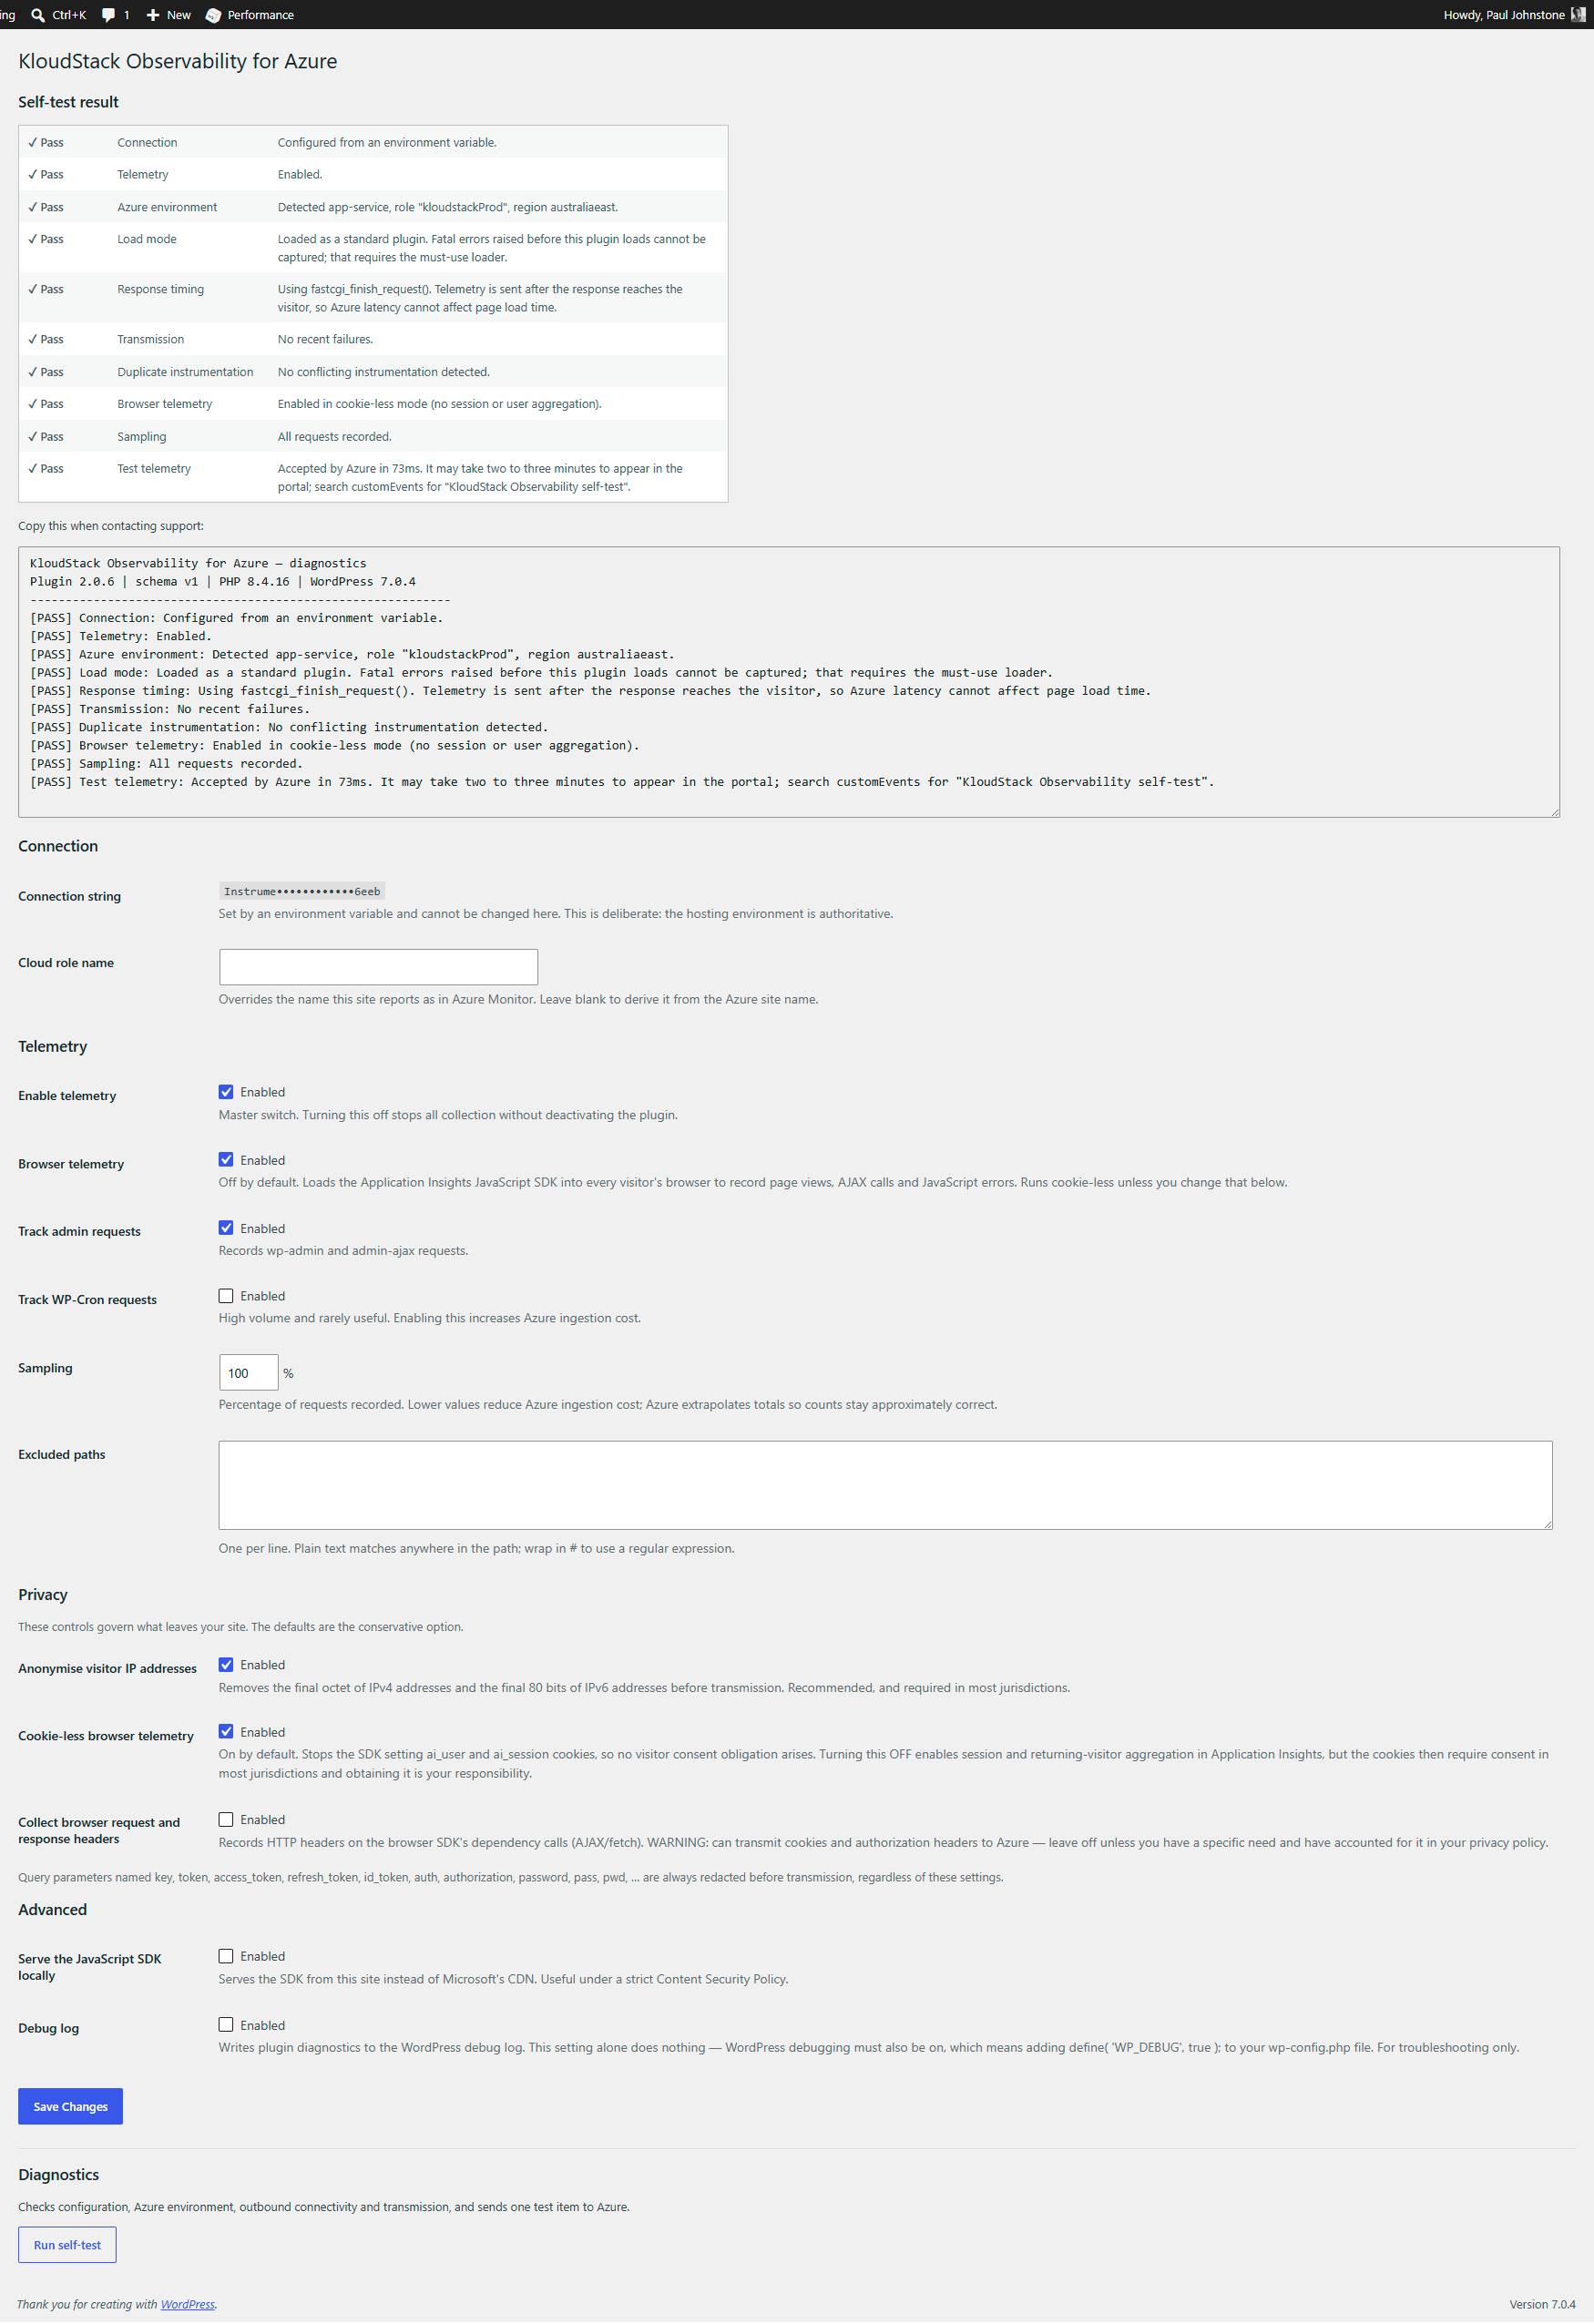
- Run the built-in self-test to confirm telemetry is reaching Azure.
屏幕截图:
常见问题:
Do I need an Azure subscription?
Yes. The plugin sends telemetry to an Application Insights resource in your own Azure subscription. Azure charges for telemetry ingestion and retention apply under your Azure agreement.
Does this slow down my site?
No. Telemetry is transmitted after the response has been released to the visitor, so Azure latency does not affect page load time.
Why do my browser page views outnumber my server requests?
If you use full-page caching, cached responses are served without running PHP, so no server-side request telemetry is produced — while the browser SDK still fires. This is expected.
Can I use one Application Insights resource for several sites?
Yes. Each site reports a distinct cloud role name, derived from the Azure site name or set manually in settings.
更新日志:
2.0.10
- Telemetry can no longer stay suspended indefinitely. When sends to Azure are slow or failing, the plugin pauses them for five minutes so they cannot tie up your PHP workers. Ending that pause relied on WordPress expiring a stored value, and on one site the value outlived its expiry record -- so WordPress kept it for good, and telemetry stayed off for two days while the self-test kept promising it would resume "within five minutes". The pause now carries its own end time, and a pause already stuck this way clears itself when you install this update.
- The self-test now says what time transmission resumes, rather than "within five minutes".
- A Reset transmission button appears under Diagnostics while transmission is paused, so you can resume it straight away.
- Uninstalling now removes every temporary value the plugin stores. Four were being left behind.
- The self-test no longer says everything is fine when Azure is throwing your telemetry away. If the connection string names an Application Insights resource that no longer exists, the endpoint answers and refuses each item -- and that refusal was being recorded as a successful send, so "Transmission" reported no recent failures while nothing whatsoever arrived. Refused items are now counted and reported with the HTTP status Azure returned.
- A refused item is no longer described as an unreachable endpoint. The test telemetry failure said "Rejected or unreachable" and told you to check outbound HTTPS access, which cannot be the cause when Azure answered. It now says which it was, and a refusal points you at the connection string instead of your firewall.
- Settings no longer appear to reset when the plugin updates. Version 2.0.1 made all telemetry opt-in, as WordPress.org requires. Settings are stored one option at a time, so a site that had never pressed Save had nothing stored and was running on the defaults in the code -- and that change turned telemetry off on every such site without saying so. Defaults are now written to the database, so a future change of default cannot reach backwards, and where an update finds telemetry off that nobody chose to turn off, a dismissible notice says so. Telemetry is never switched back on for you.
- Settings that default to on can be switched off again. An unchecked box saves as an empty value, which was being read back as the default -- so "Cookie-less browser telemetry", "Anonymise visitor IP addresses" and "Track admin requests" quietly refused to turn off and redrew themselves ticked. Cookie-less was the costly one: turning it off is how you get session and returning-visitor figures in Application Insights, and that was unreachable.
- Browser telemetry no longer reports every visitor as one operation. The server's trace id was written into the page, so any page cache stored it and served it to everyone -- one request's id on thousands of unrelated page views. On a cached page PHP never runs, so there is no server request to correlate with; the id is now sent only where PHP genuinely handled the request, and the browser SDK generates its own everywhere else. This also restores correct sampling, which Application Insights decides per operation id.
- The Application Insights SDK no longer registers an unload handler that Chrome and Edge refuse to run, which logged a console warning on every page view. Nothing is lost -- the SDK already uses pagehide and beforeunload -- and pages become eligible for the browser's back/forward cache.
- The Debug log setting now explains what it actually takes to get output. Turning it on does nothing by itself: WP_DEBUG and WP_DEBUG_LOG both have to be enabled in wp-config.php, and WP_DEBUG_DISPLAY should be turned off so errors are written to the log rather than printed on the page where visitors would see them. The description now names those three lines, says entries are prefixed [kloudstack-obs] and land in wp-content/debug.log, and notes that the log is never rotated — so it should be turned off again once troubleshooting is finished.
- The Debug log setting now says plainly that it does nothing on its own, and names the define( 'WP_DEBUG', true ); line that has to be added to wp-config.php for it to take effect.
- The plugin no longer writes a log file of its own. Debug output is handed to WordPress via error_log(), so WP_DEBUG_LOG decides where it lands. The setting itself is unchanged.
- The debug log filename now carries a per-site random suffix. The .htaccess written beside it denies direct access on Apache, but nginx ignores .htaccess entirely, so on those servers a fixed, identical-everywhere filename was guessable and the log fetchable. Both guards are kept.
- Hosting platform management API calls are excluded from request telemetry, alongside the health probe. These are the host calling the site rather than the site's own traffic, and being slow by nature they dominated the slowest-routes report.
- Health probe exclusion now also matches sites using plain permalinks, where the same route is reached as /?rest_route=/custom/v1/healthcheck rather than /wp-json/custom/v1/healthcheck.
- Telemetry is now OFF by default and must be enabled by the site owner. Nothing is transmitted until you turn it on, in line with WordPress.org guidelines 7 and 9.
- The settings screen now states plainly when telemetry is off and nothing is being sent.
- The debug log is written to a protected
kloudstack-azure-observabilityfolder inside the uploads directory, resolved with wp_upload_dir(), instead of the uploads root. - The browser SDK snippet is registered through wp_add_inline_script() rather than emitted as a raw script tag.
- Hosting platform health probes are excluded from request telemetry. On a low-traffic site these could account for over 99% of recorded requests, hiding the site's real traffic and adding needless ingestion cost.
- Initial public release.