
KolorWeb Log Manager: cleaver debugging management
| 开发者 | vincent06 |
|---|---|
| 更新时间 | 2026年7月10日 21:17 |
| PHP版本: | 3.9 及以上 |
| WordPress版本: | 7.0.1 |
| 版权: | GPLv3 or later |
| 版权网址: | 版权信息 |
详情介绍:
- Admin bar widget
- Toggle debugging with a click
- Control debug.log filesize
- Smart download
- One click error filtering
- Clear log with one click
- Group and list views
- Sort entries by date
- Live auto refresh
- Realtime search
- Error color legend
- Custom errors manager
- Debugging status, size and last modified debug.log file
- Dashboard widget
- Persistent settings
安装:
- Click on "Plugins > Add New" in the sidebar
- Search for "KolorWeb Log Manager"
- Activate WP KolorWeb Log Manager from the Plugins page
- Search for "KolorWeb Log Manager"
- Download the Plugin to your local computer
- Upload the kolorweb-log-manager directory to your "/wp-content/plugins/" directory using your favorite ftp/sftp/scp program
- Activate KolorWeb Log Manager from the Plugins page
- PHP 5.4.0 or greater
- Wordpress 3.9 or above
屏幕截图:
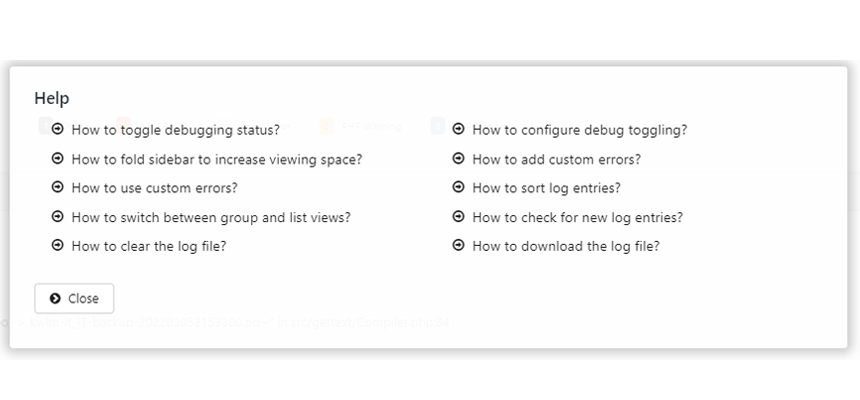
常见问题:
How to I access the plugin?
Once activated, you can access the plugin one of 3 ways:
- Click on the "Log Manager" link in the admin bar
- Click on "Tools" in the sidebar, then click on "Log Manager"
- Click on "Dashboard", then from the dashboard click the link in the widget
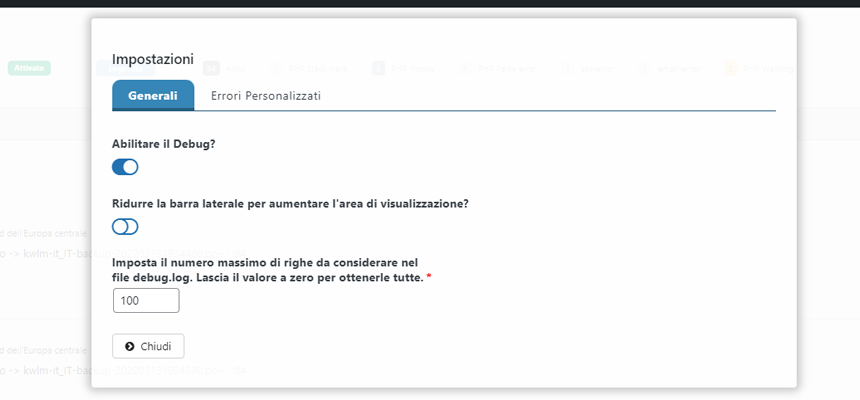
What is debug toggling?
This feature allows you to enable/disable debugging with a click. No more manually updating WP_DEBUG in wp-config.php.
How do I enable debug toggling?
When the plugin is activated, the system tries to automatically set all the DEBUG constants in your wp-config.php If toggle button does not appear in the settings means that your wp-config.php is not writable or not found in the default WordPress configuration path. If wp-config.php is not writable, you will have to manually set the values for DEBUG constants and you will not be able to use the one-click debug toggle function. The plugin will continue to work without problems, but without the magic of this feature.
STEP 1
1.1 To manually enable WordPress debugging you can paste these lines of code into the wp-config.php file define( 'WP_DEBUG', true ); define( 'WP_DEBUG_LOG', true ); define( 'WP_DEBUG_DISPLAY', false );
STEP 2
2.1 To manually disable WordPress debugging you can paste these lines of code into the wp-config.php file define( 'WP_DEBUG', false ); define( 'WP_DEBUG_LOG', false ); define( 'WP_DEBUG_DISPLAY', false ); That's it. Refresh the page in the browser and you are ready to go. Happy coding with WordPress!
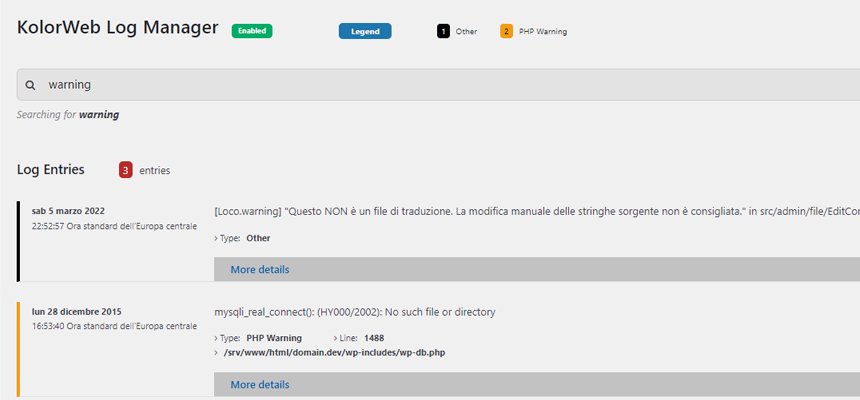
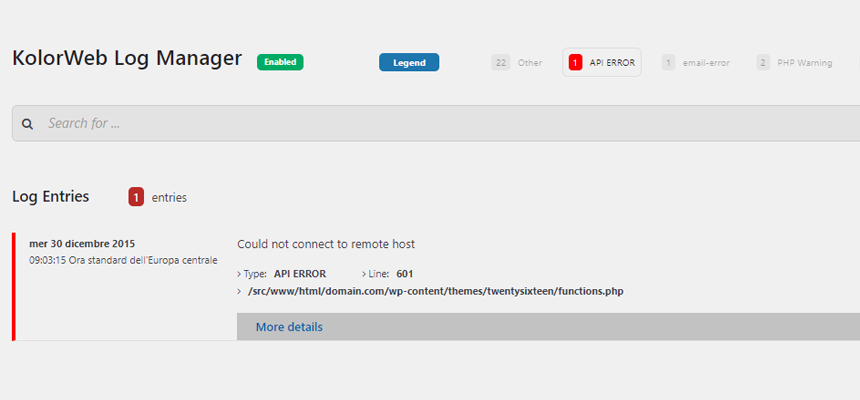
How do I filter errors?
Errors are grouped by error types. These error types are listed at the top of the viewer and color coded. You can click on any of these error to filter results by those errors. You can click on multiple errors to limit results to only those errors. Click a second time to deselect that error type. This feature works great with custom errors.
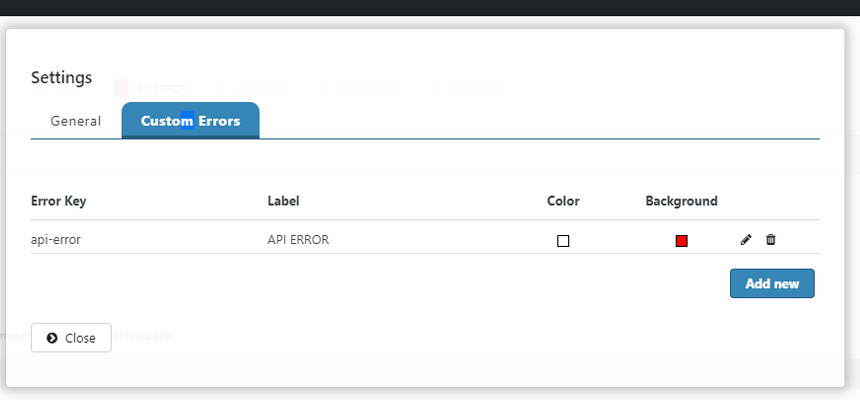
What are custom errors?
In settings, you can define custom errors. Each custom error has a key, label, and colors. The key is used in your custom error message in order to allow the log manager to define and manage your custom errors. The label and color are used to easily filter and categorize the error while browsing the log.
How do I use custom errors?
When you write an error to the log, you have to start the error message with a # and the custom error key followed by a :. Example: If you defined a custom error with a key: my-custom-error In your code: error_log( '#my-custom-error: The error message goes here' );
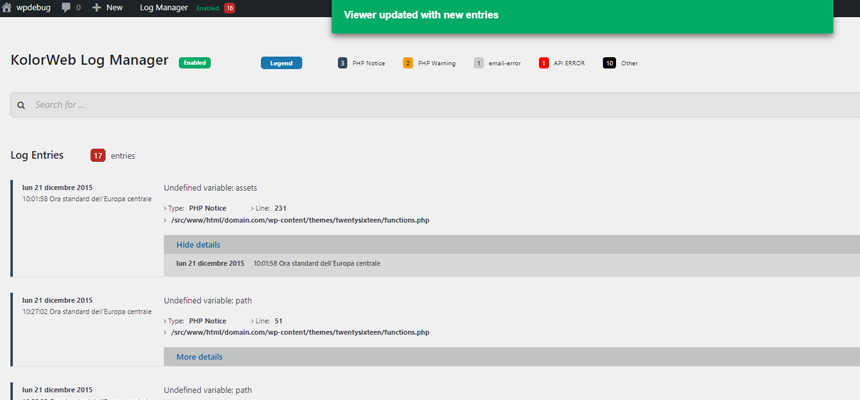
Do I need to refresh the log viewer?
No. The log manager will automatically refresh and display new entries every 15 seconds by default. This feature is implemented using AJAX to avoid reloading the entire page.
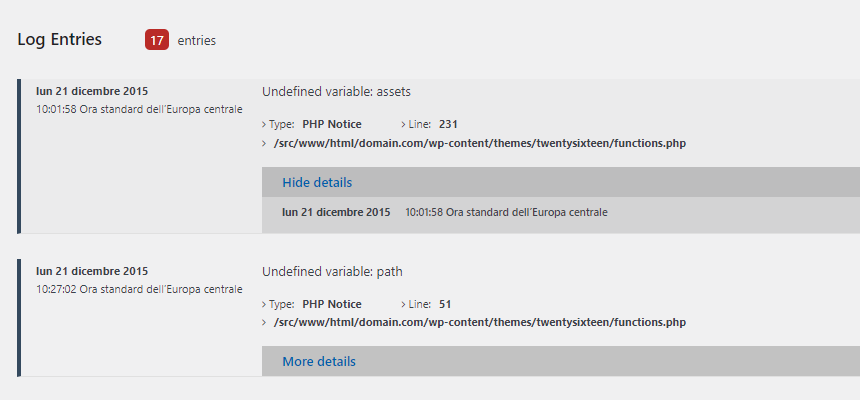
What is Group View?
In Group View similar error entries are grouped together making it much easier to see unique errors and when they happened. Click on show details to view all the dates of the events that generated the error.
What is the count in the admin bar?
The count shown in the admin bar represent the number of unique errors in the log. So if there are 10 entries for the same error, it will only count as 1.
What is sidebar folding?
By default the sidebar will be folded when the log viewer is active. This increases the viewing. To disable, or toggle this behavior, click on settings then "Fold sidebar ..."
What is the minimum length for a search query?
When using the realtime search, the search query must be at least 3 characters or more in length.
Where can I report bugs?
Report bugs and suggest ideas at: https://wordpress.org/support/plugin/kolorweb-log-manager/
更新日志:
- Enforce user capability check on AJAX actions.
- Tested Up to WordPress 6.7
- Unload unnecessary CSS and JS in Customizer Preview Mode.
- Some readme.txt adjustments
- Plugin Check (PCP) test passed.
- Dependency Update
- Fix: Load React only if not loaded by other plugins. This fixes some loading issues with plugins that load React unconditionally such as Yoast SEO.
- Dependencies Update
- Tested up WP 6.0
- Feature:
- A field has been introduced in the settings panel to set the limit on the number of alerts to be taken into account on the debug.log file. The default value set to 0 displays all lines in the file. With this feature your debug.log file will never be larger than you want.
- Fix:
- Fixed some issues with custom error management
- Fixed the error counter in the admin bar to reflect the currently enforced view. Previously it always counted errors in grouped mode, even when the view was set to list.
- Typo fix into readme.txt file
- Improvements
- Improved visibility of errors in the widget
- Feature:
- Really One click automatic enable/disable debugging status
- Hook
- Added filter kwlm_wp_config_file_path
- Feature:
- One click downloading of smart log file
- One click error filtering by clicking error legends
- Smart downloads include only the latest unique entries. Duplicates are removed to reduce filesize and make reading the file easier
- Persist selected view, sorting across login sessions
- Settings pane added for easy management of viewer settings
- Add and edit custom error types
- Ability to limit who can see WP Log Viewer
- Dashboard widget supports custom errors
- Debug simulation mode so when debug status can not be determined, user can still browse debug log if present
- Hook
- Added filter kwlm_user_authorized
- Added filter kwlm_can_download_log
- Added filter kwlm_show_dashboard_widget
- Added filter kwlm_show_adminbar_widget
- UI:
- WordPress sidebar is folded to increase viewer space
- Sidebar is sticky so actions are always present when scrolling
- Updated the header to display more error messages and to use less vertical space
- Display count for each error type
- Smarter display of error legends. Only legends with errors are displayed
- Search query is not displayed under search bar
- Increased error message area to display more horizontally which will reduce scrolling
- Made error message more readable by removing line number and file path
- Reorganized error details (type, line number and file path) to make it more space efficient