
LogIQ – Intelligent Debug Log Viewer
| 开发者 | akmelias |
|---|---|
| 更新时间 | 2026年3月20日 13:54 |
| PHP版本: | 7.4 及以上 |
| WordPress版本: | 6.8 |
| 版权: | GPLv2 or later |
| 版权网址: | 版权信息 |
详情介绍:
tail -f debug.log, squint at wall-of-text output, scroll endlessly to find the one error that matters. It's slow, it's fragile, and it pulls you out of your flow.
LogIQ fixes that.
LogIQ is an intelligent debug log viewer built for WordPress developers. It lives in your admin dashboard, parses your log file automatically, and surfaces exactly what you need — with search, filters, collapsible stack traces, and one-click editor access. No config files. No terminal. No wasted time.
What Makes LogIQ Different
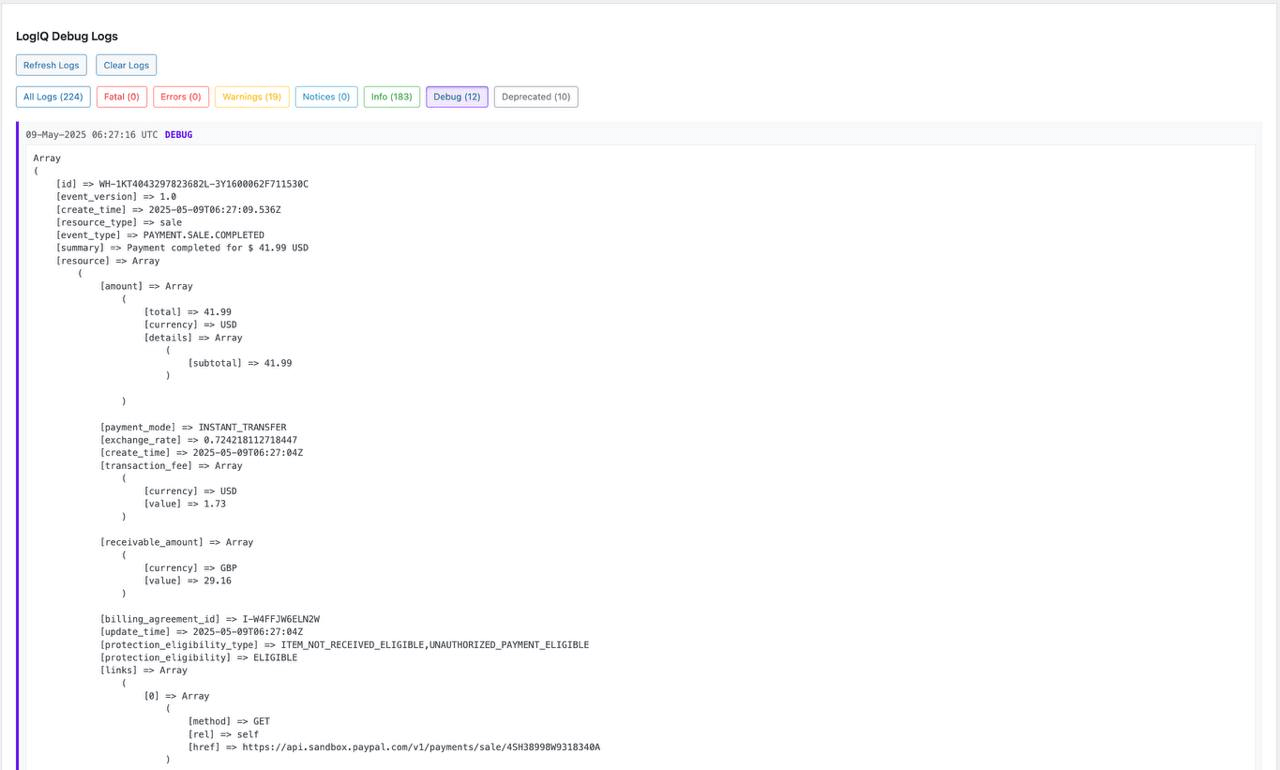
Most log plugins just dump raw text into a <textarea>. LogIQ actually understands your logs.
- Categorizes every entry by level (Fatal, Error, Warning, Notice, Deprecated, Info, Debug, DB Error)
- Detects duplicate/repeated errors and groups them with a count badge
- Collapses multi-line stack traces so your screen isn't buried in noise
- Highlights your search term inline across all matching entries
- Shows relative timestamps ("3 minutes ago") with the full timestamp on hover
- Lets you copy any entry to clipboard in one click
- Opens the exact file and line in VS Code, PhpStorm, or Sublime Text — no copy-pasting paths
error_log() output. No setup required.
Full-Text Search
Search across message content, file paths, and timestamps instantly. Matches are highlighted in-place with a count of results.
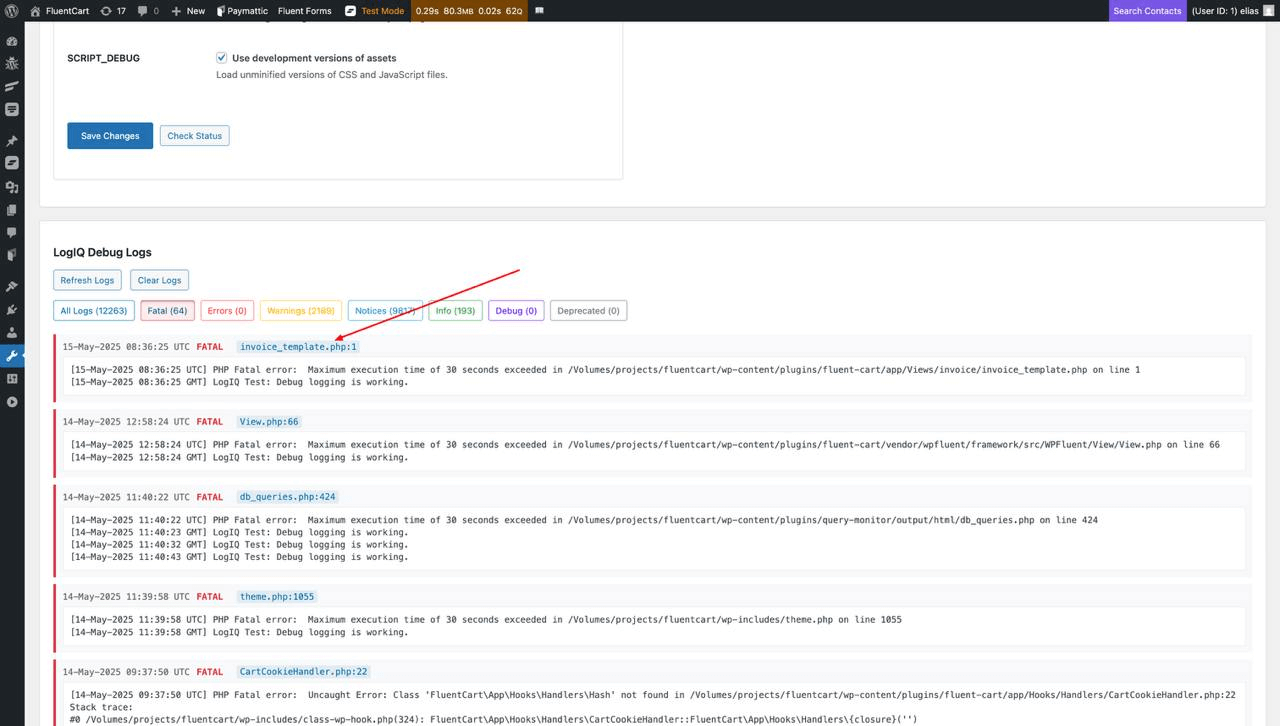
Level Filters
Filter by Fatal, Error, Warning, Notice, Deprecated, Info, Debug, or DB Error with a single click. Counts update live with each filter.
Collapsible Stack Traces
Long stack traces are collapsed by default. Expand only the ones you care about — keeping your view clean and focused.
Duplicate Detection
Consecutive identical log entries are automatically grouped into a single entry with a ×N badge. Stop scrolling past 200 copies of the same warning.
Relative Timestamps
Log timestamps show as "2 minutes ago", "1 hour ago" etc. Hover to see the full timestamp. Great for spotting when errors started.
Copy to Clipboard
One-click copy on every log entry. Paste directly into Slack, a bug report, or a support ticket.
Log Export
Download your current filtered view as a .log file or structured .json — perfect for sharing with your team or attaching to issue trackers.
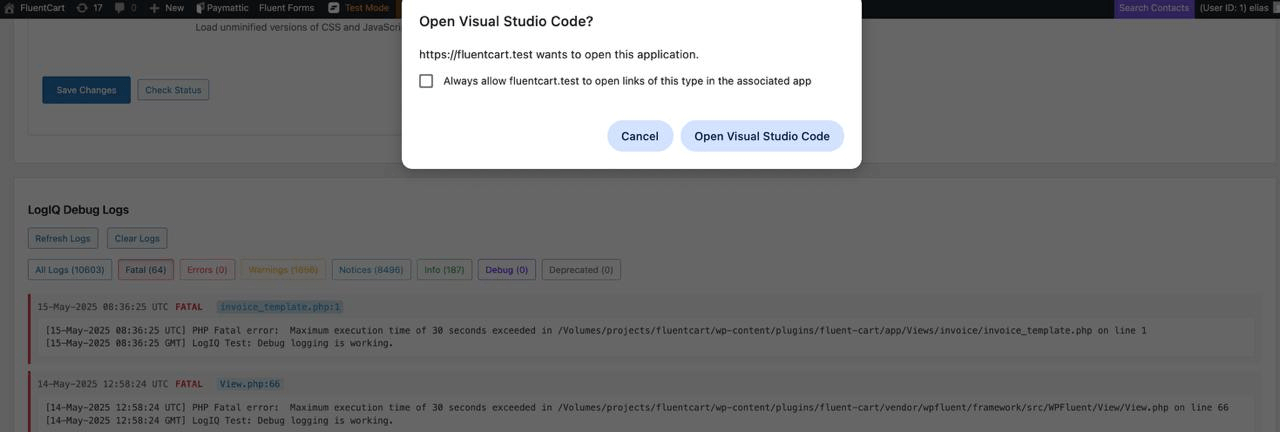
Editor Integration
Click any file path in a log entry to jump directly to that file and line in:
- Visual Studio Code
- PhpStorm
- Sublime Text
- Falls back to
file://if no supported editor is detected Auto-Refresh The log viewer refreshes automatically every 30 seconds so you can watch logs update in real time without touching the page.
manage_options capability can access LogIQ. All AJAX requests are nonce-verified. Sensitive values (passwords, API keys, auth tokens) are masked automatically before display.
Pagination
Handles large log files gracefully — reads up to 5 MB from the end of the file, paginates entries, and never loads more than needed.
Perfect For
- WordPress plugin and theme developers
- Agencies managing multiple client sites
- Developers debugging WooCommerce, REST APIs, and third-party integrations
- Anyone who's tired of
tail -f debug.log
error_log( 'Something happened' );
For arrays and objects:
error_log( print_r( $my_array, true ) );
For exceptions:
error_log( $exception->getMessage() . ' in ' . $exception->getFile() . ':' . $exception->getLine() );
安装:
- Upload the
log-iqfolder to/wp-content/plugins/ - Activate the plugin through Plugins > Installed Plugins
- Go to Tools > LogIQ Debug
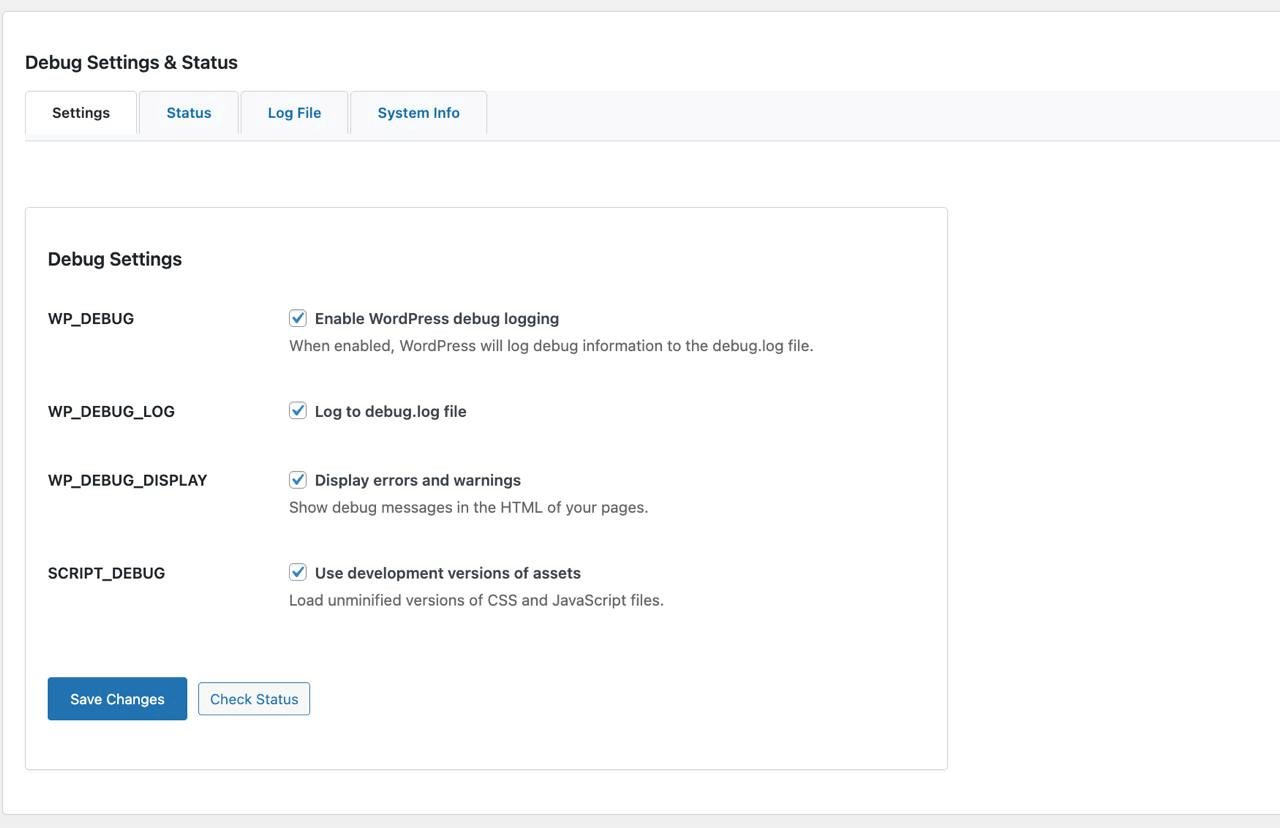
- Enable WP_DEBUG and WP_DEBUG_LOG in the settings panel and save
- Your logs will start appearing immediately
/wp-content/uploads/logiq-debug.log. This directory is outside the web root in most setups — but for extra security, you can add the following to your .htaccess:
<Files "logiq-debug.log"> Order Allow,Deny Deny from all </Files>屏幕截图:
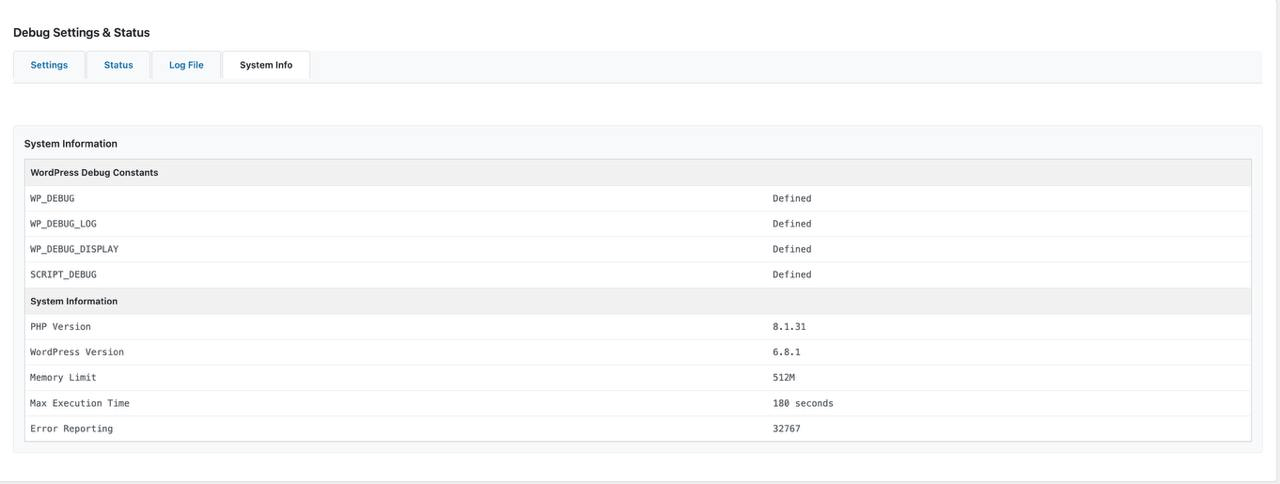
常见问题:
Does LogIQ require WP_DEBUG to be set in wp-config.php?
No. LogIQ manages its own debug settings via the WordPress options table. You don't need to touch wp-config.php. Enable settings from the LogIQ settings panel inside the admin.
Where is the log file stored?
LogIQ stores its log file at /wp-content/uploads/logiq-debug.log. This is separate from the standard WordPress debug.log file.
Will LogIQ slow down my site?
No. LogIQ only loads its assets on its own admin page. It adds zero overhead to the frontend or any other admin page.
Which editors are supported for file links?
Visual Studio Code, PhpStorm, and Sublime Text. LogIQ auto-detects which editor is installed on your server. If none are found, links use the file:// protocol.
Can I use LogIQ on a live production site?
LogIQ is designed for development and staging environments. Debug logging on production can expose sensitive information in log output. Use with caution on live sites.
Is LogIQ compatible with multisite?
LogIQ is currently designed for single-site installs. Multisite support is planned for a future release.
How does the duplicate detection work?
LogIQ groups consecutive identical log entries (same level + same message) into a single entry with a ×N count badge. This keeps your view readable when a loop or repeated process logs the same error many times.
更新日志:
- Full-text search with inline highlighted matches and result count
- Collapsible stack traces — long entries collapse by default, expand on demand
- Log export — download current filtered view as
.logor.json - Copy-to-clipboard button on every log entry
- Duplicate / repeated entry detection with
×Ncount badge - Relative timestamps ("3 minutes ago") with full timestamp on hover Bug Fixes
- Fixed pagination conflict with WordPress native admin list table pagination
- Fixed plugin assets loading on every admin page instead of only the LogIQ page
- Fixed PHP warning from
realpath()returning false on non-existent directories - Fixed potential memory exhaustion on large log files — now reads at most 5 MB from end of file
- Fixed
preg_splitreturning false on malformed log files - Fixed initial log file header text breaking the timestamp parser
- Fixed
sanitize_log_levelnot recognizingnoticeanddberrorlevels - Fixed
logiq_write_logfailing silently when the file was not writable - Removed dead
wpdb_queryhook that doesn't exist in WordPress core - Removed empty
logiq_apply_debug_settingsfunction called on every page load
- Added LogIQ shortcut to the WordPress admin bar
- Removed unnecessary internal logging
- Added Database error log detection and filtering
- Made LogIQ independent of wp-config.php constants
- General bug fixes and stability improvements
- Initial release
- Real-time log viewing with auto-refresh
- Smart log parsing and level categorization
- Level filter tabs (Fatal, Error, Warning, Notice, Deprecated, Info, Debug)
- Editor integration with clickable file links (VS Code, PhpStorm, Sublime Text)
- Sensitive data masking (passwords, API keys, auth tokens)