
Lumiblog Debug Log Inspector
| 开发者 | lumiblog |
|---|---|
| 更新时间 | 2026年5月9日 03:57 |
| 捐献地址: | 去捐款 |
| PHP版本: | 7.0 及以上 |
| WordPress版本: | 7.0 |
| 版权: | GPLv2 or later |
| 版权网址: | 版权信息 |
详情介绍:
- Universal Plugin Monitoring: Add any WordPress plugin to monitor through a simple settings page
- No Code Editing: Add/edit/delete monitored plugins through the WordPress admin interface
- Real-time Monitoring: Automatically scans your debug.log file for errors
- Visual Status Indicators: Color-coded admin bar display (Green = OK, Red = Errors Found, Gray = Debug Logging Disabled)
- Auto-Detection: Option to only monitor plugins that are currently active
- Plugin-Specific Tracking: Individual status for each monitored plugin
- Last Error Display: Shows the most recent error message for quick diagnosis
- Duplicate Prevention: Smart validation prevents adding the same plugin twice
- Enable/Disable Plugins: Toggle monitoring for specific plugins without deleting them
- Lightweight: Minimal performance impact with efficient log reading
- Well-Organized Code: Modular file structure for easy maintenance and customization
- QA Teams testing multiple plugins
- Plugin Developers debugging their own plugins
- WordPress Developers monitoring client sites
- Agency Teams managing multiple WordPress installations
- Anyone who wants to keep track of plugin errors
- Install and activate the plugin
- Go to Settings > Log Inspector
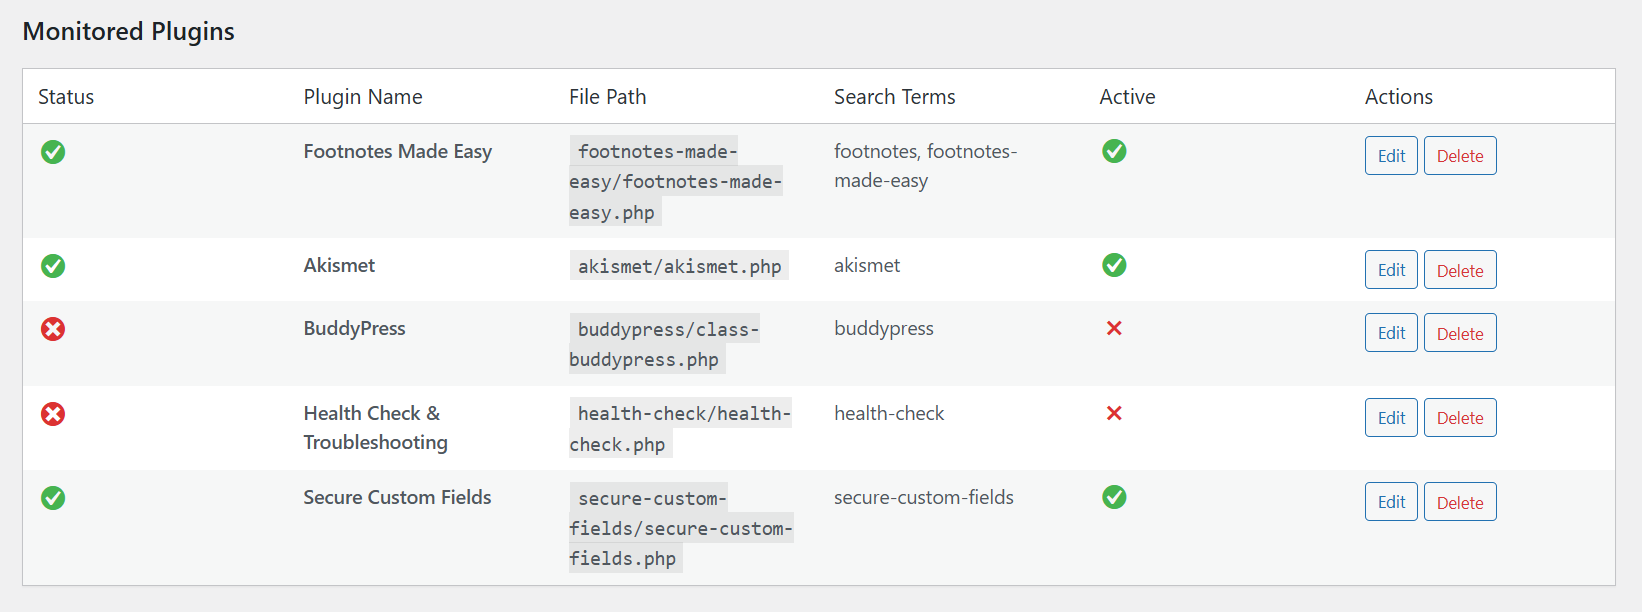
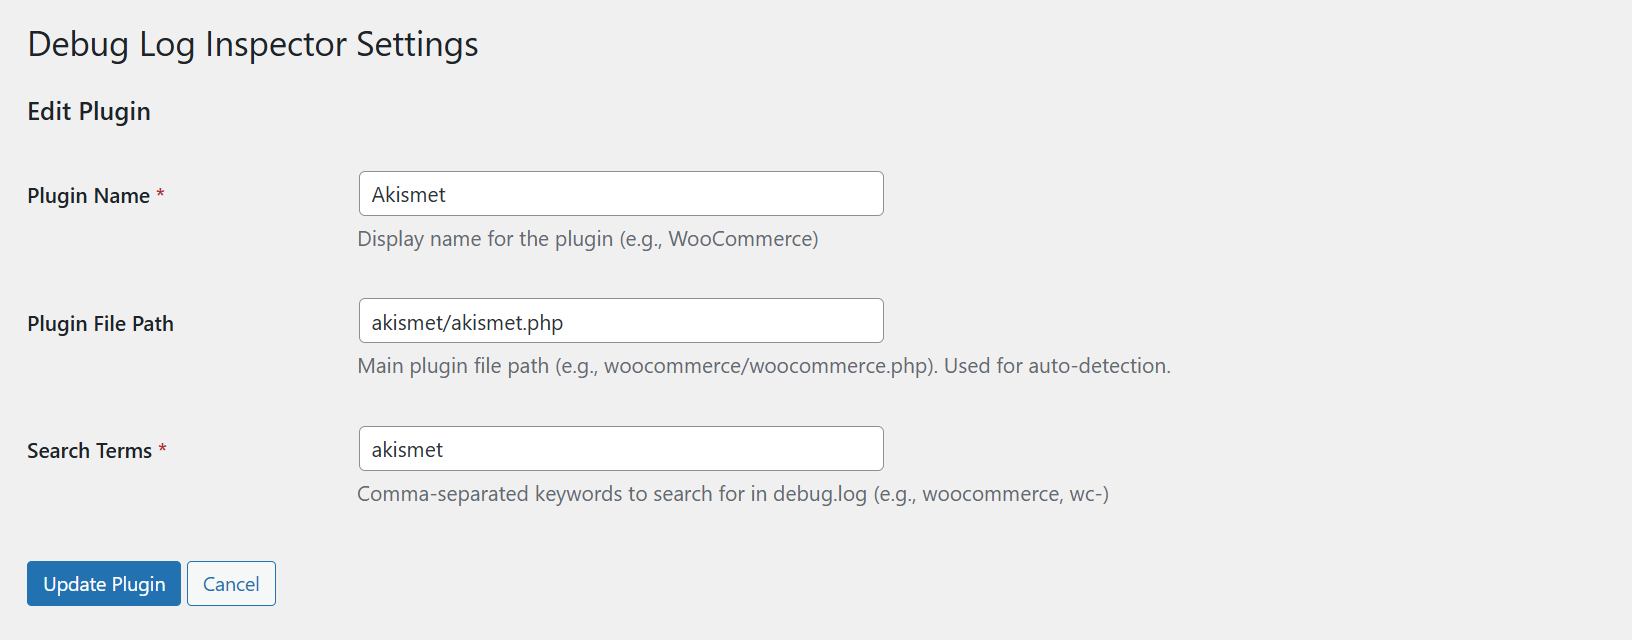
- Add any plugin you want to monitor by providing:
- Plugin Name (e.g., "WooCommerce")
- Plugin File Path (e.g., "woocommerce/woocommerce.php")
- Search Terms (e.g., "woocommerce, wc-")
- Check the admin bar for real-time error status
wp-config.php file:
define( 'WP_DEBUG', true ); define( 'WP_DEBUG_LOG', true );
安装:
- Log in to your WordPress admin panel
- Navigate to Plugins > Add New
- Search for "Lumiblog Debug Log Inspector"
- Click "Install Now" and then "Activate"
- Upload the
debug-log-inspectorfolder to the/wp-content/plugins/directory - Activate the plugin through the 'Plugins' menu in WordPress
- Go to Settings > Log Inspector to configure
- Ensure WP_DEBUG_LOG is enabled in your
wp-config.phpfile - Navigate to Settings > Log Inspector
- Add plugins you want to monitor
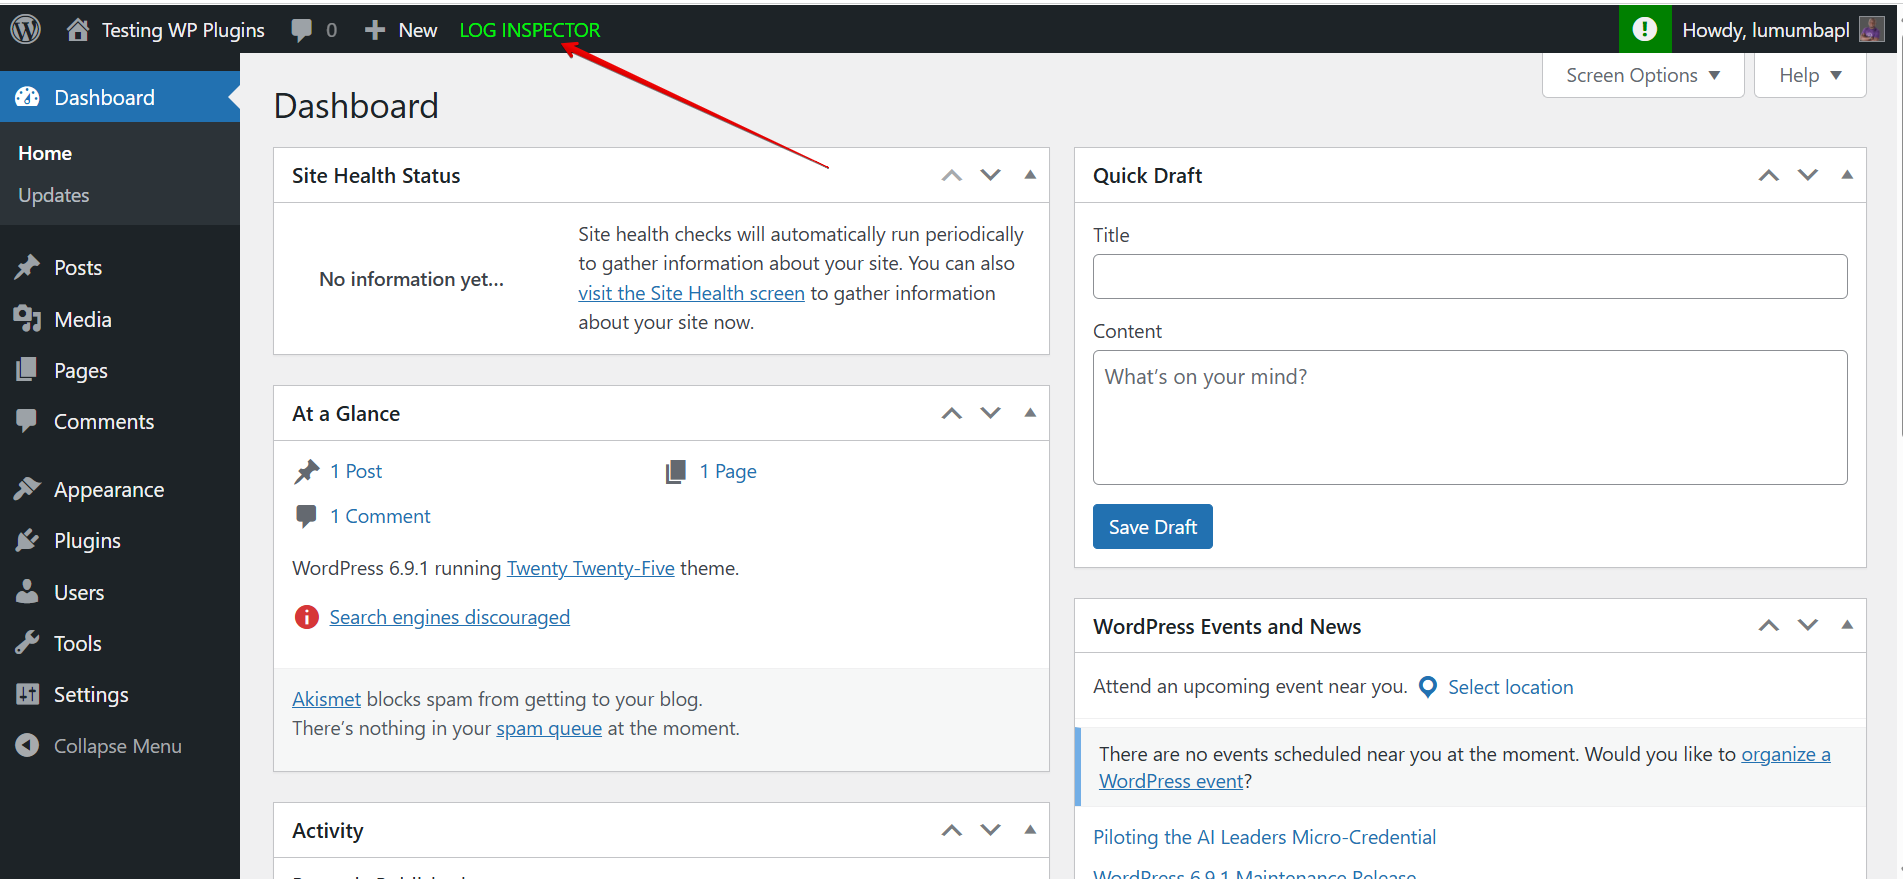
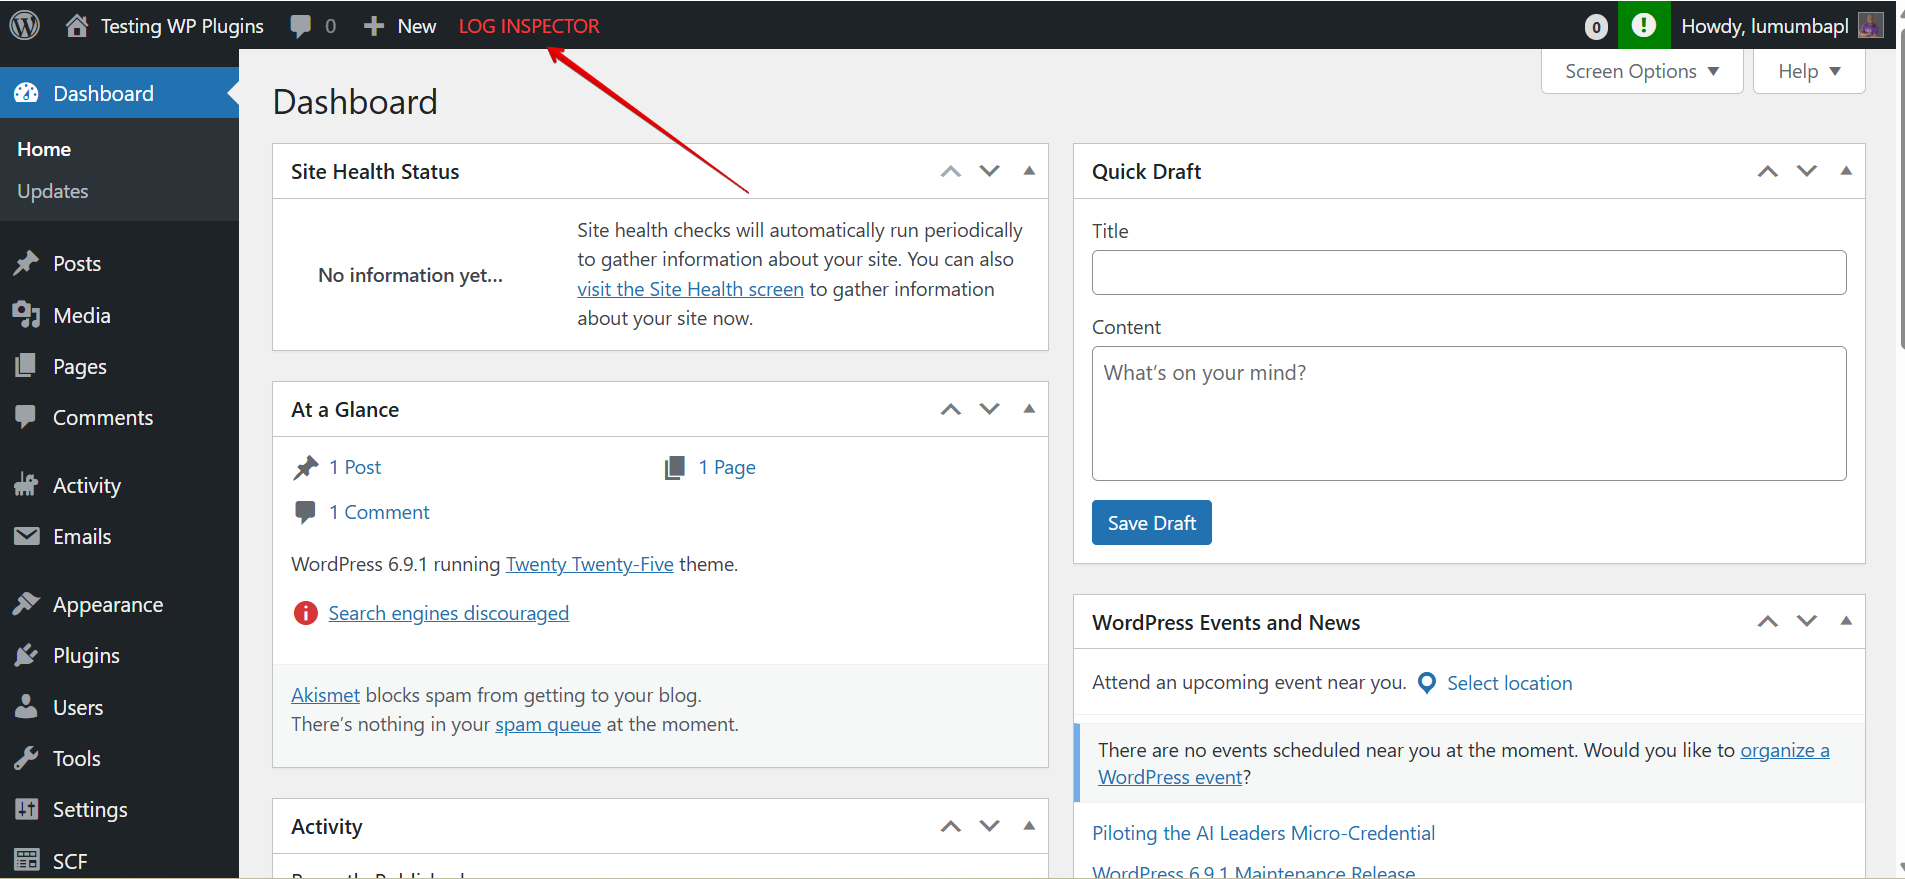
- Look for "LOG INSPECTOR" in your WordPress admin bar
屏幕截图:
常见问题:
How do I enable debug logging?
Add these lines to your wp-config.php file (before the "That's all, stop editing!" line):
define( 'WP_DEBUG', true ); define( 'WP_DEBUG_LOG', true );
What do the colors in the admin bar mean?
- Green: All monitored plugins are error-free
- Red: At least one plugin has errors in the debug log
- Gray: Debug logging is not enabled
Can I monitor any WordPress plugin?
Yes! You can add any WordPress plugin to monitor. Just provide the plugin name, file path, and search terms through the settings page.
What are "Search Terms"?
Search terms are keywords that the plugin looks for in your debug.log file. For example, if you're monitoring WooCommerce, you might use "woocommerce, wc-" as search terms. These should be unique identifiers that appear in error messages from that plugin.
How do I find the plugin file path?
The plugin file path is usually in the format: folder-name/main-file.php
For example:
- WooCommerce:
woocommerce/woocommerce.php - Contact Form 7:
contact-form-7/wp-contact-form-7.php - Yoast SEO:
wordpress-seo/wp-seo.phpYou can find this in your WordPress admin under Plugins > Installed Plugins (it's shown below each plugin name).
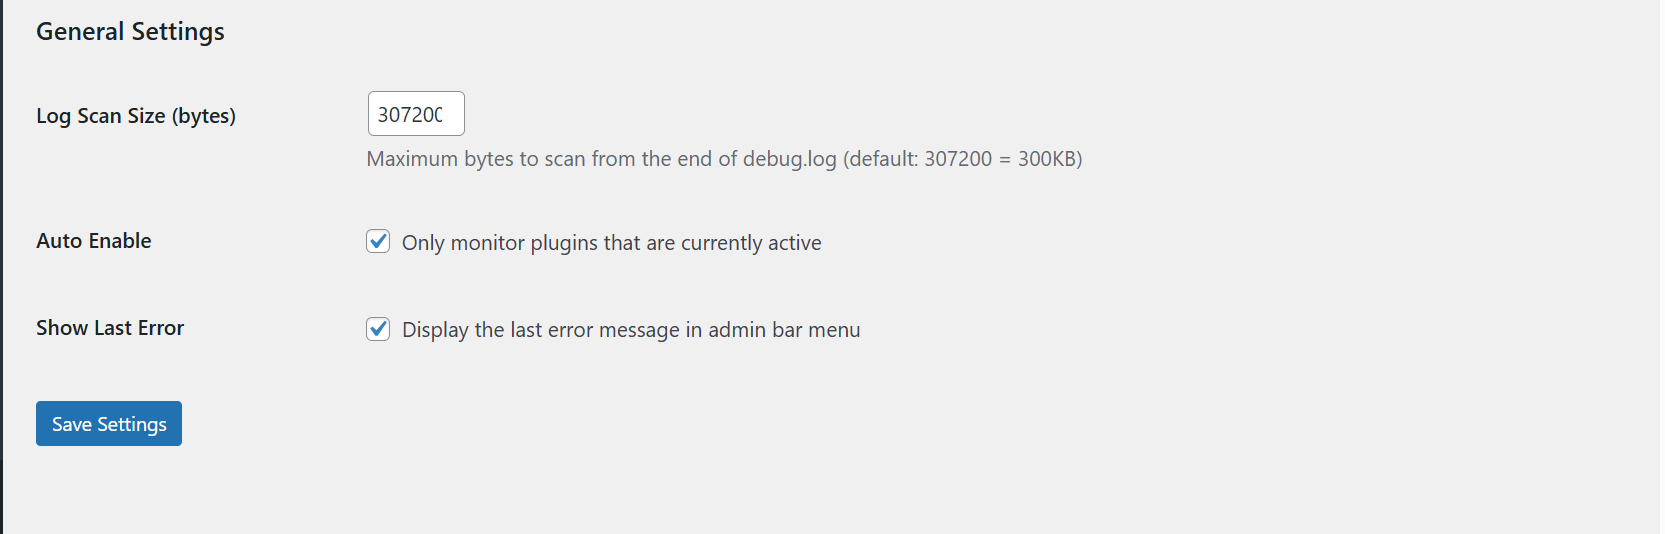
How much of the debug.log is scanned?
By default, the plugin scans the last 300KB of your debug.log file. You can customize this in Settings > Log Inspector > General Settings.
Will this slow down my site?
No. The plugin only runs in the WordPress admin area and uses efficient file reading techniques to minimize performance impact.
Can I temporarily disable monitoring for a plugin?
Yes! In the settings page, you can toggle any plugin on/off without deleting it from your list.
Does this work with Multisite?
Yes, the plugin works on WordPress Multisite installations.
Can I monitor custom/proprietary plugins?
Absolutely! As long as the plugin generates errors in the debug.log, you can monitor it.
How do I test if the plugin is working?
See the "Testing the Plugin" section below for detailed instructions on how to verify everything is working correctly.
更新日志:
- Fixed: Minor issues across the plugin [Issue #1]
- Enhanced: Compatibility with PHP 8.5 [Issue #2]
- Fixed: Inactive plugins incorrectly shown as enabled when "Only monitor active plugins" is turned on [Issue #3]
- Fixed: Edit button for monitored plugins not working due to incorrect page slug [Issue #4]
- Fixed: Edit form not reset to "Add New Plugin" after a successful update [Issue #5]
- Fixed: Cancel button on the Edit Plugin page not working due to incorrect page slug [Issue #6]
- Initial release