Plugin Name
| 开发者 |
cfkurtz
pdfernhout |
|---|---|
| 更新时间 | 2019年9月6日 04:34 |
| 捐献地址: | 去捐款 |
| PHP版本: | 4.3.1 及以上 |
| WordPress版本: | 5.2.3 |
| 版权: | GPLv2 or later |
| 版权网址: | 版权信息 |
详情介绍:
NarraFirma is companion software to the textbook Working with Stories in Your Community Or Organization: Participatory Narrative Inquiry.
Participatory narrative inquiry is an approach in which groups of people participate in gathering and working with raw stories of personal experience in order to make sense of complex patterns for better decision making. PNI focuses on the profound consideration of values, beliefs, feelings, and perspectives through the recounting and interpretation of lived experience.
What is NarraFirma?
- It's a checklist. NarraFirma provides practical guidance as you work, with questions for you to answer, recommendations based on the conditions you describe, activities that help you make decisions, and just-in-time advice.
- It's a journal. NarraFirma helps you keep careful records about what happened in your project, and it gives you places to reflect on what happened. This reminds you to keep learning as you work, and it helps you to document your project for future reference.
- It's a kiosk. NarraFirma helps you collect stories, on-line and/or off-line, based on question forms you design (with sample questions you can copy). Because story collection is integrated, there is no need to export or import data.
- It's a workstation. NarraFirma helps you explore and interpret patterns in your data (stories and answers to questions about stories), creating annotated visualizations you can use to make sense of the stories you collected.
- It's portable. You can install NarraFirma anywhere, as a WordPress plugin or a Node.js web application. Web hosting is inexpensive, popular, and well supported. You can also install NarraFirma on your local computer and use it off-line. (Whichever installation method you choose, we strongly suggest that you set up SSL security on your web site before collecting or entering confidential or important information. Many hosting providers can help you with this task.)
- It's a team player. With NarraFirma your team can work on projects together in real time without having to hand files back and forth. You can plan your project, collect stories, discover patterns, and reflect on what you've learned - together.
- It's an open book. NarraFirma is open source software. So if you have a question about how something works, you can just look at the source code to find out. If you need the software to do something it can't do, you can add new functionality yourself or ask someone else to add it.
- It works in the real world. One NarraFirma installation supports multiple projects, forms, data sets, and reports. Why? Because real-life story projects are rarely simple or predictable. So go ahead and make a mess. NarraFirma is ready for it.
安装:
To install NarraFirma:
- Download the NarraFirma plugin (in zip format) from WordPress.org or the NarraFirma web site.
- In your WordPress dashboard, click on "Plugins," then click "Add New."
- In the "Add Plugins" page, click "Upload Plugin."
- Click "Browse," then choose the zip file you downloaded.
- Click "Install Now."
- Click "Activate."
- You should see a new "NarraFirma" menu item in your dashboard menu. Click it.
- In the screen that appears, create a new project and add some users who can access it.
- In your WordPress installation, click "Plugins."
- Click "Add New."
- In the search box, type "narrafirma".
- When NarraFirma appears, click "Install."
- Click "Activate."
- You should see a new "NarraFirma" menu item in your dashboard menu. Click it.
- In the screen that appears, create a new project and add some users who can access it.
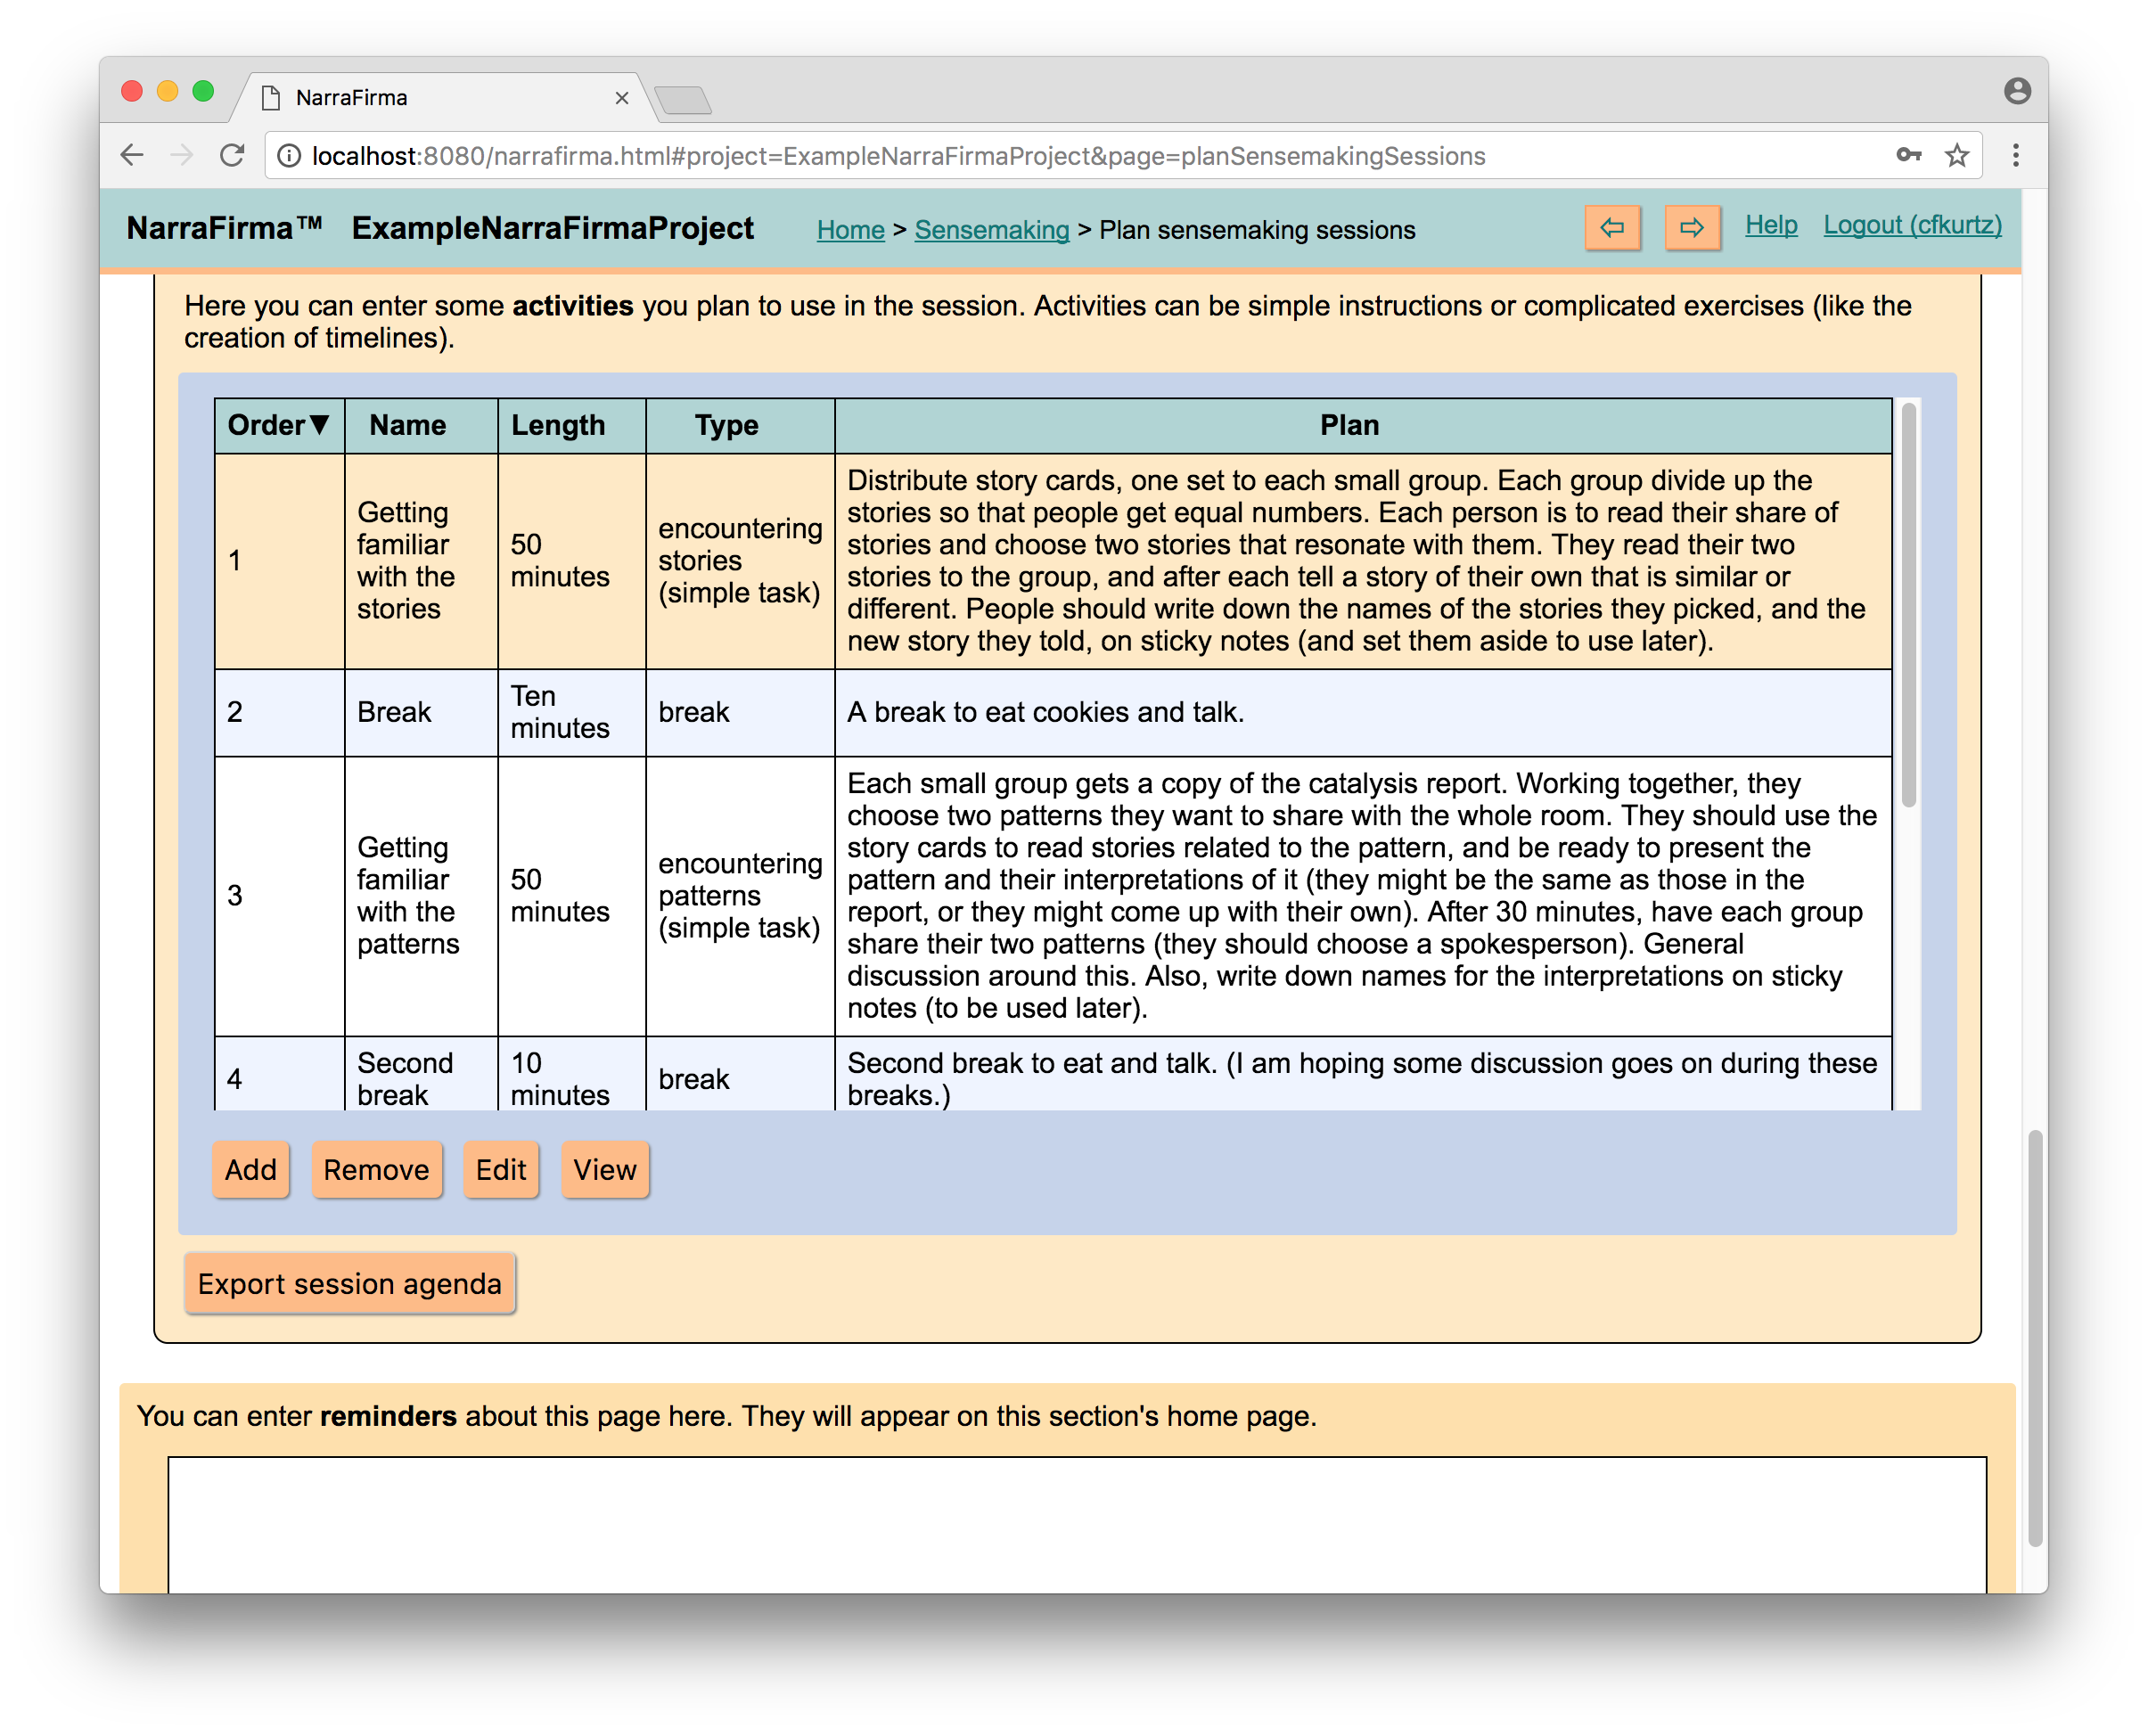
屏幕截图:
更新日志:
1.4.1
Added: Message when there are no graphs for a pattern because none had the minimum number of stories to graph
Fixed: Bug where expected bubbles on contingency graphs were sometimes too small (statistical results were not affected)
Fixed: Spurious message in contingency graph when question has no answer counts
1.4.0
Added: Correlation map that shows relationships among all scale questions (overall and by choice question)
Added: Ability to save graph data to CSV file (to recreate graph outside NarraFirma) for selected graph or whole catalysis report
Added: System for marking patterns as remarkable, unremarkable, to be reviewed, or redundant - improves catalysis workflow
Added: Ability to show or hide all columns in pattern table on "Explore patterns" page
Added: Non-printing observation note (to remember something about an observation without having it appear in the report)
Added: Project options page (for options that affect whole project)
Added: Project option to set CSV delimiter for import and export (comma, semicolon, tab)
Changed: Better interface for choosing graph types to show on "Explore patterns" page, with graphics
Changed: Import system now warns if you try to import floating-point (real) numbers rather than integers for scale data
Changed: Better help on graph types on "Explore patterns" page
Changed: Limited size of Mann-Whitney statistical results table for contingency-histograms and multiple histograms (can be very long)
Fixed: Observation/interpretation with no name now shows description on clustering page (instead of nothing)
Fixed: Firefox bug causing help window to be shown in tiny font; now appears in tab but normal sized
1.3.3
Added: Separate custom CSS field for graphs only - affects graphs both in application ("Explore patterns" page) and printed report
Added: Buttons to hide advanced options from beginners (affects three pages: print story cards, configure catalysis report, print catalysis report)
Added: More selection buttons (scales, choices, texts) to question choosing (in configure catalysis report and print story cards)
Changed: Simplified CSS class names of graph elements for easier reference in writing custom CSS field
1.3.2
Fixed: Bug where SVG files were not being saved to ZIP file
1.3.1
Changed: Improved drawing of counts on contingency charts
1.3.0
Added: Interface - Ability to create multiple observations per pattern
Added: Interface - Ability to include multiple patterns per observation
Added: Interface - Ability to save selected pattern image(s) on Explore Patterns page to SVG or PNG (zip file if multiple graphs)
Added: Interface - New field: observation "linking question" to introduce multiple interpretations (e.g., "Why do we see this pattern?")
Added: Interface - New field: interpretation "questions" to suggest things people can ponder in sensemaking (comes before "idea")
Added: Reporting - New catalysis report clustered by themes (groups of observations), with multiple interpretations following each observation
Added: Reporting - Option to choose observation strengths (high, medium, low, unassigned) in all catalysis report types
Added: Reporting - Can export all images related to observations only (zip file of PNG or SVG images)
Added: Reporting - Option to set print order of perspectives/themes during clustering (using "Edit cluster" popup window)
Added: Reporting - Option to hide specific observations, interpretations, or clusters from catalysis report (helpful when printing reports for different groups)
Added: Reporting - Option to show sequence number in catalysis report for each perspective, theme, observation, and interpretation
Added: Reporting - Option to hide report-creation information ("This report was generated") at start of catalysis report
Added: Reporting - Option to set label truncation limit on bar and contingency charts
Added: Reporting - Can now use simple bold and italic formatting in all report fields
Added: Graphing - Option to increase or decrease graph font sizes in report graphs by percentage
Added: Graphing - Option to hide "no answers" counts (applies to graphs and statistics; choice is saved per report and per pattern)
Added: Graphing - Option to replace all graph/statistical texts in catalysis report (e.g., "Count", "mean") to simplify or translate report
Added: Graphing - Option to show observed/expected numbers on contingency-table bubbles
Added: Graphing - Option to show row/column totals on contingency-table axes
Changed: Interface - Statistics calculations on "Explore patterns" page now happen in the background; can click on graphs while statistics are calculating
Changed: Interface - Collisions between users editing the same (large text) field are easier to resolve; writing in progress is preserved, and options are avilable to override/accept/edit changes
Changed: Interface - Startup message ("Retrieving project information") now shows count of messages loaded
Changed: Interface - Lists of questions on "Configure catalysis report" and "Print story cards" pages are now multi-column (less scrolling)
Changed: Interface - Better order/flow/explanations of things on "Configure catalysis report" page
Changed: Interface - Options relevant only to printing have been moved from "Configure catalysis report" page to "Print catalysis report" page
Changed: Interface - "Choose a project" dialog now shows a login link if you are not already logged in
Changed: Reporting - Catalysis report now uses HTML headers (H1 through H6) which are more easily converted to styles by word processors
Changed: Reporting - Old @header@ system for "sectioning" observations is no longer needed and has been removed (no backward compatibility; copy sections into new observations)
Changed: Graphing - In contingency tables and contingency-histogram tables, Y axis now shows answers to question from top to bottom instead of bottom to top
Changed: Graphing - "No answer" bars/bubbles/boxes are now last instead of first bars/columns/rows
Changed: Graphing - Expected bubble on contingency tables is now red - easier to see (can be changed in custom CSS for report)
Changed: Graphing - Squares in contingency-histogram tables are now all the same width, to make it easier to compare means
Changed: Clustering - Interpretation/observation item colors now vary by observation strength (which can be switched on or off)
Changed: Clustering - You can now select and move multiple items/clusters at once (shift-click, or click and drag selection box)
Changed: Clustering - Hover-over hints now show observation name, text, and strength
Changed: Clustering - Setting the clustering surface size is easier than it was
Fixed: Bug (Interface) where multi-choice answers did not display correctly in the "Show selected stories" popup window
Fixed: Bug (Interface) where count of contingency tables and contingency-histogram tables was sometimes wrong on "Configure catalysis report" page
Fixed: Bug (Reporting) where custom CSS was not being applied to images in catalysis report
Fixed: Bug (Reporting) where "Introduction" field was being ignored in catalysis report printing
Fixed: Bug (Export) where exporting story form or stories from "Export stories" page was not working correctly
Fixed: Bug (Graphing) where PNGs were empty in printed catalysis report
Fixed: Bug (Graphing) where "No answer" bar/bubble/box was being sorted in the middle of answers when some answers were numbers
Fixed: Bug (Clustering) where changing size of clustering surface did not update image immediately
Fixed: Bug (Clustering) where you could drag an item off the clustering surface
1.2.6
Changed: Perspectives in catalysis report are now sorted by their vertical position in the clustering space
Changed: Reduced number of debug messages in CSV pre-import check, to prevent error messages from being pushed out by sheer volume of messages on large data sets
Fixed: Bug where zero scale values were not being displayed on histograms (we apologize for never having noticed this before)
1.2.5
Added: Option to hide statistical panels on Explore patterns page (useful when there are long lists of results to scroll through)
Added: Way to view/copy statistical results in pop-up window while looking at graph on Explore patterns page
Added: Interpretation count to summary above patterns table on Explore patterns page
Changed: Bar graph Y axis label now allocates more space when graph counts need more digits to display
Fixed: Bug where showing selected stories was not working correctly in new catalysis report
1.2.4
Added: Better options for replacing or keeping existing questions when importing CSV story form
Added: Way to export observations, intepretations, perspectives from catalysis report to CSV and import them into new report on different story collection (as long as question names match)
Added: Way to view/copy names and texts of random sample of stories (10, 20, or 30) drawn from stories selected on graph
Added: Option to see answers to selected (important) questions while viewing/copying stories in graph selection
Added: Separate columns in catalysis patterns table for (up to 3) questions referred to by each pattern (so you can sort by each question individually)
Added: Option to hide statistical results in printed catalysis report
Added: Option to set number of bins for Story length question
Added: CSS Class names for graph axis labels depending on graph type (bar, histogram, etc)
Added: Summary above catalysis patterns table showing counts of patterns and observations (by strength)
Added: Story index (number in story collection) is now displayed in all places where story names are given (lists, story cards), to distinguish between stories with the same name
Changed: Filter (for catalysis reports and story cards) can now have negated queries (e.g., include every answer but one)
Changed: Filter (for catalysis reports and story cards) can now have multiple questions, creating more complex queries
Changed: Better pre-import check messages
Changed: Improved handling of clustering in situation where interpretations have texts but no names
Changed: Better interface for making and doing things with graph selections
Changed: Moved saved graph selection reference from observation text to its own field (that does not appear in printed catalysis report)
Changed: Better question groupings on "Configure catalysis report" page
Changed: Now if you hover over a dot on a scatterplot and there is more than one story there, it will show you (the first ten of) the story names, instead of just one name/text
Changed: In the catalysis pattern table, for side-by-side scatterplots, instead of showing the lowest p value, it now shows the range of p values (which is more relevant)
Changed: Statistics panel is now transparent (no longer blue), so it doesn't stick out so much
Changed: Better font sizes for various graph axis labels
Changed: Better error messages for malformed HTML
Changed: Small interface improvements here and there
Fixed: Bug where selected pattern in catalyis pattern table would scroll out of view
Fixed: Bug where allowing AxA question combinations would also include both AXB and BXA question combinations
Fixed: Bug where portion of pre-import check log was being written to browser console when actually importing data
Fixed: Bug where answers lumped during import were printing multiple times in story cards
Fixed: Various little bugs here and there...
1.2.3
Fixed: Critical bug (introduced in v1.2.0) where exporting "project snapshot with stories" was not actually exporting any stories
Fixed: Bug where extra result lines were displayed in Mann-Whitney U test (statistics for multiple histograms and contingency-histogram charts)
Added: Information on "Configure catalysis report" page telling user how many patterns (graphs, statistical calculations) will be generated by their current selections
Added: Warnings when large numbers of patterns will cause the "Explore patterns" page to load slowly (>10K graphs) or the browser to stop responding (>50K graphs)
Added: Buttons on "Configure catalysis report" and "Print story cards" pages to select all story questions or participant questions
Changed: On "Explore patterns" page, progress bar (shown while calculating statistical results) now updates less frequently, causing the process to run faster
1.2.2
Added: Can now run pre-import check and export story form from "Design story forms" page (so you no longer have to create a story collection to do these things)
Fixed: Bug where import scale range value of 0 was being ignored
Fixed: Bug where story form name was not being set properly
Fixed: Bug where newly created question did not have id field set, resulting in an error when you replaced it during import of story form
1.2.1
Added: Option to graph multi-choice questions against themselves (to explore coincidences between answers)
Changed: Changed "vs" to "x" in graph names, to read better in languages other than English
Changed: Increased font size of axis labels (they seem too small now that the graphs are a little bigger)
Changed: Made sure graphs of every type have a title at the top; gave title a class; styled it
Fixed: Bug where observations-only report did not include observations without the strength value set
1.2.0
Added: Many new import options to accommodate/manage/massage CSV data files from a variety of surveying systems
Added: Detailed guide to importing data
Added: All CSV import options are now specifiable in NarraFirma itself (instead of only through a specification file)
Added: Data consolidation (lumping together similar answers) using CSV import
Added: Pre-import data check to verify CSV data integrity before actually adding stories to project
Added: New graph type - choice by choice by scale, or a contingency table with little pseudo-histogram boxes
Added: Added story length question (generated) to graphs
Added: Table of links in catalysis report to observations and interpretations for each perspective (sorted by strength)
Added: Filter to limit catalysis report to subset of stories based on answer(s) to question
Added: Option to print catalysis report with observations only (for group catalysis workshop) and with only particular strengths
Added: Option to hide graphs with few stories (applies to multiple histograms/scatterplots on Explore patterns page and catalysis report)
Added: Ability to save catalysis report graphs in SVG format rather than PNG (better resolution and can be styled with CSS)
Added: Ability to refer to portion of observation name as well as text using @header@ system
Added: Button on Explore patterns page to show stories selected in graph (for copying)
Added: CSS classes for named elements in catalysis reports (to style particular perspectives, observations, and interpretations)
Added: Filter to limit story cards to subset of stories based on answer(s) to question
Added: Choice of question sort order when printing story cards: alphabetically or in story form order, with scales separate or mixed in
Added: Option to truncate very long stories when printing story cards
Added: CSS classes to style particular question names and answers in story cards
Added: "Quick links" on home page to access elements of projects (questions, forms, reports, etc)
Added: Method to reset (empty out) project, removing "hidden" stories connected to deleted story collections (project admin only)
Added: Button to display names of deleted story collections (so you can get them back again, or avoid doing so)
Added: Method to archive (hide) old projects (site admin only)
Changed: Moved around some buttons and pages in Collection to make it more clear how/where to import and export data
Changed: Improved names of graph types on configure catalysis report page (to make it clear why would want each one)
Changed: Project import now requires administrator permission (so does new reset function)
Changed: Project import now warns user if there is data in the project (questions, forms, collections, reports)
Changed: Link to site administration page (formerly called "Administration tool") is now visible only to site administrator (and is now on Home page)
Changed: Improved design, organization, explanations of site administration pages in both node.js and WordPress versions
Changed: Improved layout of catalysis report pages for multi-graph results
Changed: Stress tested with 13K stories; works fine, though slowly (may need increased memory setting at these numbers)
Fixed: Bug where "admin" project permission was not being set properly in node.js version (but it was not being used for anything)
Fixed: Bug where creating new project with long name in WordPress version caused 500 server error (now name length is restricted to <= 20 characters)
Fixed: Bug that caused spurious error messages during report generation
Fixed: Bug that caused spurious error messages about missing IDs when creating story forms
Fixed: Bug in bar graphs for boolean questions ("no" was being counted as a non-answer)
Fixed: Bad handling of missing/empty custom CSS in imported story form file
Fixed: Navigate-in-page "name" anchors changed to "id" anchors (because "name" anchors are deprecated in HTML 5)
1.1.0
- Added: Optional summary of submitted stories and other data, for participants to copy and save
- Added: Human readable project report with all data entered for use outside of software
- Fixed: Bug in login link
- Added: Notes for questions, to keep track of decisions made while choosing and editing questions
- Fixed: All user communications in the survey can now be customized (essential for non-English surveys)
- Fixed: Made navigation bar (at top) not scroll (was accidentally made scrolling)
- Changed: Updated WordPress screenshots for new version
- Added: New data integrity graphs showing overall patterns across all questions (all scale values; per-participant means and sd; number of non-answers)
- Added: User definable CSS for on-line and printed surveys, story cards, catalysis report
- Added: Qualitative (free-text) answers in catalysis patterns
- Added: More user definable fields to customize on-line story collection
- Added: Multiple scatterplots to show scale+scale+choice question combinations
- Added: Link to choose another project without logging out
- Added: Visible slider number (0 to 100) and way to set value precisely
- Added: Option to set maximum number of stories participants can tell
- Added: Story count per participant (framed as a "question" so it can form patterns with other questions)
- Added: Auto-create story form option (using all existing questions)
- Added: Can now choose which questions to include on story cards
- Added: More control over the look of story cards, including custom CSS but also which questions to include and how to draw ranges
- Added: Ability to set all story form options during CSV import
- Added: Way to distinguish among participants during import (to count stories per participant)
- Added: Scale conversion during import (for scale data collected with ranges other than 0-100)
- Added: Field to write (then copy and paste) reminders from Return phase of one project to Planning phase of the next
- Added: Way to choose types of graphs to view
- Added: Counts above bars in bar graphs and histograms
- Added: Correlation lines (optional) in scatterplots
- Added: Mode to histograms
- Added: Support for multiple observations per pattern (graph)
- Added: Observation strength field to sort strong from weak patterns
- Added: Interpretations to patterns list (can sort by them)
- Added: More options for catalysis graphs including histogram bins, scatterplot dot size and opacity
- Added: More user-supplied sections for catalysis report
- Added: Unanswered count (number of stories with no answer to the question) to all graphs
- Changed: Improved data import, with better error handling and help
- Changed: Overhaul of screen designs and color palettes
- Changed: Improved statistical information displays; improved reporting on statistical errors
- Changed: Better error reporting and alerts to user
- Changed: More tips and FAQ items to help system
- Changed: More verification of statistical result against same tests in other software (you can't see this but it's important)
- Changed: More help in various places to deal with questions people have had
- Fixed: Explore Patterns page now shows cancelable progress bar when large numbers of statistical results are being calculated
- Fixed: Bug in chi-squared statistical calculation that disqualified too many comparisons
- Fixed: Survey image now works
- Fixed: Text areas now slightly taller
- Fixed: Catalysis "ideas" now print in report
- Fixed: Catalysis clustering diagram now updates better for changed interpretatations on previous page
- Fixed: No longer showing questions in graphing sections (spot-check graphs, catalysis) that are not used in current story collection
- Fixed: Eliciting question now included in spot-check graphs and catalysis
- Fixed: Better graph sizing and scaling
- Fixed: Statistical results no longer say "p=0.000" when p<0.001
- Fixed: Better feedback when taking survey, showing that story has been submitted and accepted
- Fixed: Better error handling for missing or untitled items (like story collections and catalysis reports)
- Fixed: Dividing line (hr) no longer displays on story cards when they are being printed
- Added clarifying headers and popup hints for all links on dashboard (project phase) pages.
- Improved styling and clarity of catalysis report, printed story form, and story cards.
- Added story count to Spot-check graphs screen.
- Fixed bug in checkbox questions where data was not being stored correctly.
- Improved colors, labels, spacing of graphs.
- Added story counts to Review stories and Explore patterns screens.
- Added "does not apply" check box (configurable) to slider questions.
- Improved help on question types.
- Improved look of story card display.
- Moved annotations to top of Review stories list; colored in green so they stand out.
- Sanitize SQL input in WordPress plugin.
- Improve TypeScript typings for tsc 1.6.
- Improvements for Node.js version and README/SETUP for installation.
- Now uses NarraFirma namespace in WordPress plugin PHP to conform with WordPress guidelines.
- Fixed WordPress plugin survey bug where always returning first questionnaire added in a topic instead of the last one.
- Fixed problem where first two characters of display name are being truncated during CSV export of story form.
- Added arrows to sliders in survey form to make it more useful in narrow mobile displays.
- Added warning about story collection creation.
- Fixed some typos.
- More improvements to bundling of JavaScript for faster loading. Also improved startup feedback to show loading application, getting user information, or retrieving project data.
- Improvements to bundling of JavaScript code for faster loading.
- This is the first publicly released version of NarraFirma. For (highly detailed and entertaining) change logs, see the GitHub repository.