
Opti-Behavior – Self-Hosted Heatmaps, Funnels, A/B Testing & Smart Insights
| 开发者 | optiuser |
|---|---|
| 更新时间 | 2026年10月17日 18:58 |
| 捐献地址: | 去捐款 |
标签
下载
详情介绍:
- Collect – seven collectors record what visitors do: traffic, heatmaps and funnels in the free plugin; session recordings, errors, forms and user journeys in Pro.
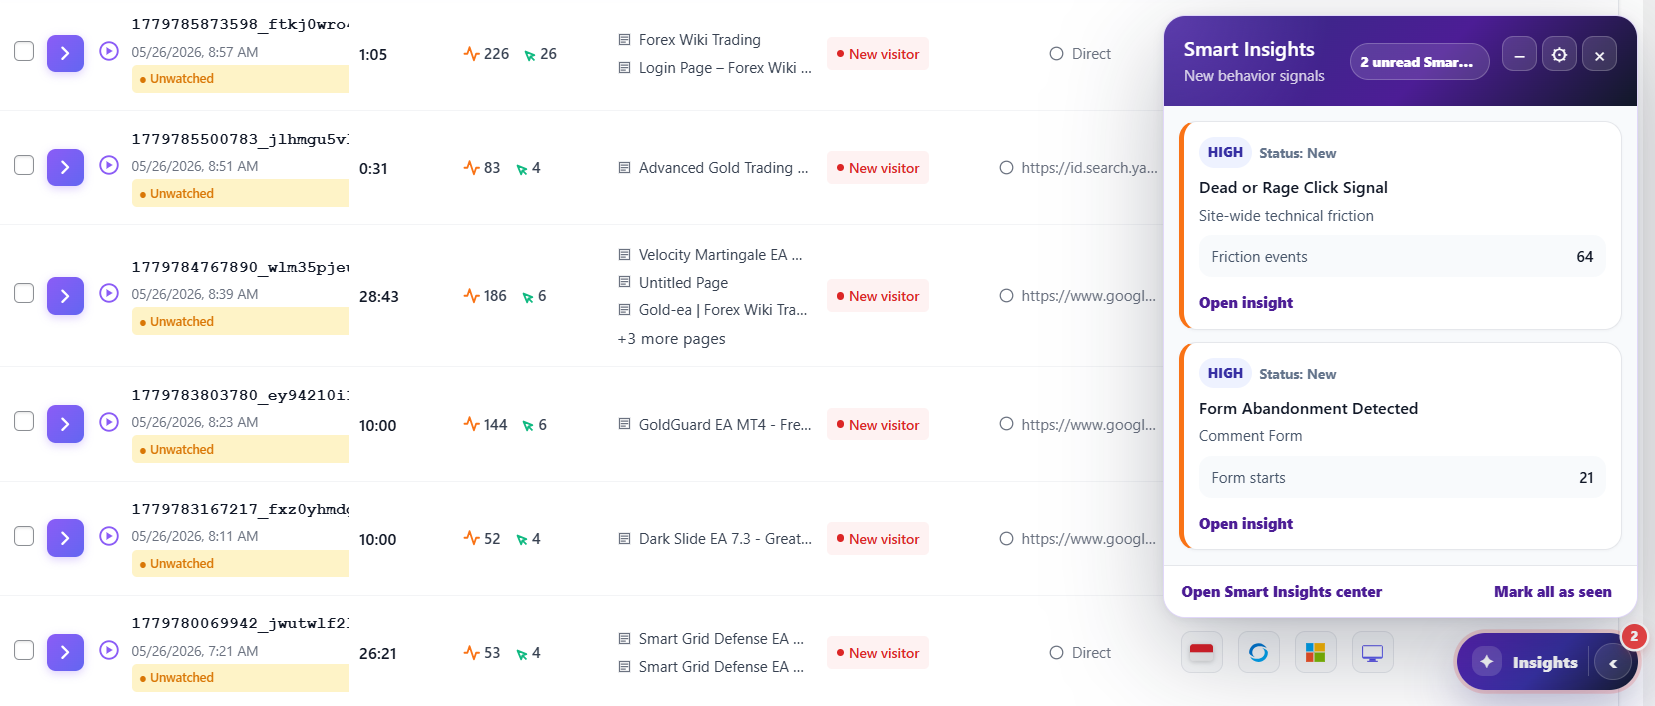
- Understand – Smart Insights reads them together and writes one card per problem: what is wrong, on which page or funnel step, how many visitors it costs, and since when.
- Fix – each card gives one next action and opens the report that shows the problem: the heatmap, the funnel step, the recording.
- Prove – mark the card as fixed: Opti-Behavior compares the period before and after your change and shows the result. Test bigger changes with an A/B test.
- 📊 Real-Time Analytics - See what visitors are doing now: sessions, pageviews, devices, traffic sources, countries, engagement, and bot-filtered activity.
- 🔥 Heatmaps - See where visitors click on desktop and mobile. Scroll, move and attention heatmaps are Pro features.
- 🧭 Conversion Funnels - Find the exact step where motivation turns into abandonment, from landing page to checkout or lead form.
- 🧪 A/B Testing - Replace opinions with evidence by testing pages, elements, goals, and conversion paths directly in WordPress.
- 💡 Smart Insights - One card per problem, ranked by the visitors it costs, with the evidence, the next action and a before / after result.
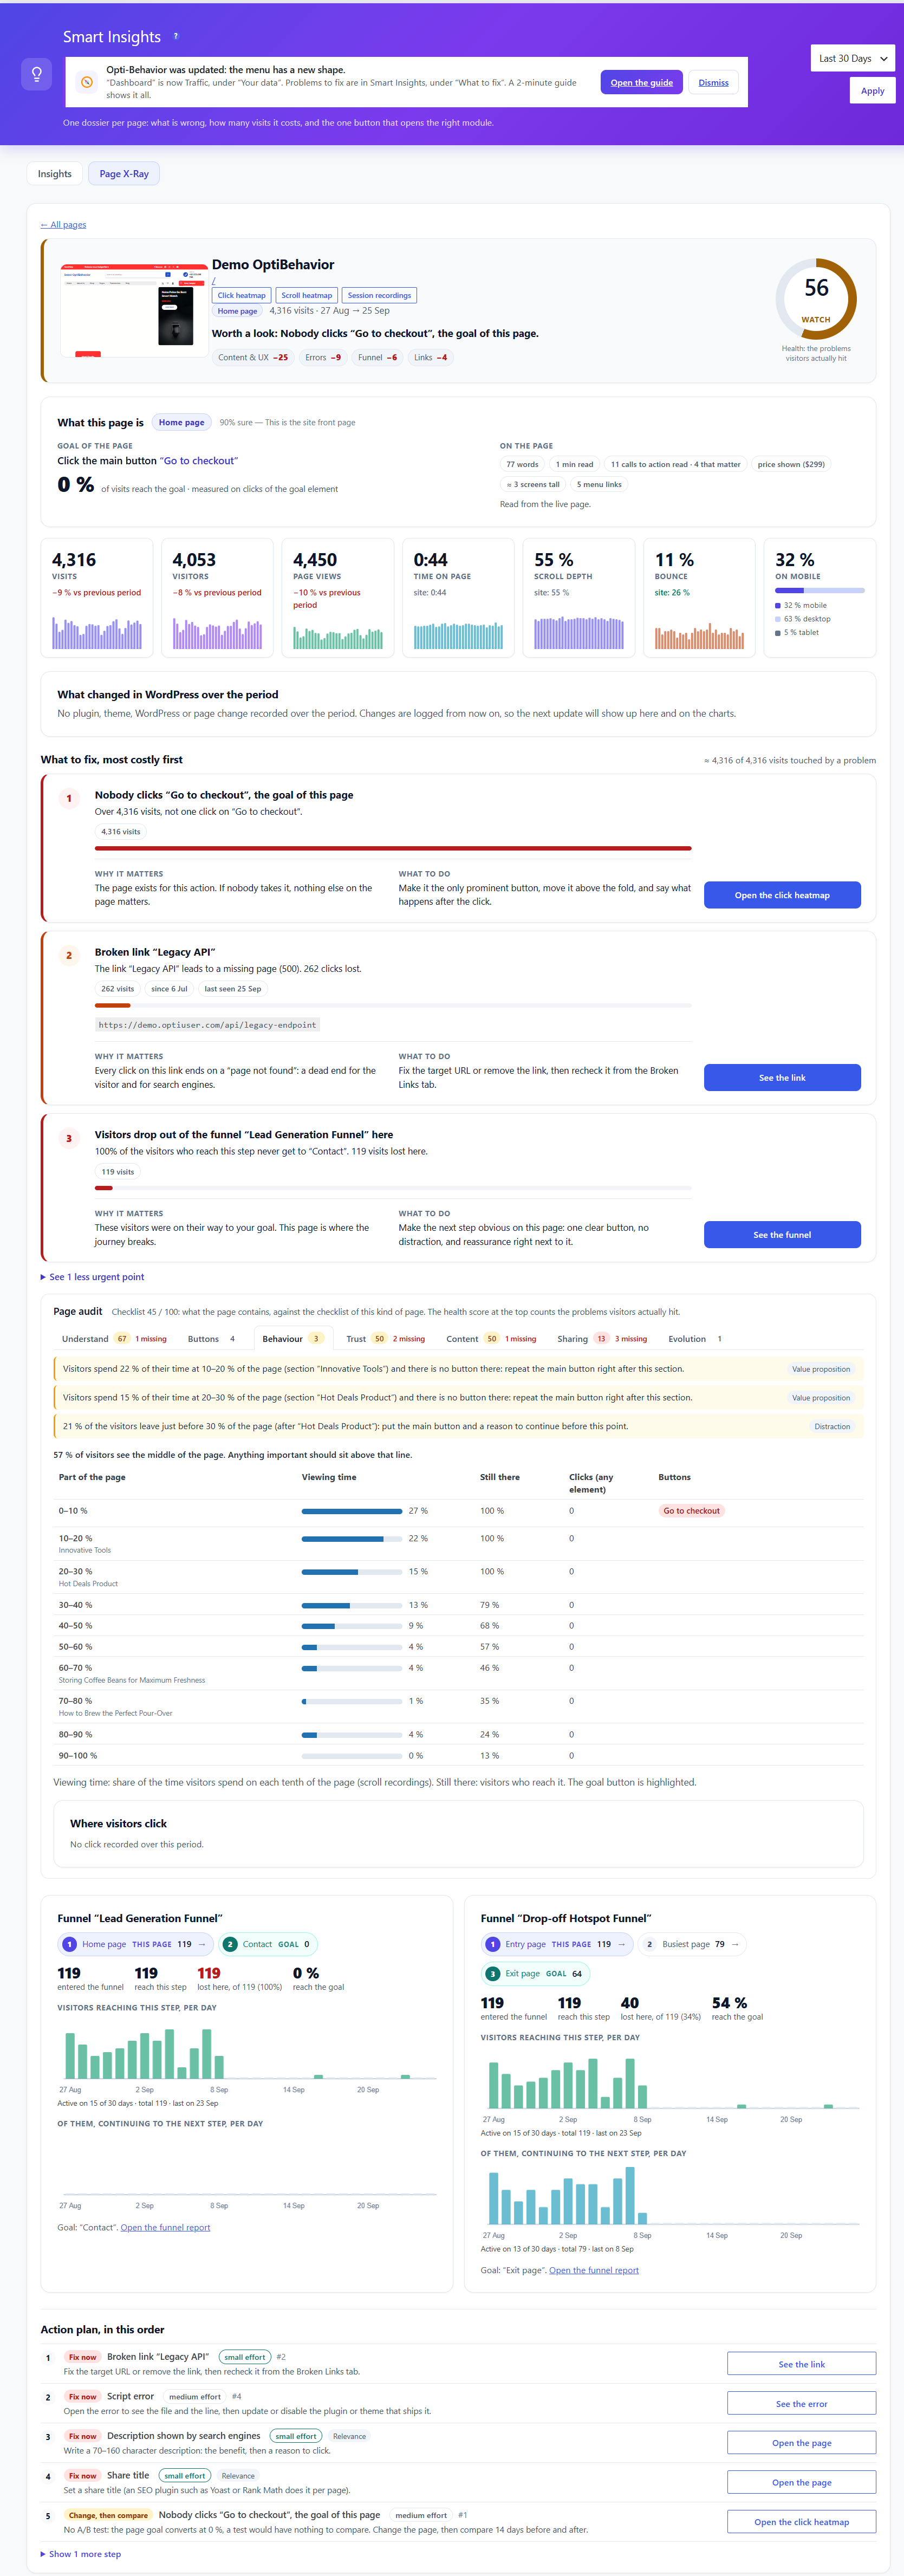
- 🔬 Page X-Ray - One report per page: health score, behavior map, page audit, what changed in WordPress, and an action plan. Pro feature.
- 🎥 Session Recordings - Watch hesitation, rage clicks, dead clicks, scrolling, navigation, and friction moments in real user sessions. Pro feature.
- 📝 Form Analytics - Identify fields that create effort, confusion, errors, or abandonment before users submit. Pro feature.
- 🛤️ User Journey Analytics - Visualize the paths visitors naturally take through your site and turn high-value journeys into funnels. Pro feature.
- ⚠️ Errors & Performance Tracking - Detect JavaScript errors, broken links, rage clicks, dead clicks, and performance issues that silently reduce trust. Pro feature.
- 🔒 Settings & Privacy Controls - Control consent, storage, reports, cleanup, languages, debugging, and privacy options from one place.
- Click heatmaps for desktop and mobile.
- Real-time traffic overview with visitors, sessions, pageviews, bounce rate, scroll depth, top pages, traffic sources, and visitor map.
- Unlimited conversion funnels with multi-step drop-off analysis and device filtering.
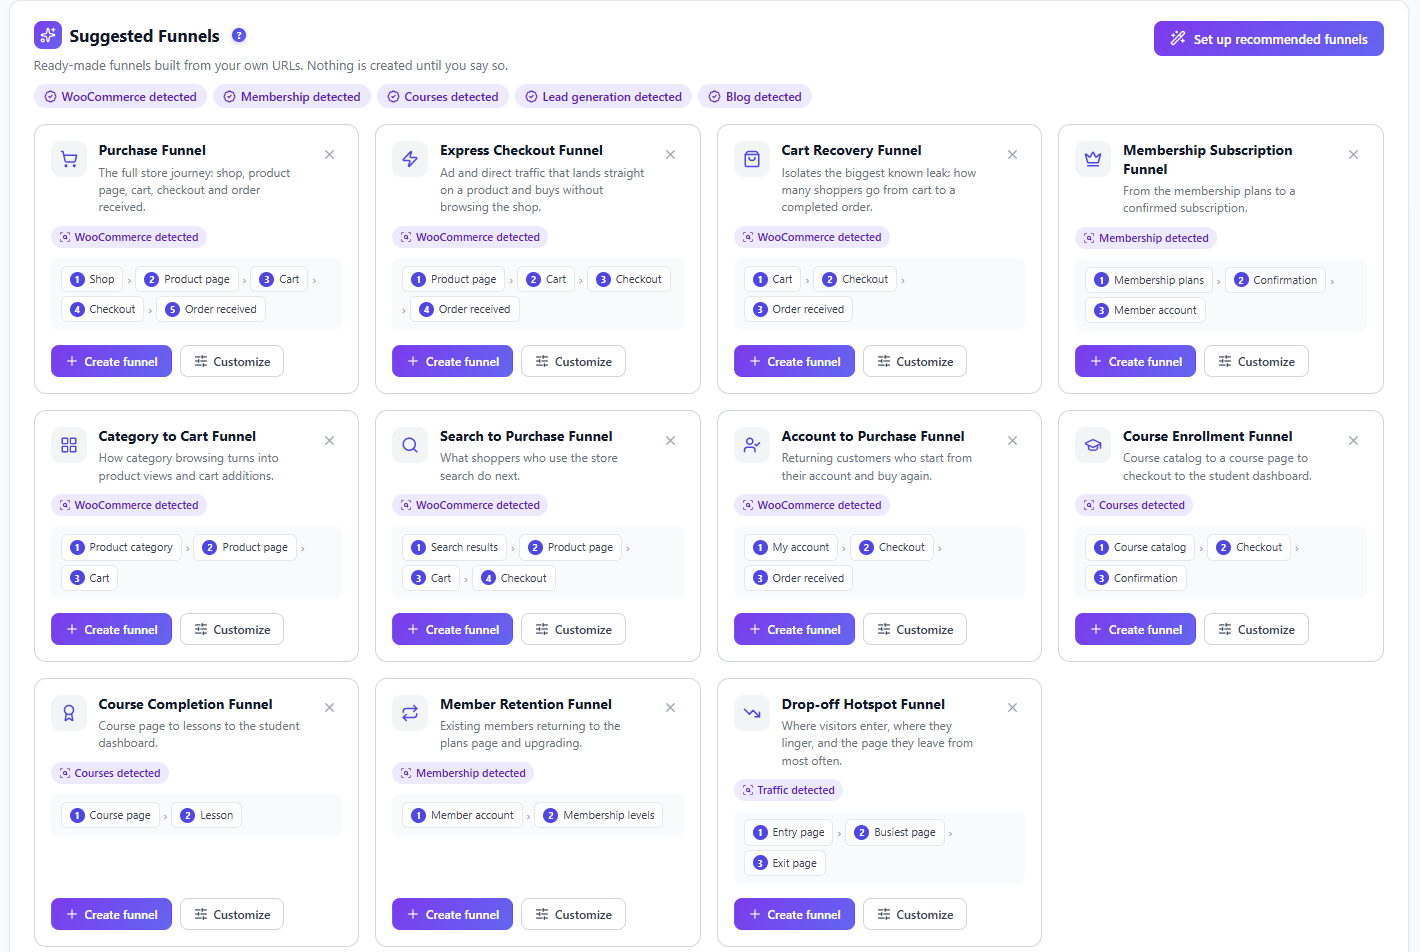
- Automatic funnel suggestions: Opti-Behavior detects your site type (WooCommerce, Easy Digital Downloads, blog, lead-gen, signup, membership, LMS, booking) and proposes ready-made funnels built from your own store URLs — create one in a click, or customize it in the builder first. Nothing is ever created without you asking.
- A/B testing for page-split experiments, variant previews, conversion goals, and winner application.
- Session and visitor tracking with duration, visited pages, referrers, outbound links, and engagement patterns.
- Smart Insights: cards ranked by visitors lost, confidence from the visits measured, before / after results, weekly summaries and notifications.
- "How it works" page with a Setup check, a first-days checklist and the latest release notes.
- Bot and spam detection and filtering for cleaner decisions.
- Scheduled email reports: daily, weekly, or monthly.
- Hybrid Storage engine that stores high-volume analytics events in files instead of the database. Database size measured on one production site.
- Cookie-free anonymous tracking by default, IP anonymization, and no third-party analytics data sharing. Full Tracking mode uses cookies only after the visitor accepts the consent banner, and the
[opti_behavior_cookie_settings]shortcode lets visitors change or withdraw their choice at any time. - Multilingual admin: English, French, German, Spanish, Portuguese, and Italian.
- Page X-Ray - one report per page with a health score, behavior map, page audit, WordPress change log, before / after evolution and an action plan.
- Session Recordings - watch real visits and understand what users actually experienced.
- Error Tracking - detect JavaScript errors, network issues, broken links, and Core Web Vitals problems.
- Friction Detection - find rage clicks and dead clicks that signal frustration.
- Form Analytics - measure field-level effort, abandonment, refill behavior, and completion time.
- User Journey Analytics - use Sankey-style journey visualization to see common paths, exits, and opportunities.
- Scroll, move and attention heatmaps - see how far visitors scroll, where the mouse moves and where attention stays.
- Advanced Heatmap Filtering - segment heatmaps by country, browser, device, visitor type, and date.
- Advanced A/B Testing - use visual edits, targeting, scheduling, WooCommerce tests, and revenue attribution.
- Pro Smart Insights signals - errors, rage and dead clicks, slow pages, broken links and abandoned forms feed Smart Insights and Page X-Ray, with a session recording as proof when one exists.
- Self-hosted data - visitor behavior stays on your WordPress server.
- No third-party analytics cloud - analytics data is not sold or shared with external behavior platforms.
- Privacy controls - cookie-free anonymous mode by default, IP anonymization, retention settings, consent banner and visitor cookie preferences, and uninstall cleanup options.
- Lightweight tracking - minified trackers loaded with
defer. We measured PageSpeed on a test page with the plugin on and off: see the article. Database size measured on one production site. - WooCommerce ready - analyze product pages, carts, checkout funnels, and revenue-focused experiments while keeping customer behavior data under your control.
安装:
- Log in to your WordPress admin panel
- Navigate to Plugins > Add New
- Search for "Opti-Behavior"
- Click "Install Now" and then "Activate"
- Download the plugin zip file
- Log in to your WordPress admin panel
- Navigate to Plugins > Add New > Upload Plugin
- Choose the downloaded zip file and click "Install Now"
- After installation, click "Activate Plugin"
- Navigate to Opti-Behavior in your WordPress admin menu. The menu has two groups: Your data and What to fix.
- The plugin starts tracking automatically - no configuration required!
- Open How it works: the Setup check confirms that visits are received and offers to exclude your own visits.
- Visit Traffic to see real-time visitor activity and Heatmaps to see where visitors click.
- Open Funnels: Opti-Behavior proposes ready-made funnels for your site type, created in one click.
- Check Smart Insights: the first cards usually come after about 100 visits on a page, and the menu light turns red, yellow or green.
- Adjust Settings to customize tracking behavior and privacy options.
屏幕截图:




常见问题:
Is there a live demo I can try?
Yes! You can explore the full Opti-Behavior dashboard instantly at demo.optiuser.com – no installation, no account, no credit card required. Browse real heatmaps, funnels, A/B tests, and Smart Insights before installing.
What does click tracking record in the free plugin?
Each click on your tracked pages: where it happened and which element was clicked, shown on the click heatmap for desktop and mobile. Clicks on links to other sites are recorded too. The data is stored in your own WordPress database and files.
Does the free plugin record sessions?
No. The free plugin records clicks, traffic and funnels. Session recordings (session replay), scroll heatmaps and rage-click detection are in Opti-Behavior Pro, a separate plugin.
How does Smart Insights decide what to fix first?
By the visitors each problem costs. Every card counts the visits it touches and the visitors it loses, compares the page with your site average, and gets a confidence level from the number of visits measured. A card is "Critical" only with enough visits, high confidence and a loss that matters on your site; cards built on few visits are marked "Provisional". Money is shown only for a checkout funnel with at least 20 orders or a form with your own value of a conversion. When you fix a problem, mark the card as resolved: Opti-Behavior measures the period after your change and shows the result. Most "insight" tools raise alarms. Smart Insights counts.
- Ranked by visitors lost, not by alarming words. "Critical" must be earned: enough visits measured, high confidence, and a loss that matters on your site.
- Confidence comes from the visits measured. A card built on few visits says "Provisional · N visits" instead of pretending.
- Money only when it is real. An amount "at risk" is shown for a funnel that ends at the checkout (with at least 20 orders over the period) or for a form priced with your own value of a conversion. Every other card shows the visitors it loses.
- Funnel cards name the step visitors leave: "between Product and Cart, 60 of 90 visitors leave".
- One card per problem. Cards with identical data are merged, and a card the rules no longer confirm is closed, never counted as a win.
- No lift promises without a published source.
- Results you can check. A resolved card shows before, after and the verdict. The admin menu light shows where you stand at a glance: red = a Critical problem, yellow = High or Medium, green = nothing to fix.
Why don't I see any insights yet?
Smart Insights needs data first: the first cards usually come after about 100 visits on a page. Open How it works: its Setup check tells you whether visits are received, whether a caching or optimization plugin blocks a tracker, and whether your own visits are counted (exclude them for cleaner data).
What is Page X-Ray?
Page X-Ray is the per-page report of Smart Insights, in Opti-Behavior Pro. It answers "why doesn't this page convert?" with a health score, what the page is for and whether visitors reach its main button, a behavior map, a page audit (clarity, buttons, trust, content, sharing), the WordPress changes that came before a problem, a before / after comparison and an action plan. The free plugin shows the tab with an example report. Pick a page and get one report built from every module:
- Health score with the share of each module, and a page list ranked from the one to fix first.
- What the page is – its type (sales page, product, article, lead page…), its goal and how often visitors reach its main button. Choose the buttons that matter by clicking them on the page.
- Behavior map – the page in ten parts: viewing time, visitors still there, clicks, and where to move or repeat the main button.
- Page audit – the conversion checklist of its type: clarity, buttons, trust (reviews, guarantee, payment signs, contact), content and sharing. Each check says what was found on the page and what to do.
- What changed – plugin, theme and core updates and page edits are marked on every chart; a problem that starts right after a change names it: "started 1 day after Plugin X was updated".
- Evolution – 14 days before against 14 days after each change, with a noise test so a random swing is never reported as a result.
- Action plan – in order: check the measurement, fix the defects, then test each change with an A/B test only when the page has the traffic to conclude.
Does this plugin slow down my website?
The tracking scripts are minified and loaded with defer, events are sent in batches, and the Hybrid Storage engine can store high-volume analytics events in files instead of writing every interaction directly to MySQL. We measured PageSpeed on a test page with the plugin on and off: see the article. As with any analytics tool, the result on your site depends on your hosting, traffic volume and settings.
What privacy controls does it include?
Self-hosted: visitor data stays on your own server. Opti-Behavior includes IP anonymization, data retention controls, cookie-free anonymous tracking by default, a built-in consent banner (or your consent plugin) before Full Tracking sets any cookie, and the [opti_behavior_cookie_settings] shortcode so visitors can change or withdraw their choice at any time. These controls do not make a site compliant on their own: update your privacy policy and check your setup with your own legal adviser.
Does it work without cookies?
Yes. Anonymous mode, the default, sets no cookie: visits are counted on your own server. Full Tracking mode uses cookies only after the visitor accepts the consent banner. Whether your site still needs a consent banner depends on everything it loads, not only analytics: see WordPress analytics without a cookie banner and check with your data protection adviser.
How is this different from Microsoft Clarity?
Clarity is a cloud service from Microsoft: behavior data is processed on Microsoft's servers under its terms. Opti-Behavior runs inside WordPress and keeps visitor data on your own server. It also includes funnels, scheduled reports, bot filtering, A/B testing, and Smart Insights that ranks what to fix first and checks whether your fix worked.
How is this different from Hotjar?
Hotjar is a cloud service: behavior data is stored on Hotjar's servers. Opti-Behavior keeps behavior analytics inside WordPress, on your own server. Click heatmaps and funnels are in the Free plugin; recordings, scroll / move / attention heatmaps, form analytics, journeys, errors and advanced A/B testing are in Pro. See Opti-Behavior vs Hotjar.
How is this different from Matomo?
Matomo is a self-hosted web analytics platform. Opti-Behavior focuses on behavior analytics and conversion work inside WordPress: heatmaps, funnels and A/B testing in Free; recordings, forms, journeys and friction insights in Pro.
Are there any session or pageview limits?
There are no artificial SaaS-style session caps in the plugin. Your practical limit is your own server storage, database capacity, and retention settings.
Can I export my data?
Yes. The Traffic dashboard exports its data to CSV.
Does this work with caching plugins?
Yes. Opti-Behavior is designed to work with common WordPress caching plugins such as WP Rocket, LiteSpeed Cache, W3 Total Cache, Autoptimize, SG Optimizer, and WP Super Cache.
Will this work on multisite?
Opti-Behavior works on multisite: each site keeps its own tables and data folder. After network activation, open each site's dashboard once. Multisite is not yet in our test suite, so please test on a staging copy first.
Does this plugin call any external services?
Yes, only for specific supporting features such as geolocation, admin map tiles, an optional daily status message (site URL, versions, one admin email) after you accept it on the welcome screen, optional announcements (licence type only, same condition), and user-initiated OptiUser website links (the Pro trial page included). See the External Services section below for details.
What data does this plugin collect?
Depending on settings, Opti-Behavior can collect page views, URLs, click positions, scroll depth, session timestamps, referrers, device/browser data, anonymized IP data, approximate location signals, and interaction metadata. It does not collect form field values by default, and analytics data is stored locally in your WordPress database or file system.
Can I delete all data when uninstalling?
Yes. Enable Delete all data on uninstall in Settings to remove stored plugin data when the plugin is uninstalled.
My host is busy or shared — how do I keep the plugin light on the server?
Two settings make the biggest difference. First, run WP-Cron from a real server cron instead of inside visitor page loads: add define( 'DISABLE_WP_CRON', true ); to wp-config.php and have your host call wp-cron.php every 5 minutes. Cleanup, reports and database upkeep then never run inside a visitor request. Second, keep the default "Posts & Pages Only" heatmap scope and the default data retention so tables stay small. All heavy maintenance (index changes, table conversion, OPTIMIZE) is size-capped and time-boxed, and every frontend tracking request is rate-limited so concurrent visitors cannot pile up on the database.
Does it work with WooCommerce?
Yes. Use Opti-Behavior to analyze product pages, cart behavior, checkout funnels, CTA clicks, and revenue-focused A/B tests while keeping customer behavior data under your control.
Does it work with page builders?
Yes. Opti-Behavior works with Gutenberg, Elementor, Divi, Beaver Builder, WPBakery, and other major WordPress builders.
What is the Hybrid Storage Engine?
Hybrid Storage is Opti-Behavior's performance-focused storage approach. Instead of pushing every click, scroll, and pageview directly into MySQL, high-volume events can be stored in optimized files and aggregated for faster reporting. This helps reduce database bloat on busy sites.
Which questions does Opti-Behavior help answer?
Most site owners already have traffic numbers. The hard part is understanding the human reason behind the numbers. Opti-Behavior helps answer practical conversion questions:
- Which parts of the page attract attention?
- Where do visitors hesitate or lose confidence?
- Which funnel step causes the biggest drop-off?
- Which form field creates too much effort?
- Which CTA, layout, product page, or message should be tested next?
- Are bots, spam, errors, or slow pages distorting your decisions?
How do I get support?
Free users can use the WordPress.org support forum. Pro users get priority support through OptiUser. Hotjar is a trademark of Hotjar Ltd. Microsoft and Clarity are trademarks of Microsoft Corporation. Opti-Behavior is not affiliated with or endorsed by them.
更新日志:
- New: Smart Insights "Things to check": page, funnel, engagement, scroll, mobile bounce and traffic spike cards now list the checks behind the problem, each one measured on your own data and shown as a compact card ("Not measured" when there is not enough traffic yet).
- New: Smart Insights cards have a clearer design: severity colour, key figures in tiles, a short story per signal family and a detail panel. Free users see every result Free computes.
- New: Spam filter: automated visits (headless browsers, scripts) are refused at collection and filtered from every report, even when they arrive with a referrer.
- New: Heatmap detail: hovering a click area shows "N clicks in this area" in the free plugin too, following the Count Bar Display setting. On small sites the Heatmaps list is up to date right away.
- New: The Pro feature pages (Recordings, User Journeys, Errors, Forms) explain what each feature does, with the trial button first. The Pro trial notice has a new design and can be closed for good.
- Changed: The per-audience segment breakdown and the Weekly CRO Summary are now part of Opti-Behavior Pro.
- Changed: "How it works": the lines from the active modules to Smart Insights are animated. A/B tests: a click goal that is not a CSS selector (an XPath, for example) is refused with a clear message.
- Security: Admin screens (Traffic browsers / referrers / top pages, Smart Insights, A/B test builder) now escape quotes in every value they display, so a crafted browser name, referrer or page title sent by a visitor can no longer run script in the admin. A leftover debug branch of the heatmap data endpoint was removed.
- Performance: wp-admin no longer waits when api.optiuser.com cannot be reached: the daily status message is sent in the background and the deactivation survey never holds the Deactivate click. Dashboard widget caches are cleared without heavy database queries.
- Fix: Same numbers everywhere: Traffic visitors, new / returning and Top Pages use one set of visits; Smart Insights, funnels and Page X-Ray count the same visits; Top Pages shows one row per page; the Heatmaps list and detail show the same click count.
- Fix: Smart Insights figures: each card shows the loss of its own gap (exit rate, scroll, segment vs all visitors), related cards never repeat the main card's figure, traffic spikes show no loss figure, and old figures are cleared on recalculation. A story card is never hidden as noise.
- Fix: Smart Insights: cards are regenerated once after each plugin update, the briefing stacks on phones, the Severity filter and severity sort work in every admin language, the Reset button appears with "All statuses", success messages stay visible, and the detail window moves keyboard focus.
- Fix: Traffic: "% vs last period" shows "—" when there is no previous period, an idle tab no longer inflates the visit duration, the Traffic Channel filter classifies visits exactly like the dashboard, and the review reminder only appears on the plugin's own screens.
- Fix: Heatmaps: Refresh now really clears the cached heatmap; deleting heatmap data keeps the device and type you were looking at; Reset puts the header period back to All time; switching views quickly never shows the previous view's numbers. Heatmaps taken over by URL query variants (?utm=…) are repaired and grouped like the list.
- Fix: Heatmaps list: a page number past the last page shows the last page; searching keeps your sort; the first click on a column sorts high to low.
- Fix: Funnels: editing a paused funnel keeps it paused, a deleted funnel cannot be saved back, a step without a URL is refused, the report of a paused funnel opens, a failed Re-scan no longer locks the button, and changing period quickly never shows the old numbers.
- Fix: A/B tests: "Declare Best Performer" no longer crowns a variant on a tie or without data. Numbers and dates follow your admin language. Filter profile labels are translatable. The onboarding popup sends its answer once.
- Fix: Heatmap image download — on long pages the downloaded PNG showed the clicks shifted and paler than the heatmap on screen. The image now shows every click exactly where the screen does, and very long pages no longer produce an empty image.
- Fix: With Opti-Behavior Pro on a renewed trial (or a licence bought after the trial), the red "Your Pro Trial Has Ended" banner could appear while Pro was working. It is no longer shown when the licence server confirms the licence is active.
- Fix: Smart Insights — "Visitor Confusion Pattern" now compares a page's button clicks with a site average in the same unit, and "quick visit" signals respect the minimum session duration of your spam filter.
- Fix: The code passes the WordPress.org Plugin Check without errors, and the plugin name is the same in the plugin list and on its WordPress.org page.
- Security: Hardening from the WordPress.org security review. Funnel events are tied to the visitor's own session cookie, so a public request can no longer report made-up sessions, and new funnel entries are limited per visitor IP. Forwarding headers (X-Forwarded-For, Client-IP, CF-Connecting-IP) are only trusted from Cloudflare or from a reverse proxy on your own network. Visitor IP addresses are never sent to a geolocation service before the visitor accepts the consent banner, and outbound geolocation lookups are limited per minute.
- Fix: Translation files no longer contain pieces of source code in their translator comments (a build tool copied them by mistake; security scanners reported them as suspicious). Translations are unchanged.
- Security: Fixed an unauthenticated stored cross-site scripting issue in the post analytics box and the dashboard (CVE-2026-95686, CVE-2026-95809, reported through Wordfence). Link addresses, referrers and location data sent by the public tracker are now validated before they are stored, the country name is always resolved by the server, values already stored are cleaned when they are read back, and every value is escaped before it is displayed. Update recommended.
- New: "How it works" page (was Roadmap): an animated view of the seven collectors feeding Smart Insights with your own numbers, the four-step loop, a first-days checklist, the Free and Pro modules, the latest release notes, the roadmap and support. Its "Setup check" card shows whether visits are received, whether a caching or optimization plugin blocks a tracker and whether your own visits are counted, with a button to fix each item.
- Fix: Spam filter — after saving the Traffic & Behavior thresholds, the spam recalculation could flag every session as spam ("few scrolls"), so "Exclude spam" hid all recordings, sessions and stats. The recalculation and the scheduled spam cleanup now read scrolls and clicks from the same sources as the rest of the plugin, and sessions wrongly flagged by 1.9.1 are re-checked automatically in the background after the update. Nothing to do on your side.
- Fix: A click on a cookie / consent banner no longer counts as a visitor click, so a visitor who only answered the banner is no longer counted as engaged when spam is excluded. Single-page visits are no longer counted as having at most one scroll.
- New: Admin menu in two groups: "Your data" (Traffic, Heatmaps, Recordings, Funnels, User Journeys, Errors Tracking, Forms), then "What to fix" (Smart Insights, A/B Testing). The Dashboard is now "Traffic", with a chart icon; its page is titled "Traffic Overview". The Smart Insights menu item pulses in the colour of your open problems: red = a Critical problem, yellow = High or Medium, green = nothing to fix. Nothing is computed on page load and nothing is added to the public site.
- New: Cookie preferences shortcode — paste
[opti_behavior_cookie_settings]into your Privacy or Cookie Policy page: visitors see their current choice and can change or withdraw it at any time (GDPR art. 7). Withdrawing removes the tracking cookies and identifiers immediately and tracking falls back to cookie-free anonymous mode.[opti_behavior_cookie_settings display="link"](or the CSS classob-consent-openon any link) reopens the banner instead. Settings → Privacy & GDPR. - Privacy: The visitor's consent choice is now remembered for 6 months by default (CNIL recommendation); 12 months remains available in Settings → Privacy & GDPR. When the choice expires or is refused, the identifiers stored under the earlier consent are removed from the browser. A/B tests in Full Tracking mode write the variant cookie only after the visitor accepts the consent banner; until then tests keep running cookie-free, exactly like Anonymous mode, and a visitor who accepts later keeps the variant already seen.
- New: Smart Insights "How it works" strip: what each module sent over the period, then what was found, fixed and confirmed.
- New: Page X-Ray, the per-page report of Smart Insights, is part of Opti-Behavior Pro. In the free version the "Page X-Ray" tab shows a lock and a PRO badge, what the tab does and an example report; the "Dossier" button of the heatmap list carries the same lock.
- New: Two one-time messages, on Opti-Behavior screens only: 2 days after installation, if your own visits are still counted, an offer to exclude them; after an update, a note that the menu changed, with a link to the guide. The welcome popup now ends on the "How it works" page, and the welcome screen and popup say "Smart Insights" (was "AI Insights").
- Changed: Smart Insights cards are more reliable. Confidence comes from the number of visits measured (a 65-visit card is Medium at most) and Critical must be earned: enough visits measured, High confidence and a loss that matters on this site. Cards with the same numbers get the same priority, "Worse" / "Better" needs a real change, site-wide cards no longer read "Observation on 0 sessions", cards with identical data are merged into one, and a "Provisional · N visits" badge marks cards built on few visits.
- Changed: Funnel drop-off cards name the step visitors leave ("between Product and Cart, 60 of 90 visitors leave"), count visits instead of tracking rows, need two steps and 50 visits, show a "Where visitors leave" step bar and open the funnel on that step. The end-to-end drop rule, true of almost every funnel, is gone, and the Funnels page warns when two funnels track the same steps.
- Changed: Smart Insights money figures are real: an amount "at risk" is shown only for a funnel that ends at the checkout (with at least 20 orders over the period) or for a form priced with your own value of a conversion. Content funnels, errors, slow pages and engagement drops show the visitors they lose instead of a dollar figure, and amounts computed by the previous rule are no longer displayed.
- Changed: Insight details say each thing once, show "Things to check" when nothing was measured, show no lift range without a published source, and show the "Result" of a resolved card (before, after, verdict or the day the measurement ends). Cards the new rules no longer confirm close as "Closed: rule updated" and never count as resolved.
- Changed: Heatmap page: each device button shows its icon above the number and keeps the same width whatever the number (12 k above 9 999, exact number on hover); Views, Clicks and Avg Time sit on the same row as the heatmap types.
- Fix: Smart Insights: a custom date range that ends before it starts shows a clear message; the notification panel no longer lists locked Pro previews one by one and no longer covers the buttons of the A/B test wizard; high bounce and low scroll cards use one rule (30 visits, same limits, same comparison with the site average).
- Fix: Heatmaps: the background tasks no longer schedule the same hourly job twice or queue pages without an ID again and again, and the action buttons of the heatmap list no longer overlap the "Last Updated" column.
- Fix: Danger Zone: "Heatmap Data" now counts and deletes the archived heatmaps too, deleting Smart Insights resets the menu colour at once, and a reset is recorded in Cleanup History. Cleanup History folds repeated runs that deleted nothing into one entry and only says "deleted" when something was deleted.
- Fix: Funnels: a link to a funnel opens the list page that contains it, and the suggestions panel keeps both display choices when they are clicked quickly.
- Fix: Dashboard: the real-time visitors globe shows again for visitors without a country, instead of a raw code snippet, and the User Intent card no longer shows rows of zeros above its empty state.
- Fix: Translations: Smart Insights is fully translated (spam filter button, one label per category), the plugin's own admin language now also applies to Smart Insights and Forms, the deactivation survey and about 100 Portuguese strings carry their accents, and every new string is translated in French, German, Spanish, Italian and Portuguese.
- Feature: Heatmaps only where they matter — recorded for posts, pages, products, home and shop; tag, category, author, date, search and paginated archives no longer create one heatmap per URL. Existing archive-page heatmaps are archived in the background and can be restored in one click (Settings → Data Collection).
- Feature: Database size caps — optional global and per-table caps (Data Retention → Advanced). Oldest raw rows go first; the last 7 days and dashboard summaries are always kept.
- Feature: Cleanup Tasks — "Run all now", plus two new tasks: "Database size cap" and "Database schema upkeep".
- Changed: Page speed — frontend trackers are minified and loaded with
defer: nothing blocks rendering, tracker weight drops by about half. Tracking behaviour is unchanged. - Changed: Smaller database — the heatmap events table is up to 10x smaller, duplicate indexes are dropped automatically, and all tables use InnoDB (older MyISAM tables are converted in the background).
- Changed: Tables shared with Opti-Behavior Pro are now defined once, in Free. Both plugins can be updated in any order without data loss.
- Changed: Funnels page — Suggested Funnels comes first when you have no funnels; your funnel list leads once you do.
- Changed: Clearer data-retention summary, WP-Cron hint under Settings → Reports, and all new strings translated in French, German, Spanish, Italian and Portuguese.
- Changed: Passes the WordPress.org Plugin Check with no errors and no warnings.
- Fix: Server stability on busy sites — cache sweeps on
wp_optionsno longer cause "Lock wait timeout exceeded"; the realtime "Active visitors" widget uses an indexed query and polls every 15 s; heatmap files are written atomically under a per-page lock; daily database upkeep is size-capped. - Fix:
Duplicate entry … for key PRIMARYon the visitors table when two first hits raced. - Fix: Cleanup now respects every retention window — heatmap files, recording side files, archived heatmap data, bot visit logs, error summaries and 404 reports no longer grow without limit.
- Fix: Dashboard CSV export no longer leaves a temporary file behind; the archive-page cleanup "Configure" link opens the right tab.
- Feature: Smart Insights v2 — insights are ranked by measured cost (the visitors and conversions actually lost, blended with severity and confidence) and labelled Critical/High/Medium/Low by rank inside the batch, so a busy site gets a short ordered shortlist instead of dozens of "high priority" items. Thinly observed signals are flagged as observations to confirm instead of being promoted.
- Feature: Business impact in money — when a value per conversion is known, cards and the detail modal show the exposure ("≈ $1,240 at risk this period") with the drop-off count, conversion rate and order value behind it. A new "Value of one conversion" setting covers sites without readable WooCommerce order history; WooCommerce data takes precedence.
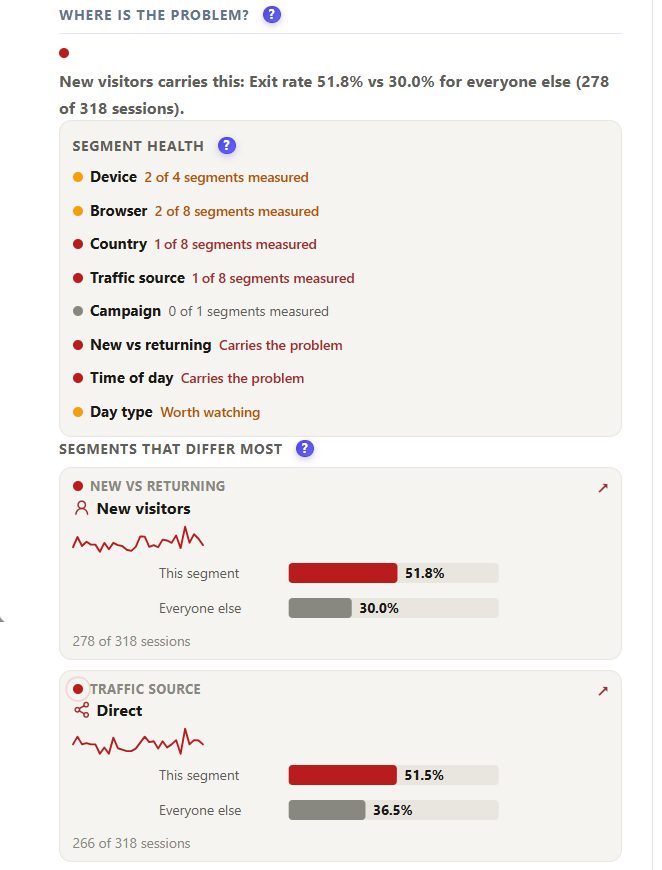
- Feature: "Where is the problem?" — every insight now names the audience carrying it. The segment split is computed on the real behaviour tables across 8 dimensions (device, browser, country, traffic source, campaign, new vs returning, time of day, day type) with a significance test, comparison bars you can click to re-scope the evidence, and a daily chart of the metric with the previous period behind it and a "first detected" marker.
- Feature: Outcome verification — resolving an insight freezes its "before" measurement and a daily job re-measures the same signal over the two weeks that follow. Resolved cards carry a "Fixed — → " chip, the weekly brief gained a "Wins this month" block, and the CSV export gained
outcome_verdictandoutcome_changecolumns. Too little post-fix traffic stores an honestinconclusiveverdict instead of a win. - Feature: Automatic funnel creation — Opti-Behavior detects what kind of site you run (WooCommerce, Easy Digital Downloads, blog/content, lead generation, signup, membership, LMS, booking) and suggests ready-made funnels on the Funnels page, with one-click creation, a "Set up recommended funnels" bulk action, and a "Customize" path that opens the normal builder pre-filled.
- Feature: Suggested funnel steps resolve their URLs through each source plugin's own API, so localized slugs (
/panier/,/commander/,/kasse/) are used as-is. Funnels record where they came from (source/recipe_id) so re-scanning never creates duplicates, and a "Re-scan site" button plus a per-card Dismiss keep the list under your control. Newopti_behavior_funnel_site_context,opti_behavior_funnel_recipesandopti_behavior_funnel_recipe_stepsfilters and anopti_behavior_funnel_createdaction for developers. - Feature: With Opti-Behavior Pro, a funnel created from a suggestion is backfilled from your existing session history so it opens with real numbers, alongside Pro-tier recipes, data-driven "discovered" funnels and a weekly automatic re-scan.
- Changed: The insight detail modal is readable again — it lists only the reports you can actually open (the rest collapse behind one line), caps recommended actions at three and reconciles their wording against those reports, shows the measured probe-ranked causes with their values, and drops the empty placeholder sections. Traffic-source insights of the same signal collapse into a single list card, and the weekly CRO summary opens with the three costliest issues instead of a count.
- Changed: Smart Insights opens on Last 3 Months by default (new period option), and the Suggested Funnels panel collapses to a one-line summary ("2 new · 8 created") once you have funnels.
- Changed: Scheduled cleanup no longer stalls on spam-heavy sites. Spam, bot and automated sessions are an exempt class the daily tier purges unconditionally within its per-run cap, the mass-delete safety limit is measured on the non-spam rules against the non-spam session count only, and a tripped limit produces a logged partial run instead of cancelling the whole run. New
opti_behavior_cleanup_spam_bypasses_safety_limitescape hatch, and Cleanup History collapses repeated identical entries. - Changed: Scheduled cleanup "Maximum sessions per run" default raised from 5000 to 50000 — installs still on the old default are migrated once, custom values are preserved.
- Changed: All funnel and user-journey admin messages are translatable; all 5 locale catalogs were refreshed.
- Fix: Report links now arrive already filtered. Opening a report from an insight used to land on an unfiltered view: the Analytics dashboard applies the incoming device, browser, country, OS, traffic source, campaign, medium, channel, visitor-type and entry/exit-page parameters to its first data request, funnel links open the funnel they name on the window the insight was measured on, internal segment keys are decoded to the values the reports really filter on, and device values match regardless of case.
- Fix: Concurrent first-visit tracking requests could return HTTP 500 through a visitor/session insert race.
- Fix: Previous-period trends were empty on every insight — the previous window inherited the current window's minimum-sessions filter, device insights were never given a previous period, and Pro-produced error, form and segment insights were skipped entirely.
- Fix: Funnel insights offered no session recordings and site-wide error or friction insights were collapsed as "not applicable"; both now open the exact scope they were measured on.
- Fix: "Direct" was missing from the Form Analytics referrer filter options.
- Fix: Heatmap detail applies a desktop viewport floor, so a narrow reference width no longer selects a mobile or tablet breakpoint.
- Fix: "Could not load funnel suggestions" on busy, memory-constrained hosts — funnel requests now raise the admin memory limit like the rest of the admin, and the suggestions panel retries its first load once.
- Added: Filter Profiles — save a named set of advanced-filter values (Visitor, Session, Pages & Traffic, UTM) and reuse it across the Analytics Dashboard, Funnels, and Pro screens. Save / Edit control sits next to Apply / Reset; date range is never stored.
- Added: configurable cache purge after funnel modification. New Funnels setting to purge all page caches on every save/delete/status change (default) or never. With "Never", cached pages keep the old funnel config until the cache expires. Per-mutation override via the new
opti_behavior_should_purge_cachefilter (receives the action and funnel ID). - Added: schema parity for Pro's Error Tracking visitor filters. Error, friction, and performance tables now store visitor country; friction and performance also store OS. Existing rows are backfilled. Data-model change only — no free-side behavior change.
- Fixed: cached-page visitor merging — anonymous visitor and session IDs baked into cached HTML made every direct visitor count as one visitor in one session. Identity is now recomputed server-side on each (uncached) tracking request, preserving cookieless privacy.
- Fixed: cached-page traffic under-counting — a stale baked nonce caused bounce visits to go unrecorded. The page-view/session-start request now re-sends once with the fresh nonce, and click batches queued during a refresh are preserved.
- Fixed: cached-page funnel under-counting — with two or more active funnels, a stale nonce silently dropped every step past the first. Funnel tracking now refreshes the nonce once and re-sends each step.
- Changed: lockstep release keeping free and Pro version numbers in sync with Pro's Error Tracking filter enhancement. Free-side change is limited to a shared filter-ui stylesheet sync.
- New: re-architected, user-configurable data retention — set your own tiered retention periods so the plugin auto-manages storage, keeps the database lean and stops resource/space bloat, all from a rebuilt Smart Cleanup screen.
- New: visitor-segment filtering — slice dashboard stats and every heatmap page by visitor type and attributes, so you can read behavior per segment.
- Enhancement: heatmap list and detail pages now scale to 500K+ recording files, with faster heatmap table loading on large datasets.
- Fixed: heatmap session totals are now consistent across the list, filters and detail page (the reset floor is applied everywhere).
- Enhancement: redesigned heatmap detail page — filter option counts scoped to the hero session set, detail date inputs synced with the presets, and a more compact stats layout.
- Enhancement: never-synced pages are merged into the heatmap fast path instead of forcing a full scan.
- Fixed: cache poisoning — bot and IP exclusion moved from asset enqueue to data ingest, so cached pages no longer skew stats.
- Fixed: session-duration over-accumulation and spam-excluded average session time.
- Fixed: A/B variant filters are treated as advanced result filters, and stale/under-counted filter options under A/B variant scope are corrected.
- Enhancement: simplified the sessions pill tooltip to single-number semantics.
- Enhancement: Top Pages widget redesigned with a stacked layout; the Top Engaged Users table now fills the widget height instead of a fixed 380px cap.
- Fixed: on large sites, upgrading could make the site unreachable — heavy database migrations and index builds now run in the background (one step per cron tick, resumable), never in a web or AJAX request.
- Enhancement: the storage stats tab now loads asynchronously to stop long blank-page waits.
- Enhancement: debug mode auto-disables after 3 hours and debug JavaScript is no longer loaded when debug is off.
- Fixed: the Admin Language setting had no effect on WordPress 6.7+ — translations now load through WordPress's standard pipeline, with a new "Same as WordPress" default, and all locale catalogs were refreshed.
- Fix: Bug in the last update that stopped the plugin.
- New: Interactive heatmap preview — click to expand accordions, menus, popups and other collapsed elements directly inside the preview, with clicks anchored to their element and redrawn correctly as it's shown/hidden. Preview now also renders at the selected device's real viewport width (mobile/tablet/desktop), so heatmaps match the actual responsive layout.
- New: IP exclusion setting to exclude specified addresses from tracking.
- Fix: Guest preview iframe AJAX/REST requests failed nonce checks by running with admin cookies instead of the guest context.
- Enhancement: Tracker assets are cache-busted/versioned with the plugin version, and the anon broker script is registered in the optimizer-compat registry so cache/optimizer plugins never delay it.
- Enhancement: Filter-bar buttons on the heatmap page aligned to filter select height; "All devices" view reprojects anchored clicks onto the current layout for consistent hotspots.
- Smart Insights now show when each signal was detected (relative time with exact date on hover), and saving Traffic Classification settings no longer resets "Track admin users".
- Major cache/optimizer compatibility release: unified exclusion layer, early-click capture queue, tracker heartbeat warning, A/B nonce auto-refresh and retries, funnel exact-match and analytics fixes, and ~90% fewer admin-ajax requests.
- Analytics dashboard and Heatmaps performance rebuild for large sites (parallel cached widgets, collapsible sections, indexed heatmap aggregates) plus a User Intent classification fix.