Pie and Donut charts
| 开发者 | varunkatyal |
|---|---|
| 更新时间 | 2020年8月6日 15:10 |
| WordPress版本: | 5.4.2 |
| 版权: | GPLv2 or later |
| 版权网址: | 版权信息 |
详情介绍:
Make interactive pie charts using chart.js library using:
- Simple short code
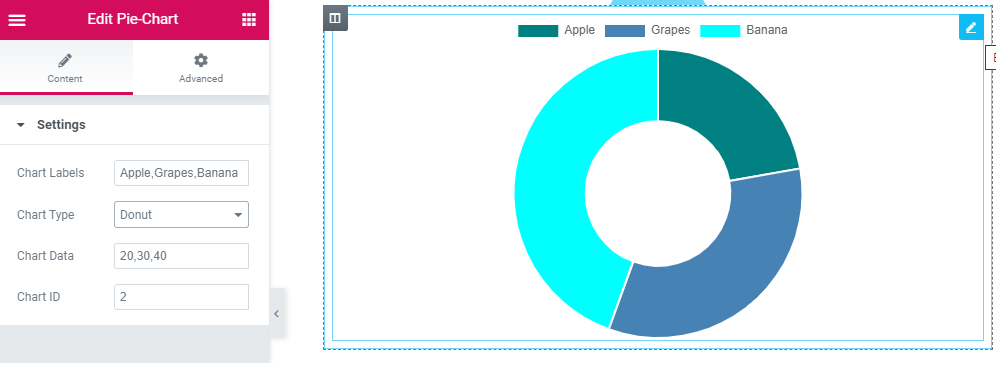
- Elementor Widget Pie Chart
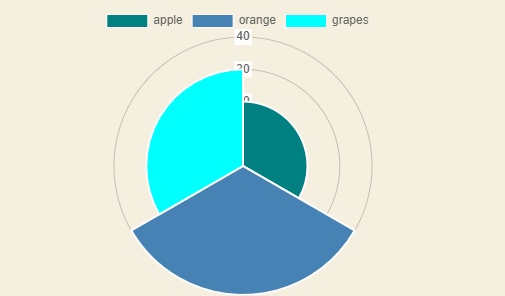
- [piechart id = '23' data = '20,40,30' label = 'apple,orange,grapes' type = 'polarArea']
- [piechart id = '24' data = '20,40,30,60' label = 'apple,orange,grapes,cherry' type = 'pie']
- [piechart id = '25' data = '20,40,30,60' label = 'apple,orange,grapes,cherry' type = 'doughnut']
- 100% Responsive and interactive
- Use anywhere in post and pages.
- Write or Create simple short code.
- Elementor Widget for live editing of charts
- Using Open source chart.js Javascript Library
- For multiple charts on same page, use unique id/chart id
- Canvas based charts
- Shortcode requires 4 parameters. 1) id 2) data 3) label 4) type
- "type" paratmeter can be either 1) pie 2) doughnut 3) polarArea
安装:
Method 1:
On your WordPress admin dashboard
Visit ‘Plugins > Add New’
Search for ‘Pie and Donut Chart’ and install the plugin.
Activate ‘Pie and Donut Chart ’ from your Plugins page.
Method 2:
Download the plugin from WordPress.org repository
On your WordPress admin dashboard, go to ‘Plugins> Add New> Upload Plugin’.
Upload the downloaded plugin file (Pie-and-donut-Chart.zip) and click ‘Install Now’
Activate ‘Pie and Donut Chart’ from your Plugins page.
Once the plugin is activated, you can create charts through
shortcodes or through elementor widget(Pie Chart)
屏幕截图:
常见问题:
How can I generate a chart?
You can generate charts either through shortcodes or Elementor widget. Shortcode examples
- [piechart id = '23' data = '20,40,30' label = 'apple,orange,grapes' type = 'polarArea']
- [piechart id = '24' data = '20,40,30,60' label = 'apple,orange,grapes,cherry' type = 'pie']
- [piechart id = '25' data = '20,40,30,60' label = 'apple,orange,grapes,cherry' type = 'doughnut']
Can I display more than one chart on the same page?
Yes, you can create unlimited charts. Use unique id/chart ID for multiple charts on same page.
更新日志:
1.0.0
Initial Release