
Post Volume Stats
| 开发者 | shortdark |
|---|---|
| 更新时间 | 2020年6月13日 23:34 |
| 捐献地址: | 去捐款 |
| PHP版本: | 3.5 及以上 |
| WordPress版本: | 5.4.2 |
| 版权: | GPLv2 or later |
| 版权网址: | 版权信息 |
详情介绍:
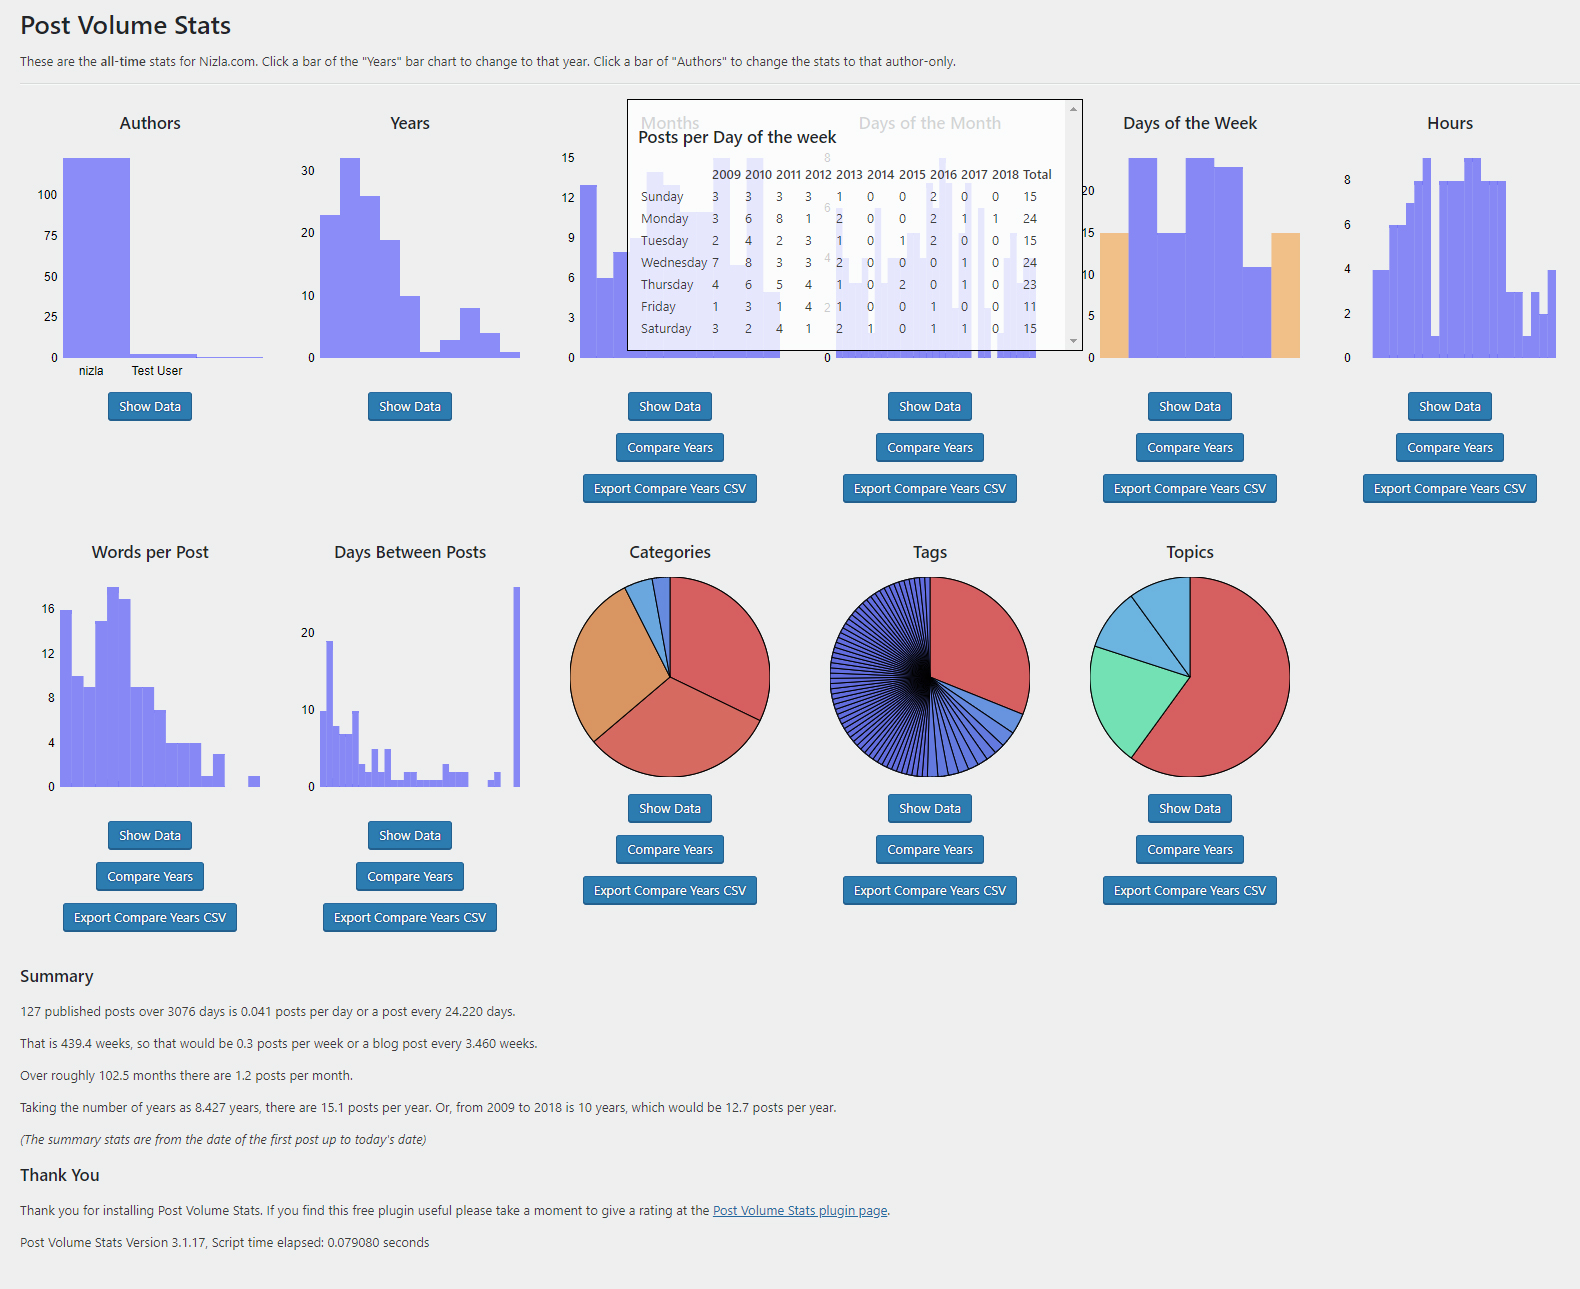
This plugin looks at the volume of posts in each category, tag, the volume of posts per year, month, day-of-the-month, day-of-the-week, hour, author, number of words-per-post and the number of days between posts. You can specify a year and/or an author to just look at the post volume stats for that year/author. The bar and pie charts can be added to a sidebar with Post Volume Stats widget. Lists and line graphs can be exported to a new post to show the change in category, tag and custom taxonomy posts over the years. You can also export the "Compare Years" data into a CSV spreadsheet. The latest feature is the "Date Range" page which applies a date range to the data on the main page.
Please let me know if you like this plugin by leaving a review.
Go to the Post Volume Stats website for more information.
Translations
You can translate Post Volume Stats on translate.wordpress.org.
安装:
This section describes how to install the plugin and get it working.
- Upload the plugin folder to the
/wp-content/plugins/directory, or install the plugin through the WordPress plugins screen directly. - Activate the plugin through the 'Plugins' screen in WordPress.
- The menu item "Post Volume Stats" should now be in your admin menu and the "Post Volume Stats" widget should also be available to use.
屏幕截图:
更新日志:
3.3.01
- NEW: Date Range page renamed Filter Results and you can now filter the main page charts by text in the post content.
- NEW: Footer method created and is now added to every page.
- FIX: Fix to work on older versions of PHP (e.g. 5.3.3), newer versions of PHP will have been fine.
- UPDATED: Refactored the array functions.
- NEW: Added "Comments per post" to the main page, must be added in the settings.
- FIX: Last update changed the way "Words per post" data was collected, fixed.
- FIX: "Images per post" was not working correctly on "compare years", fixed.
- UPDATED: More code tidy up.
- NEW: "Images per post" added to the main page. Beta feature, must be added in the settings.
- UPDATED: Modified the header text on the main page and tried to make clearer explanations on the different pages.
- FIX: Improved Words per post data capture method.
- "Date Range" now working for all bar charts, pie charts and lists on main page. The "Years" bar chart, "Compare Years" and "Export Compare Years CSV" remain unaffected.
- CSV exports can now be the stats for a single user.
- Fixed bug where a selected user meant that it wasn't recognizing the selected year on "Days Between Posts".
- Made the "Show Data" and "Compare Years" titles more precise.
- Tidied up code, removed WordPress notices and general bugfix.
- Setting added to make max. interval between posts 30 to 80 days for "Days Between Posts". Longer intervals take longer to load in "Compare Years" table.
- Compare years added for "Days Between Posts".
- CSV export added for "Days Between Posts".
- "Words per Post" and "Days Between Posts" added to the widget.
- Fixed Custom Taxonomy page so that changing year no longer breaks the checkbox list.
- Fixed the color issue with the Custom Taxonomy pages.
- Fixed export bug with the Custom Taxonomy.
- Changed "Days Between Posts" to look at calendar dates only, not the time that posts were made.
- "Date Range" must be activated in the settings.
- Modified some wording.
- Tidied Date Range page.
- Added explanation to Date Range: this page is experimental, please use the year select on the other pages.
- Added "Days Between Posts" to the main page.
- Fixed bug where sometimes the volume of posts can be a non integer.
- Added link to the Settings page from the main WordPress Plugins page.
- More Date Range fields added (beta).
- Fixed with line graph axes (tags, categories and custom taxonomy).
- Added "Date Range" page.
- Problems related to the version number.
- Added CSV downloads to category, tag and custom taxonomies.
- Multiple custom taxonomies are now able to be shown at the same time.
- Trimmed empty columns from the end of "words per post".
- Fixed "year" bug on the widget.
- Added option to have white text on the widget.
- Security fix made beta CSV download stop working, so this is a different fix.
- Security fix on beta CSV downloads.
- Updated PVS version number on the pages.
- "Words per post" should give a better distribution of the posts.
- Beta for CSV export added.
- Bug fixes on words per post.
- Minor bug fixes on the author and years bar charts.
- You can now compare years for some of the bar charts - shows data for all years in one table that can be copy/pasted into a spreadsheet.
- Words per post bar chart added.
- Custom Taxonomy bar chart added to the main page (must be selected on the Settings page).
- "Authors" data is now "Authors" or higher, "Contributors" are not included in the Authors data.
- Optional link in the Admin Toolbar, activated on the Settings page.
- Version number added to page footers.
- Bug fixing and streamlining.
- Custom taxonomy page added (must be selected on the Settings page).
- Updated description and POT file.
- You can now click a bar of the "Authors" barchart to filter the stats to that author.
- Settings page: turn off authors bar chart, turn off rainbow lists and week starts on.
- Updated description and POT file.
- Added more summary text stats to the bottom of the main page.
- Highlighted weekends on the "posts per day-of-the-week" bar chart.
- Added "Authors" bar chart.
- Added pie charts to Widget.
- Added links to the line graphs.
- Fixed bug on line graph for blogs with only one year of posts.
- Tidied and simplified tag/category pages.
- You can now choose whether to export line graph, list or both.
- Added plugin link to bottom of exported results.
- Line graphs improved and also able to be exported with the lists.
- Matching color applied to the export lists.
- Re-structured tag/category pages and removed the pie charts.
- Admin notices added.
- Line graph added to tags/categories pages.
- Improved the colors in the pie charts.
- Reverted back to having the preview, then from the preview you can "Export" into post.
- Changed from "Show HTML" to "Export" into post.
- One more debug notice fixed.
- Tidied debug notices.
- Fixed bug on exports.
- Added "load_plugin_textdomain".
- Tidied "export" method to reduce script time elapsed.
- Updated readme.txt with "translations" info.
- Widget screenshot.
- Minor changes.
- Wording fixed.
- Duplicate methods merged.
- Updated version of WordPress.
- Bug-fix.
- Widget added.
- Updated version numbers to re-load scripts and bug-fix.
- Export "Categories" data to HTML.
- Export "Tags" data to HTML.
- Bug fix - allowed top line of bar chart if it is on the boundary of the chart.
- I18n improvements.
- Added "Category" and "Tag" admin subpages.
- Tidied.
- Bug fixes.
- Added lines and legends to the bar charts.
- Brought the lists back for the bar charts.
- Tidied code.
- Cosmetic changes.
- Removed submit button from year dropdown used 'onchange' to submit instead.
- You can now also select a year by clicking a bar of the 'Years' graph.
- Updated the version number because some older versions were not updating.
- Made sure categories should be working correctly.
- Prevented direct access to class files.
- Fixed bug with yearly tags.
- When a year is selected it applies to all stats now, including tags and categories.
- Changed pie chart opacity rules.
- The year option setting moved from it's own page to the main plugin page.
- Settings page added for users to chose the year for all time-based stats.
- Modified the pie chart coloring
- Preparation for UI
- Modified layout
- Added posts per day info.
- Timed the script.
- Loaded external jQuery UI draggable the proper way using script-loader.php
- Limited the height of the lists to smaller than the height of the window
- Fixed the number of years bug on the years list
- Added JQuery UI.
- AJAX DIVs are now draggable.
- Updated readme.txt description.
- More text changed to translatable strings.
- "lists" moved out of the page and into AJAX DIVs with loading animation
- CSS loaded as a .css file, instead of in-line
- Months and days-of-the-month added.
- Removed jddayofweek completely as it was not working properly.
- Removed PHP function jddayofweek for PHP versions below 5.3 as was not working on 5.2.17
- Removed the Day of the Week section for PHP vesions below 5.3 as that part was not working on a 5.2 version of PHP.
- Removed the magic variable DIR that limited the plugin to PHP versions 5.3 and above.
- Changed the way the info is gathered, meaning that the year. Hour and day-of-week data should now be correct, whereas before it was incorrect.
- Re-ordered the data in the pie charts into size order.
- Added bar charts for day-of-the-week and hour-of-the-day.
- Simplified the CSS to allow for easy additional columns.
- Calculated the "requires at least" from the Wordpress functions used.
- Added the total number of posts in yearly column.
- More security.
- More OOP classes and split up into different files.
- Changed admin page type to "read" as it does not have any need for user input and does not do anything.
- Started changing to OOP.
- Tags added.