
Runners Log
| 开发者 |
frold
michaellasmanis TheRealEyeless |
|---|---|
| 更新时间 | 2018年8月16日 02:16 |
| 捐献地址: | 去捐款 |
| PHP版本: | 5.2.4 及以上 |
| WordPress版本: | 4.9.8 |
| 版权: | GPLv2 or later |
| 版权网址: | 版权信息 |
详情介绍:
This plugin let you convert your blog into a training log and let you track your activities. You get advance statistics and running related calculators. See screenshots.
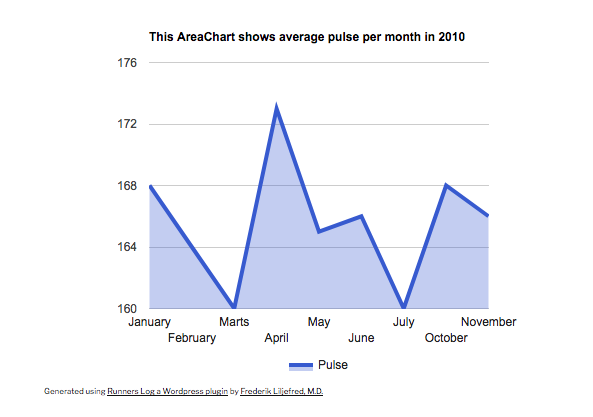
Track your distance, pulse, calories or time and get the graphs you want. We support area-, bar-, column-, line-, pie-, 3dpie-, donutpie-, scatter-graph or table. You can get data for a given month or a whole given year. See screenshots.
You'r able to use a variety of calculators; Training Zones Calculator, VDOT calculator, V02max-Calculator, Race Time Calculator, Training Pace Calculator, Body Mass Index Calculator, Calculate Predicted effect of change in weight.
You can add graphs using Google Chart see FAQ for howto use it.
安装:
This section describes how to install the plugin and get it working.
- Copy all files to
/wp-content/plugins/directory - Activate the plugin through the 'Plugins' menu in WordPress
- Use this short code
[runners_log_basic]in a post or page. Alternativly place this<?php if (function_exists(runners_log_basic)) echo runners_log_basic(); ?>in your templates to have basic statistics. It gives you data like: - Meters: 8500
- Time: 00:49:59
- Km/hour: 10.2
- Min/km: 05:52 minutes
- Puls average: 172 bpmis 86% of Max HR and 80% of HRR
- Calories: 654 C
- Garmin Connect Link: http://connect.garmin.com/activity/id
- 2009: 693.7 km based on 122 runs with an avg of 5.69 km
- 2010: 727.9 km based on 85 runs with an avg of 8.56 km
- 2011: 539.3 km based on 70 runs with an avg of 7.7 km
- 2012: 131.4 km based on 30 runs with an avg of 4.38 km
- 2013: 100.0 km based on 10 runs with an avg of 10.00 km
- At all: 2292.1 km based on 351 runs with an avg of 6.53 km
- ~embed garmin connect map~
- See FAQ to learn how to use the supported short codes.
屏幕截图:
更新日志:
1.0.0
- Initial Release
- Fixing Screenshots
- Fixing Screenshots again
- Fixing if ( category ID = 6 ) { and moved it to templates. This way its easier to upgrade Runners Log
- More info to readme.txt
- Optimazing code
- Added 2010 to runners_log_basic()
- Added the number of run per year and avg per run like: Km in 2009: 693.7 km based on 122 runs with an avg of 5.69 km
- New runners_log_basic() screenshot
- In runners_log_bar_hours() runhours is rounded to 2 instead of 4 decimals
- The jared^ release
- Added WP version check
- Now check is $hms, $meters is empty or not
- Added GPL licens
- Changed all templates tags to include if function exist
- Update readme
- JA - Added support to hide/disable GarminConnectLink
- JA - Added Runners Log write panel for post screen
- JA - Started to add support for Miles
- FL - Ended Miles support
- FL - Added a new field called Calories
- FL - Added support to hide/disable Calories thanks to JA
- FL - Added runners_log_graphmini_calories(), runners_log_pie_calories(), runners_log_bar_calories()
- FL - Renamed runners_log_graphmini_km() to runners_log_graphmini_distance()
- FL - Renamed runners_log_pie_km() to runners_log_pie_distance()
- FL - Renamed runners_log_bar_km() to runners_log_bar_distance()
- FL - Database updater that rename the old custom fields to match the new one
- FL - New screenshots
- FL - Readme update
- FL - Added support to hide/disable Pulse Average
- FL - Added short codes support
- FL - Adding Runners Log to its own side box
- FL - New field in Admin: Resting Heart Rate
- FL - New field in Admin: Maximum Heart Rate
- FL - New field in Admin: Unit Type: Either metric or english
- FL - New field in Admin: Height: Either centimeters or feet+inch(es)
- FL - New field in Admin: Weight: Either kilograms or pounds
- FL - New field in Admin: Age
- FL - New field in Admin: Gender
- FL - Adding Graphs and Stats to Admin
- FL - Heart Rate Training Zone Calculator
- FL - Edit runnerslog_basic to show data like: Puls average: 162 is 81% of Max HR and 74% of HRR
- FL - Body Mass Index Calculator
- FL - Weight Change Effect Calculator
- FL - V02max Calculator
- FL - Training Pace Calculator
- FL - Moved calculators to a Includes folder
- FL - Fix spelling error in pulsavg: bpmis
- FL - Fixing unclosed
- tag in pulsavg in runners_log_basic
- FL - Tested up to: 2.9.2
- FL - Fixed bug reported by klojo and fixed by klojo. You are now able to use [runners_log_basic] twice.
- FL - Fixed some typos
- FL - Added Coverter Toolbox including: Calculate Speed, Calculate Race Time, Calculate Distance, Convert speed to min per distance
- FL - Fixed missing include of converter toolbox file
- ML - Stats page throws error with zero data http://wordpress.org/support/topic/367176?replies=3
- FL - Wordpress 3.0 validated
- FL - runnerslog_admin.php spell checking and more
- FL - Includes/runnerslog_stats_graphs.php minor spelling fixes
- FL - Includes/runnerslog_training_zones.php fixed Heart Rate Training Zones (Elite)
- FL - Includes/runnerslog_v02mac.php minor style changes
- FL - Includes/runnerslog_vdot_race_time.php minor spelling fixes
- FL - Includes/runnerslog_vdot_training_pace.php minor spelling fixes
- FL - Includes/runnerslog_body_mass_index.php minor spelling fixes and style changes
- FL - Includes/runnerslog_weight_change_effect.php minor style changes
- FL - Includes/runnerslog_converter_toolbox fixed to remember data i all fields
- FL - Added settings for [runners_log_basic] Now you can set what to show
- FL - Pulse spelling error in [runners_log_basic]
- FL - Added embed Garmin Connect map to [runners_log_basic] and you can enable or disable it
- FL - Added a new shortcode [runners_log_garminmap] which let you insert a embed map of you route. The map is based on the path in "Garmin Connect Link"
- FL - Added more options to the plugin control panel like a link to setting, FAQ, Support and a link to Share where you use this plugin
- FL - Added Km at all to [runners_log_basic]
- FL - Minor changes to runnerslog_metabox.php
- FL - Fixing minor bug in the bar-charts in runnerslog.php
- FL - By request by TheRealEyeless http://wordpress.org/support/topic/347464/page/2?replies=47 added a whole new tag [runners_log year="2010" month="May" type="pie"]. See FAQ for howto use it.
- FL - Added a Gear List Manager Based on Thomas Genin WP-Task-Manager v.1.2.
- TR - Weather support
- TR - [runners_log_weather] Using the meta-style like [runners_log_basic]
- FL - [runners_log_weather_footer] - to put the weather data in the footer of the post or page. Thanks to Weather Postin' Plugin By bigdawggi
- FL - Added 2011 support
- FL - Added Google Chart suppport. See Faq and Screenshots
- TR - Multilanguage support
- TR - German Language files
- FL - Danish Language files
- FL - English language fixes
- FL - tested with Wordpress 3.3
- FL - Roll back so we no longer supports multi language!
- FL - Added support for 2012: http://wordpress.org/support/topic/764998
- FL - Minor bug fixs regarding the old multilanguage function
- FL - Fixed bug in runnerslog_stats_graphs.php resulting in not printing all graphs
- FL - Fixed minor bug in running related calculators
- FL - Tested in WP 3.4
- FL - Tested in WP 3.5
- FL - Added support for 2013
- FL - Total recode of the graph shortcode and use of the newest Google Chart Code: https://developers.google.com/chart/interactive/docs/
- FL - Support the periode from 2013-2019 - a major needed support :)
- FL - QTag for the new chart function
- FL - [runnerslog] new tag for graphs
- FL - New Settings Icon DELETED
- FL - Weather function outdeted and deleted from this version and the shortcodes: [runners_log_weather], [runners_log_weather_footer]
- FL - pChart outdated and so are these shortcodes: [runners_log_graph], [runners_log_pie_distance], [runners_log_pie_hours], [runners_log_pie_calories], [runners_log_bar_distance], [runners_log_bar_hours], [runners_log_bar_calories], [runners_log_graphmini_distance], [runners_log_graphmini_hours], [runners_log_graphmini_calories]
- FL - Unittype runnerslog_unittype - make no sense as we have the runnerslog_distancetype
- FL - runnerslog_stats_graphs - as no need for that page - use the FAQ
- FL - minor fixed background, folders, icon