Simple Charts
| 开发者 |
jacksoggetto
supporthost |
|---|---|
| 更新时间 | 2023年4月30日 09:59 |
| PHP版本: | 5.0 及以上 |
| WordPress版本: | 6.2 |
| 版权: | GPLv2 or later |
| 版权网址: | 版权信息 |
详情介绍:
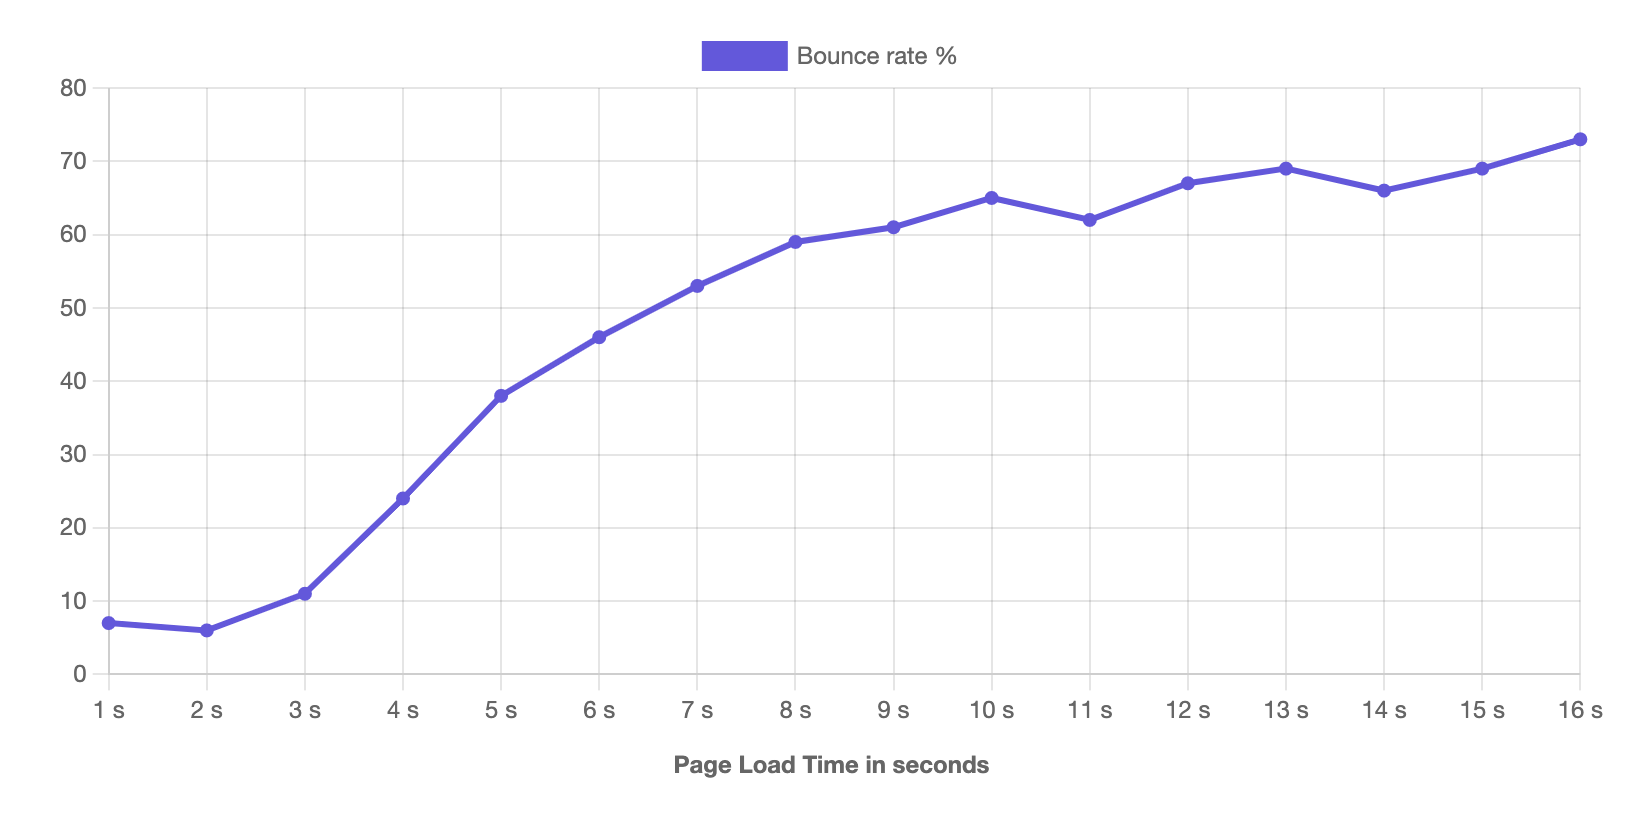
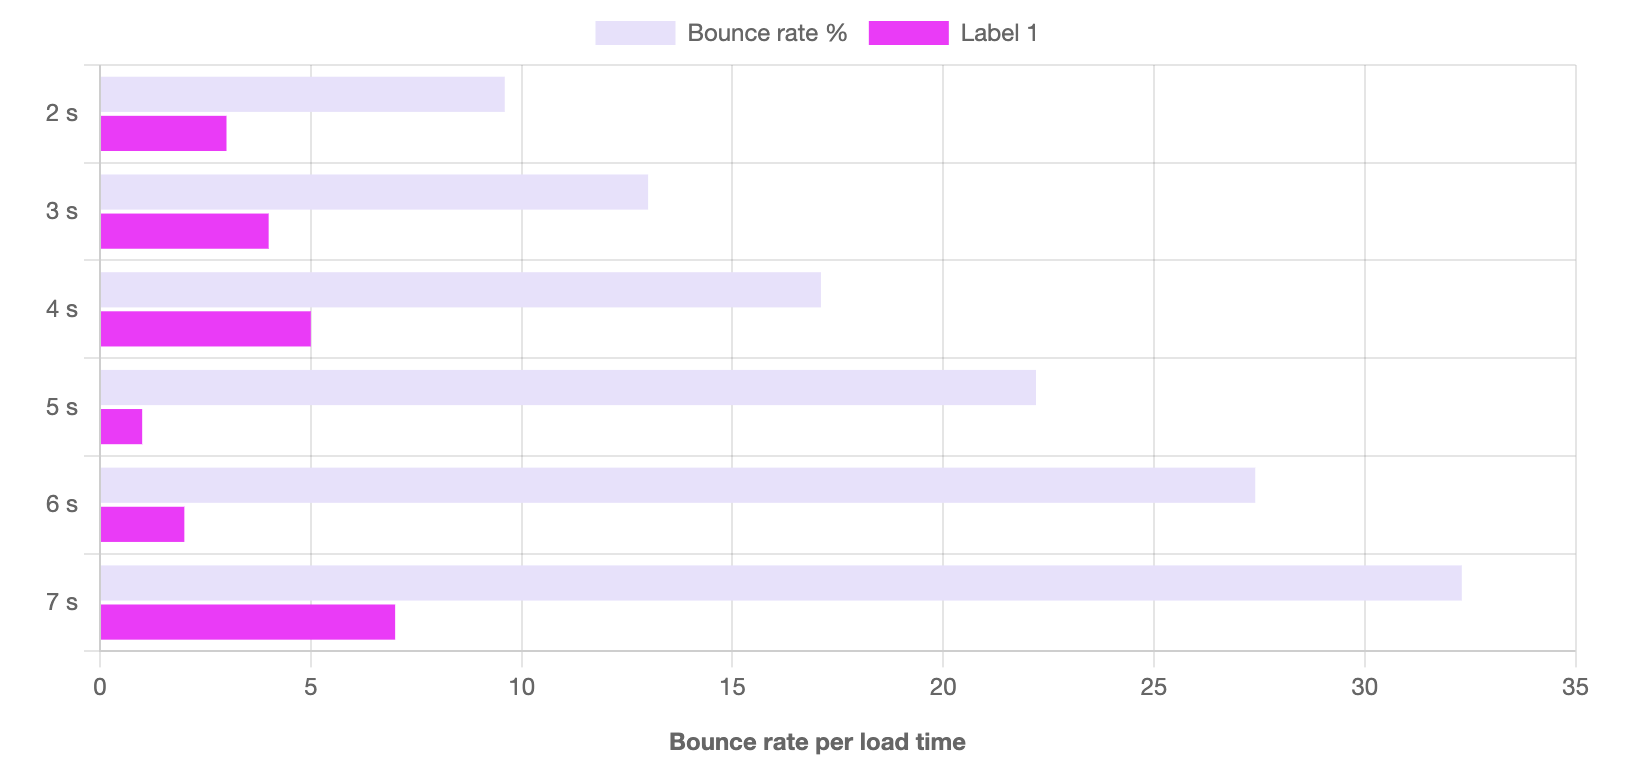
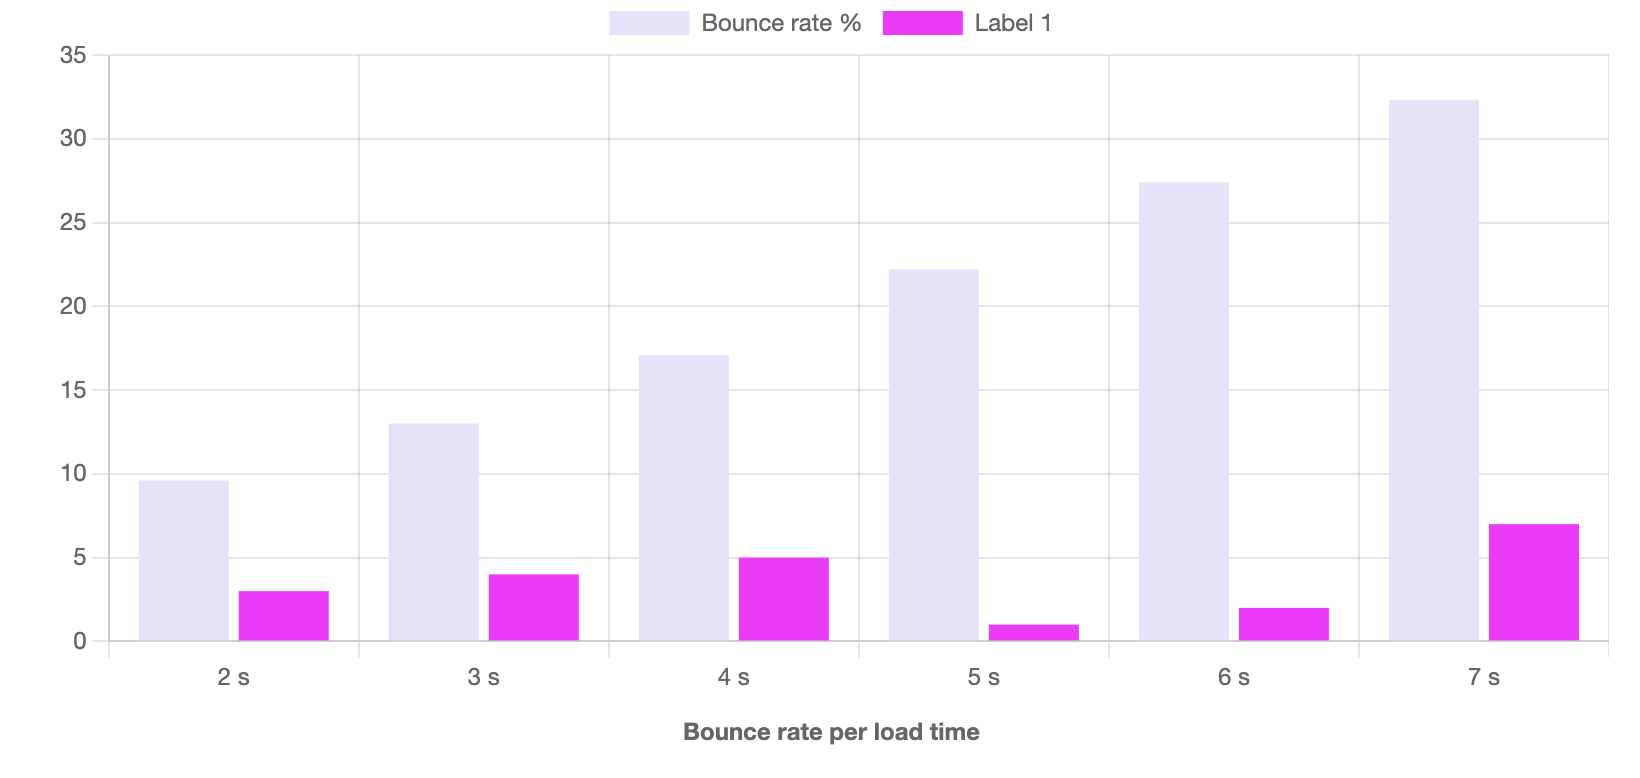
This plugin creates a shortcode you can use to embed charts anywhere inside WordPress. Just add the shortcode, add some options and you are done. You can see it in use on SupportHost website.
It loads only 1 javascript (chart.js) and only loads it on the page where you actually use the shortcode. It's so lightweight it won't impact the performances of your website at all.
Charts are created with chart.js, so you can hover them and read the data.
This simple charts plugin can be a good alternative for plugins like:
Usage
After the plugin is active, you can just add the shortcode to your pages or posts (or anywhere you can add a shortcode):
[simple_chart type="bar" name="mychart" labels="jan, feb, mar, apr" data="2,9,3,7" label="First series" color="#00ffff" border="#000fff" data_1="7,2,8,1" label_1="Second series" color_1="#000fff" border_1="#0ff00f"]
Shorcode parameters:
- type: you can decide the type of chart you want ot create. Optional, defaults to line. More on charts types below.
- name: Optional, must be unique per page.
- options: json of chart options as per chart.js docs. Make sure it's all in one line.
- labels: a list of comma separed labels.
- data: a list of comma separed numbers. You can create data_1 for the second serie, data_2 for the third and so on. Make sure you start from 1, otherwise it won't work.
- label: The label name for the serie. You can create label_1 for the second serie, label_2 for the third and so on. Optional, if left blank you will see "label_#"
- color: The color user for the serie. If empty will default to the chart.js pink. It is recommended to give each series its own color.
- border: The border color. If empty defaults to the color option. This is the minimum you can add in the shortcode to make it work: [simple_chart labels="Jan, Apr, Mar" data="2,9,3" ]
安装:
- Upload
easy-chartsto the/wp-content/plugins/directory - Activate the plugin through the 'Plugins' menu in WordPress
屏幕截图:
更新日志:
1.0.0
- Plugin released.


