SlyMetrics
| 开发者 | timonf |
|---|---|
| 更新时间 | 2026年5月1日 07:58 |
| PHP版本: | 7.4 及以上 |
| WordPress版本: | 7.0 |
| 版权: | MIT |
| 版权网址: | 版权信息 |
详情介绍:
- Prometheus Naming Compliance - All metrics follow Prometheus best practices with consistent naming
- Secure Authentication - Multiple authentication methods with encrypted token storage and rate limiting
- Comprehensive Metrics - WordPress users, posts, pages, plugins, themes, comments, categories, tags, and media
- Advanced Monitoring - WordPress version tracking, autoload performance, PHP configuration, database size
- MCP Integration - Expose metrics via the WordPress MCP Adapter as AI agent tools (WP 6.9+): metrics/get-summary, metrics/get-users, metrics/get-posts, metrics/get-plugins, metrics/get-site-health, metrics/get-content, metrics/get-storage, metrics/get-health-checks
- Site Health Integration - WordPress Site Health API integration for security and performance monitoring
- Directory Size Monitoring - Track uploads, themes, and plugins directory sizes with intelligent caching
- REST API Integration - Uses native WordPress REST API with enhanced security
- Performance Optimization - 3-tier caching system with lazy loading and memory optimization
- Enterprise Security - Input validation, SQL injection prevention, XSS protection, and security headers
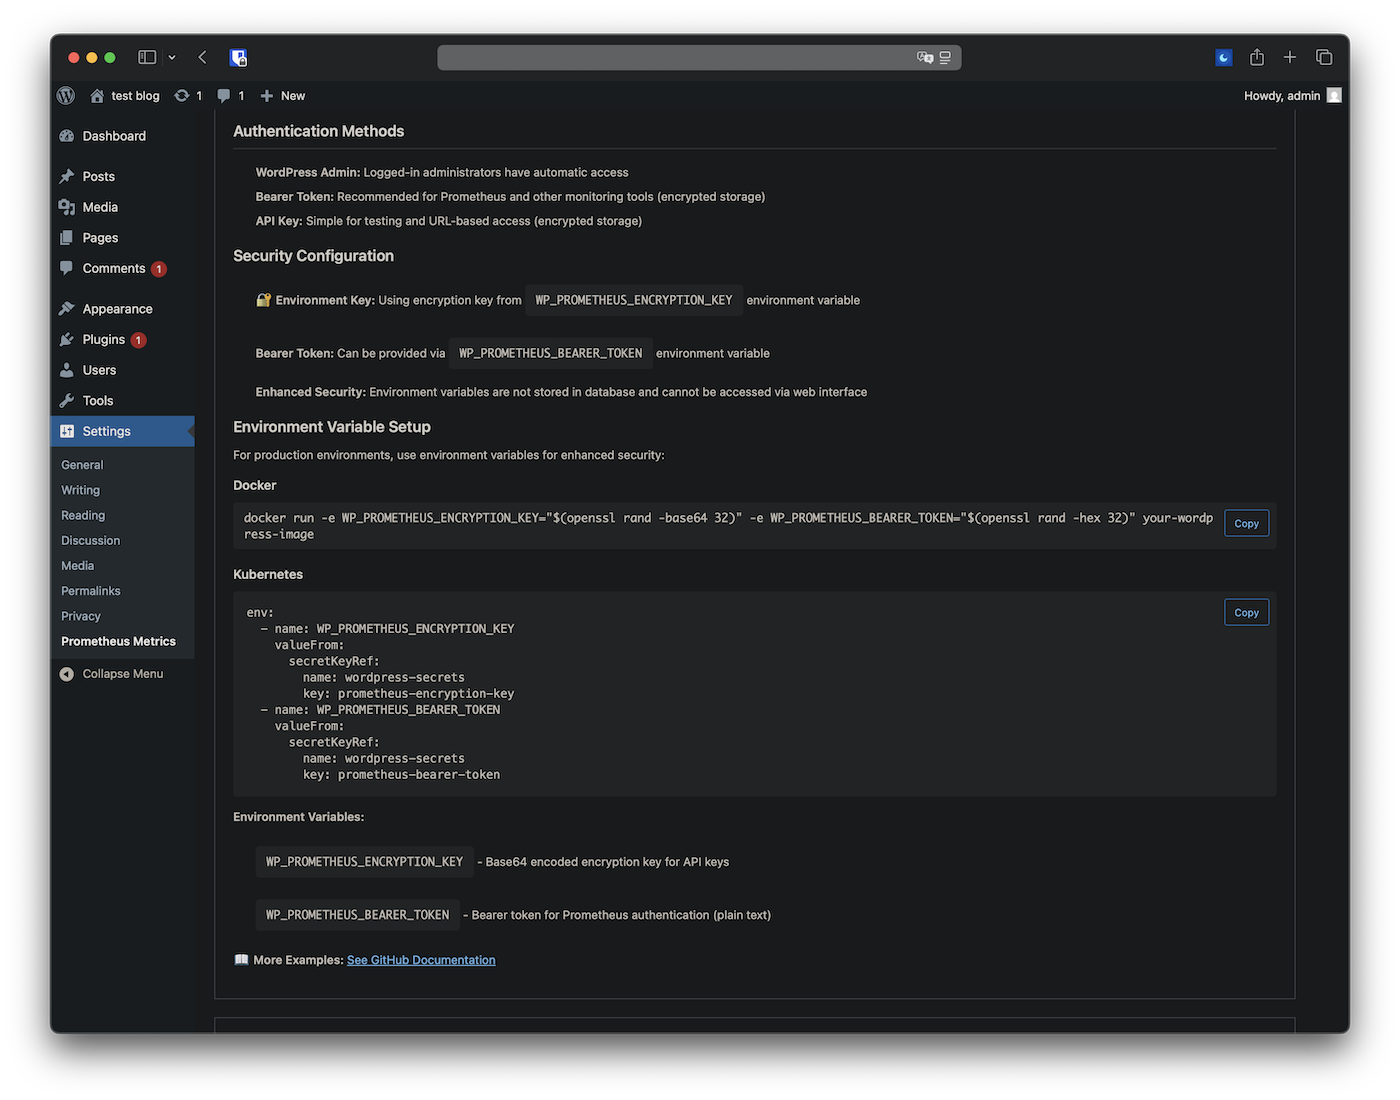
- Environment Variable Support - Enhanced security with external encryption key management
- Admin Interface - User-friendly settings page with token management
- Multi-Site Support - All metrics include site labels for multi-site filtering
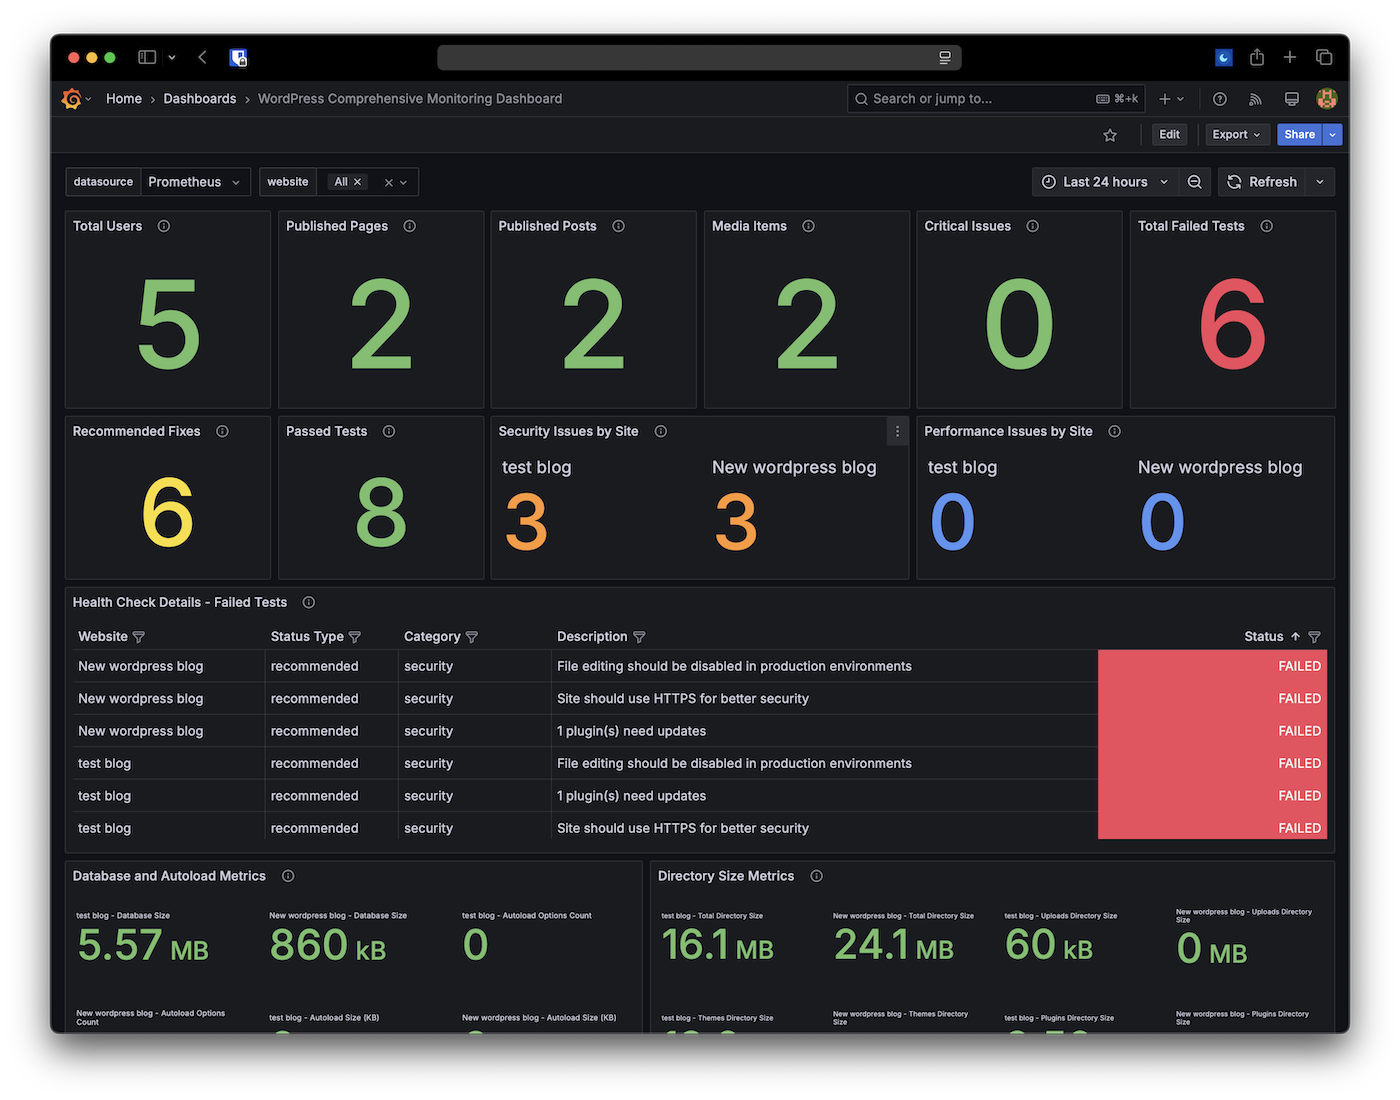
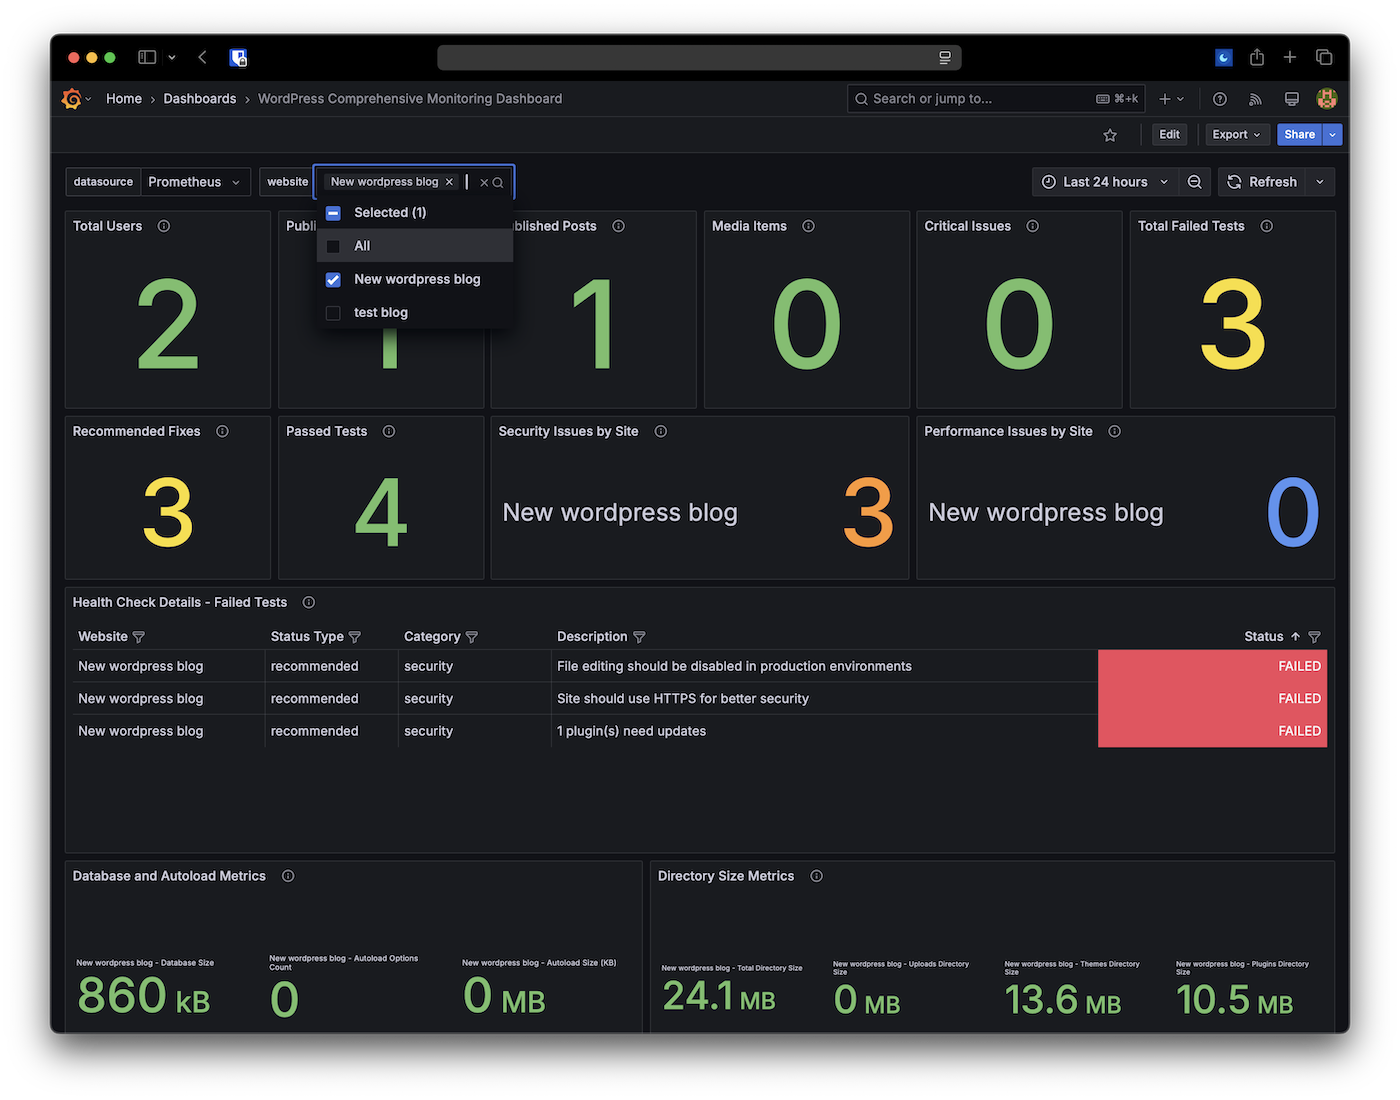
- Grafana Optimized - Display-friendly metrics specifically designed for clean table visualizations
- Clean URL Support - WordPress Rewrite API integration for /slybase/metrics endpoints
- Professional Code Quality - Enterprise-grade architecture with comprehensive error handling
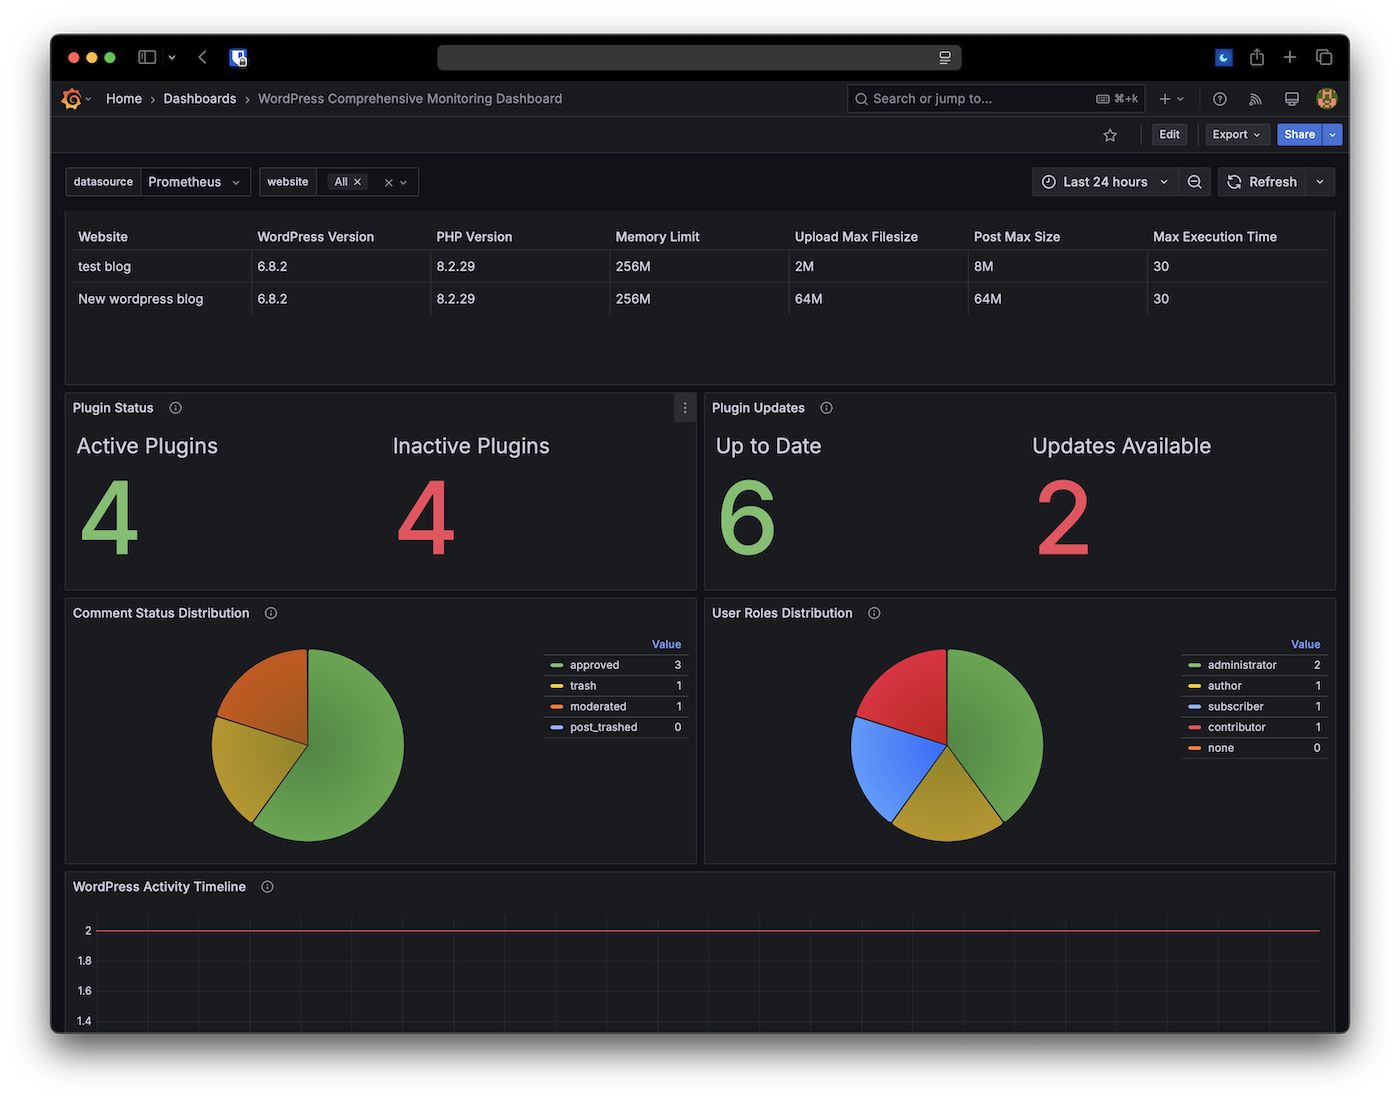
- User counts per role
- Post and page statistics by status
- Plugin and theme information
- Comment statistics
- WordPress version and update status
- Database and directory sizes
- PHP configuration details
- Site health check results
- Grafana-optimized display metrics for clean table visualizations
- Individual health check test results with detailed descriptions
- And much more...
- Bearer Token (Recommended)
- API Key (URL Parameter)
- WordPress Administrator (Automatic access for logged-in admins)
- AES-256-CBC encryption for token storage
- Environment variable support for encryption keys
- Secure random token generation
- Multiple fallback authentication methods
- Enterprise-grade input validation and sanitization
- Advanced SQL injection prevention
- XSS and CSRF protection with security headers
- Rate limiting with IP-based throttling
- Enhanced client IP detection with proxy support
- 3-tier intelligent caching strategy
- Lazy loading for heavy operations
- Memory-optimized data structures
- Database query optimization
- Segmented cache invalidation
- Background processing for directory scans
安装:
- In Wordpress: Install the plugin in the plugin section. Manual: Download and upload the plugin files to the
/wp-content/plugins/slymetrics/directory - Activate the plugin through the 'Plugins' screen in WordPress
- Navigate to 'Settings' → 'SlyMetrics' to configure authentication tokens
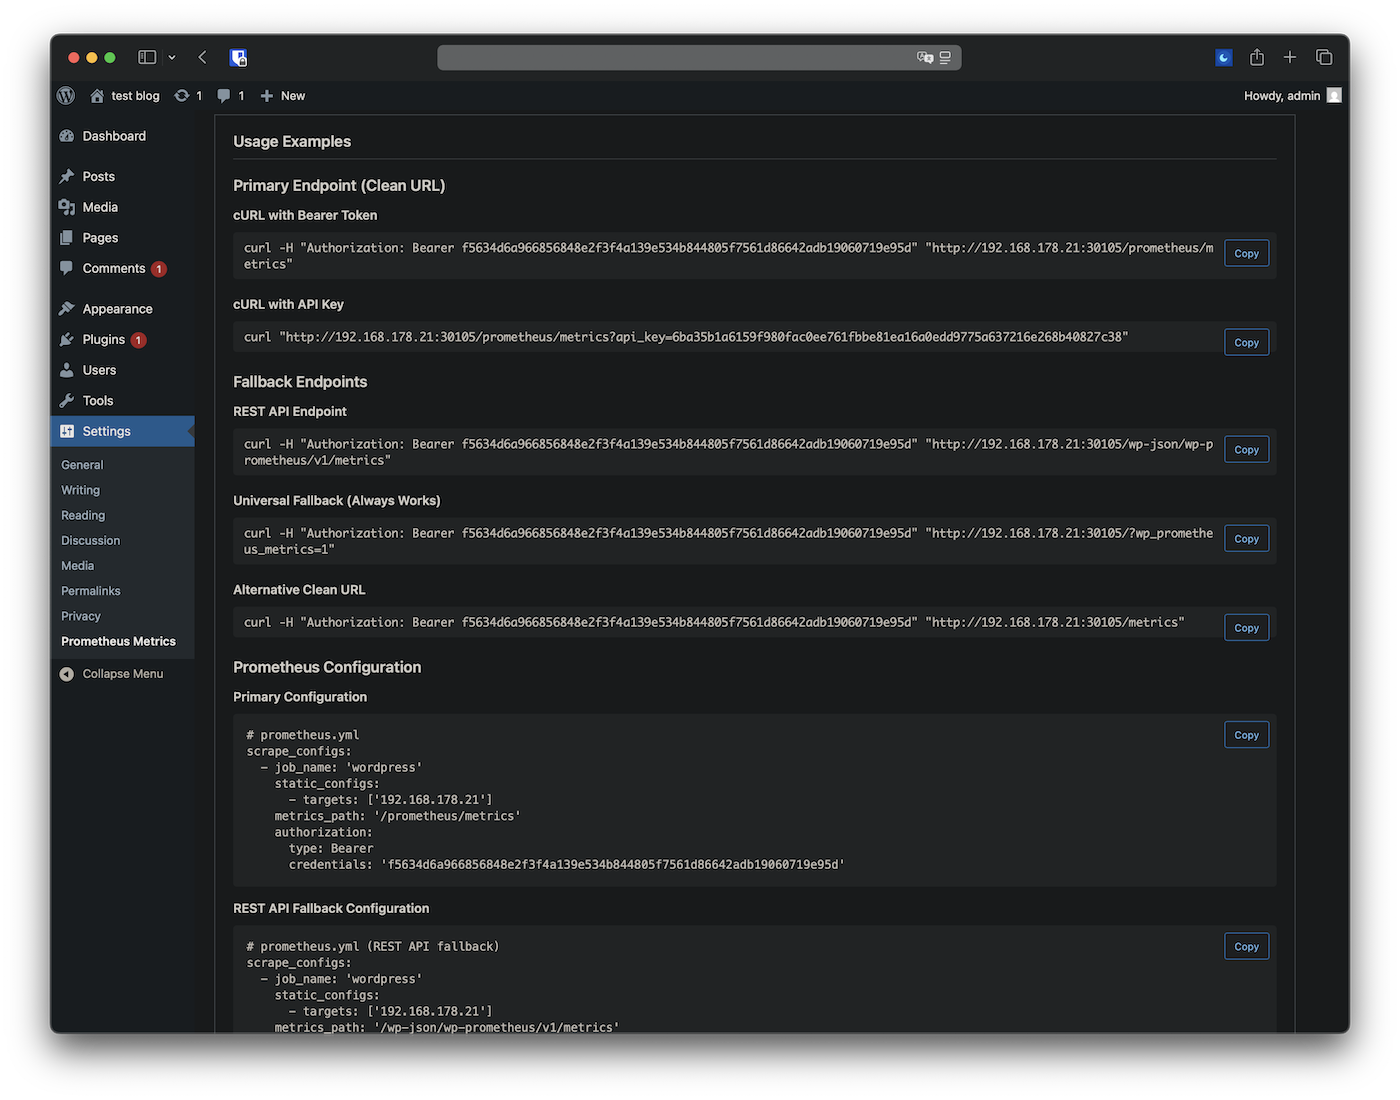
- Copy your Bearer Token or API Key for use in your Prometheus configuration
- Configure your Prometheus server to scrape the metrics endpoint
yaml
scrape_configs:
- job_name: 'wordpress'
static_configs:
- targets: ['yoursite.com']
metrics_path: '/slymetrics/metrics'
authorization:
type: Bearer
credentials: 'your_bearer_token_here'
scrape_interval: 60s
屏幕截图:
常见问题:
What endpoints are available for metrics?
The plugin provides multiple endpoint options:
- Primary:
/slymetrics/metrics(requires permalink support) - Alternative:
/slymetrics(requires permalink support) - REST API:
/wp-json/slymetrics/v1/metrics - Fallback:
/index.php?rest_route=/slymetrics/v1/metrics - Query parameter:
/?slymetrics=1
Do I need to configure Apache or Nginx?
No! The plugin works out-of-the-box without requiring server configuration changes. Fallback URLs are automatically provided if rewrites don't work.
How secure is the authentication?
Extremely secure with enterprise-grade features. All tokens are encrypted using AES-256-CBC with unique initialization vectors. Version 1.2.0 adds comprehensive security enhancements including input validation, SQL injection prevention, XSS protection, rate limiting (60 requests/minute), and security headers. You can also use environment variables for the encryption key in production.
What metrics are exported?
The plugin exports comprehensive metrics including user counts, post/page statistics, plugin/theme information, database sizes, PHP configuration, site health data, and much more. All metrics include site labels for multi-site environments.
Can I use this with multi-site WordPress?
Yes! All metrics include site labels, making it perfect for monitoring multi-site WordPress installations.
What are the system requirements?
- WordPress 5.0 or higher
- PHP 7.4 or higher
- OpenSSL PHP extension (recommended for encryption)
- WordPress administrator access for configuration
- Minimum 64MB PHP memory limit (recommended 128MB for optimal performance)
- Database with InnoDB support for performance metrics
更新日志:
- Expose WordPress metrics via the WordPress MCP Adapter (WP 6.9+): five abilities accessible as MCP tools for AI agents: metrics/get-summary, metrics/get-users, metrics/get-posts, metrics/get-plugins, and metrics/get-site-health.
- Add dedicated slymetrics-mcp-server custom MCP server registered when the MCP Adapter plugin is active.
- Add three new MCP abilities exposing all remaining Prometheus metrics: metrics/get-content (comments, categories, media, tags), metrics/get-storage (autoload options, database size, directory sizes), and metrics/get-health-checks (site health check summary and individual test results).
