SpatialTree: Most Intuitive Data Visualization Service
| 开发者 | SpatialTree |
|---|---|
| 更新时间 | 2014年9月26日 09:41 |
| 捐献地址: | 去捐款 |
| PHP版本: | 3.5 及以上 |
| WordPress版本: | 3.9.1 |
| 版权: | GPL v2.0 or later |
| 版权网址: | 版权信息 |
标签
charts
chart
graph
graphs
visualization
data visualization
visualise data
data visualizations
visualisation
data analytics
twitter visualizations
facebook visualizations
social media data
social media visualizations
visualize data
data blog
viral data visualizations
graphical visualizations
Twitter Data
下载
详情介绍:
SpatialTree is the most complete data visualization service. Here is why:
1. Wide collection of data visualizations to chose from
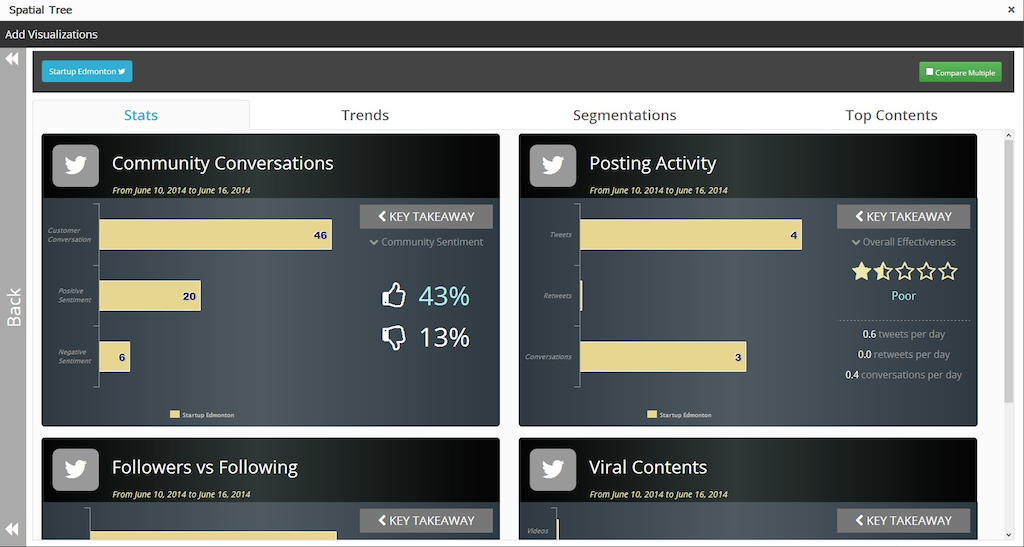
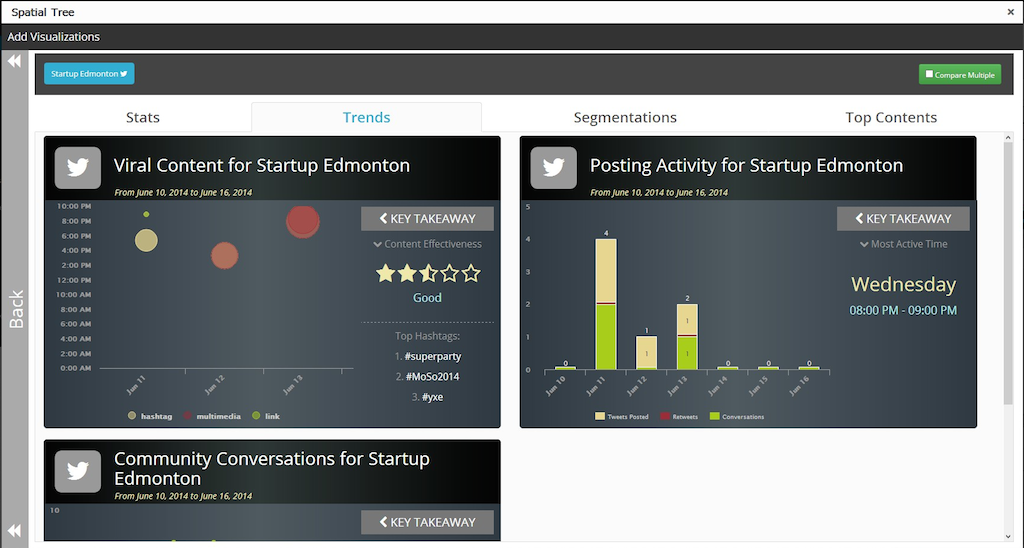
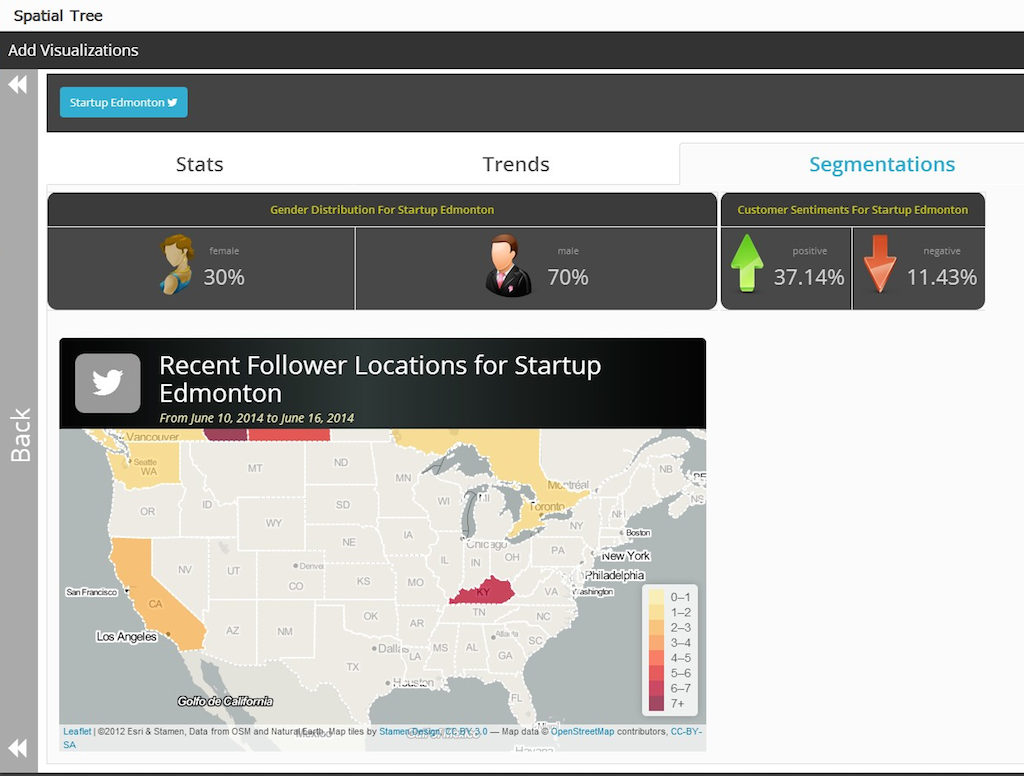
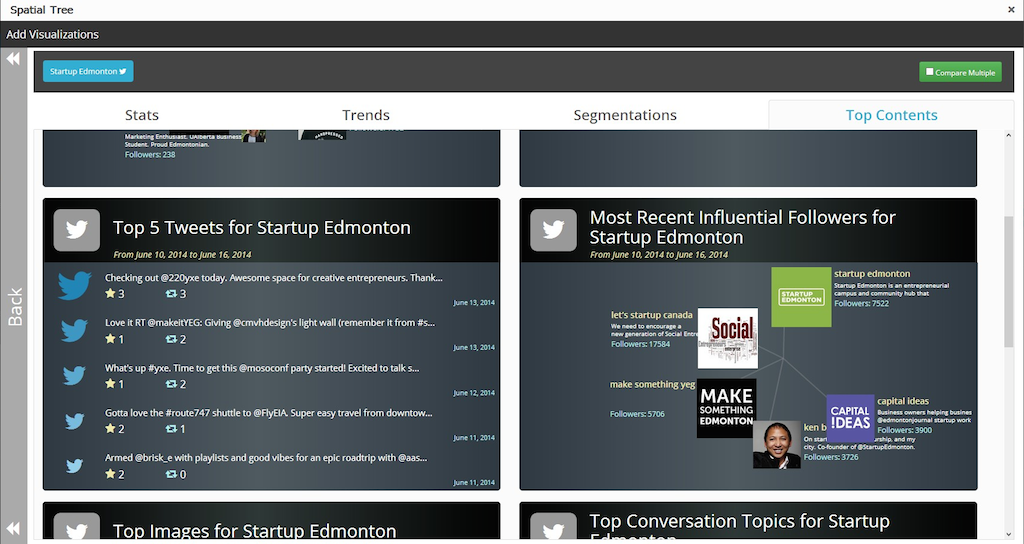
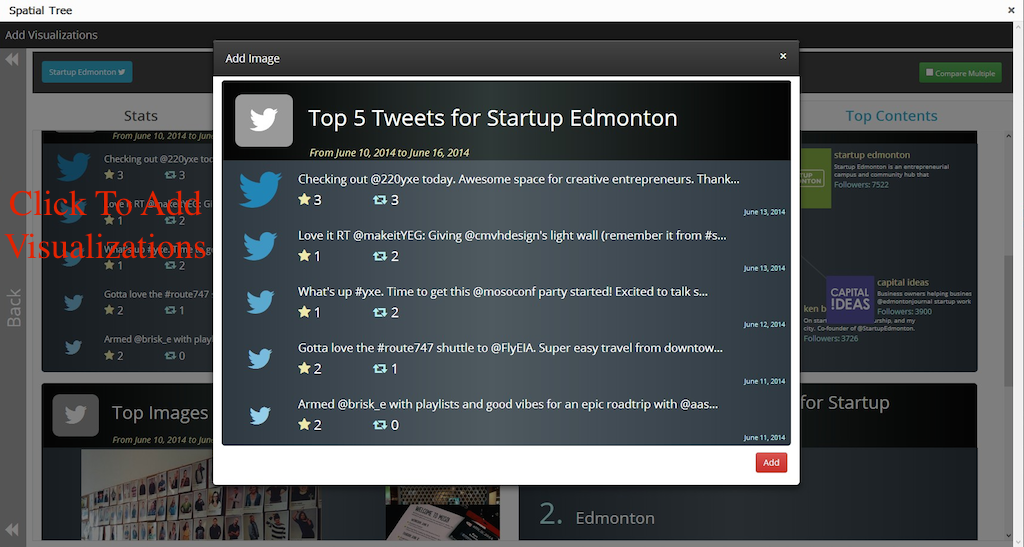
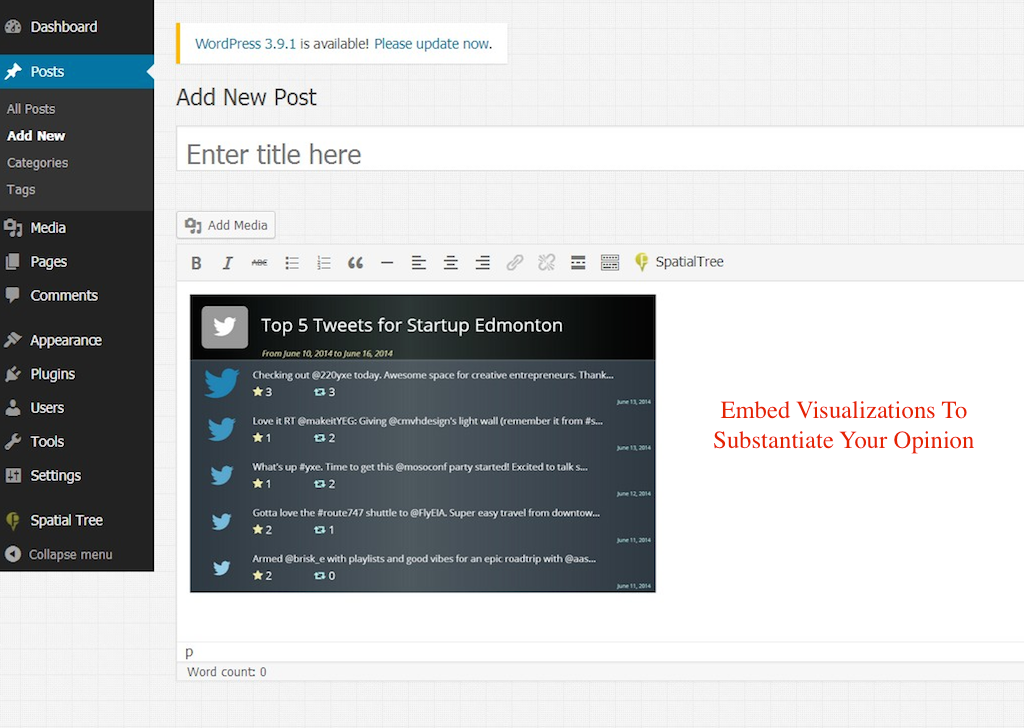
Underneath the hood, SpatialTree visualizations uses advanced statistics, natural language processing and other sophisticated data processing techniques. The plugin generates wide variety of visualizations. For instance on Twitter datasets, the plugin generates a minimum of 15 data visuals for each entity( Screen shot 4, 5, 6 & 7). Embedding these visualizations(screenshot 8) into your page or post is a click away. Our visualizations over social media datasets are designed for web pages dealing with market research, community opinions, product reviews, competitive analysis and much more.
2. You don’t have to spend time collecting and cleaning data
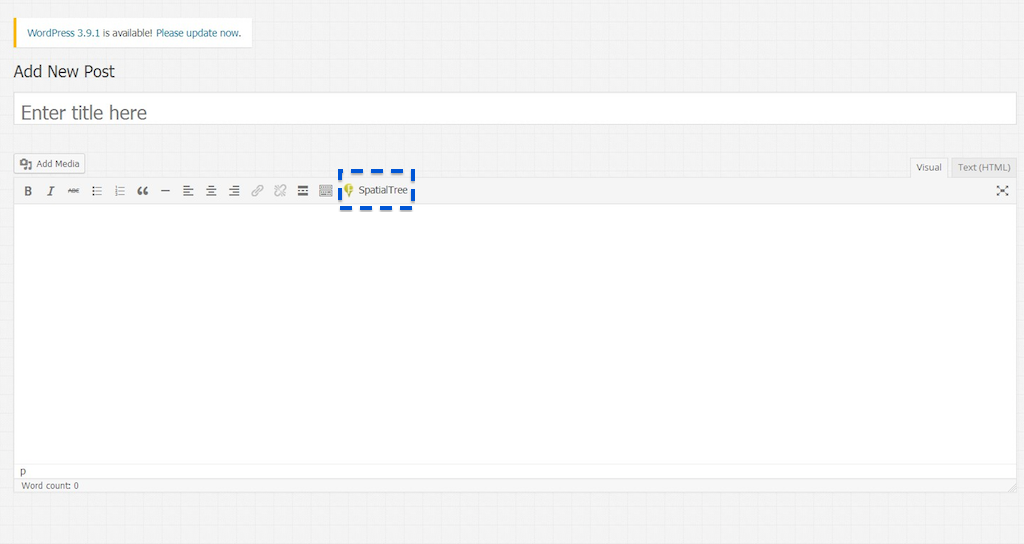
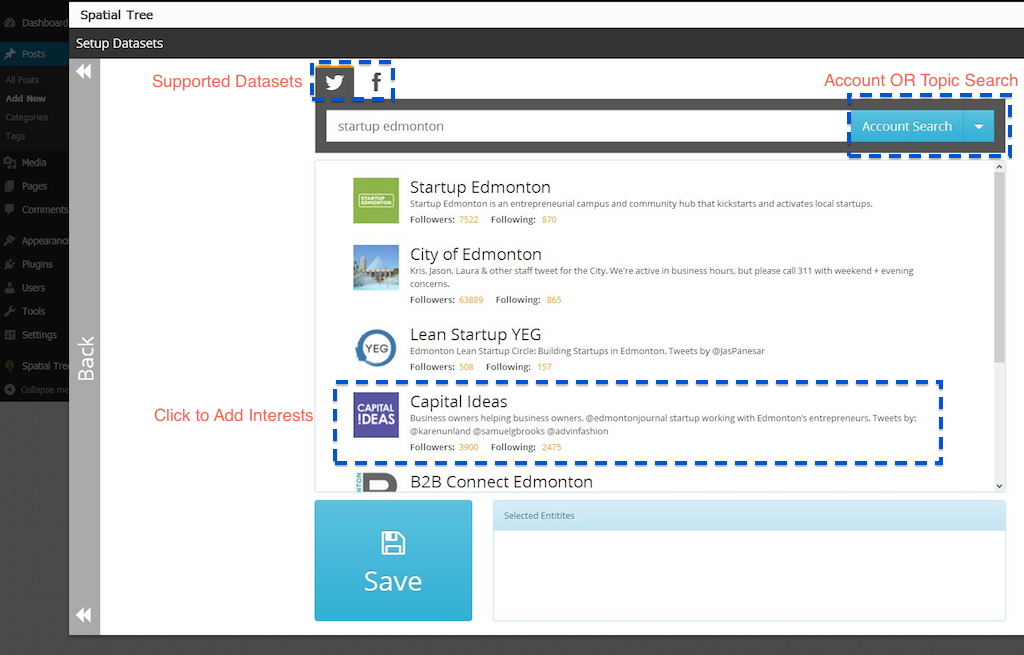
Our plugin is integrated into public datasets. It automagically converts publicly available data on the internet into eye catching information visuals that you can embed into your contents, just like how you would embed an image. Screen shot 1, 2 and 3 shows you how to access, setup and generate data visuals on the plugin. Please note at this time, our beta version only supports social media datasets - Twitter & Facebook.
3. Designed for eyeballs and impressions
Your post and pages are competing with 3 million other blog articles created daily. We know its not an easy task to drive ‘eye balls and impressions’ all the time. So this is where our visual designs standout - We took great care in designing our visualizations for every internet user. You don’t have to worry about chart types, level of details and look'n'feel.
4. Most major browser and mobile device compatible
Our plugin has been tested on Chrome, Safari, Firefox and Internet Explorer. The visualizations that is embedded on your content page/post will work on almost all regular and mobile browsers.
Important Notes:
- Current version is in beta and we hope to make it to a full PRO version within a month. This beta version comes with full functionalities and will be completely free for early adopter even after we go live with the PRO version.
- Functionalities of the plugin has been tested on all major browsers and mobile devices.
- Currently our beta version only supports Twitter and Facebook - it is integrated into these datasets and collects data automatically for you
- When search for Twitter or Facebook data the plugin will popup (please check your popup blocker settings) an authorization page for you to authorize SpatialTree application.
安装:
- Install SpatialTree either via the WordPress.org plugin directory, or by uploading the files to your server.
- After activating the SpatialTree Plugin, you can start using the functionalities by click the SpatialTree 'editor' button on the post/page edit page.
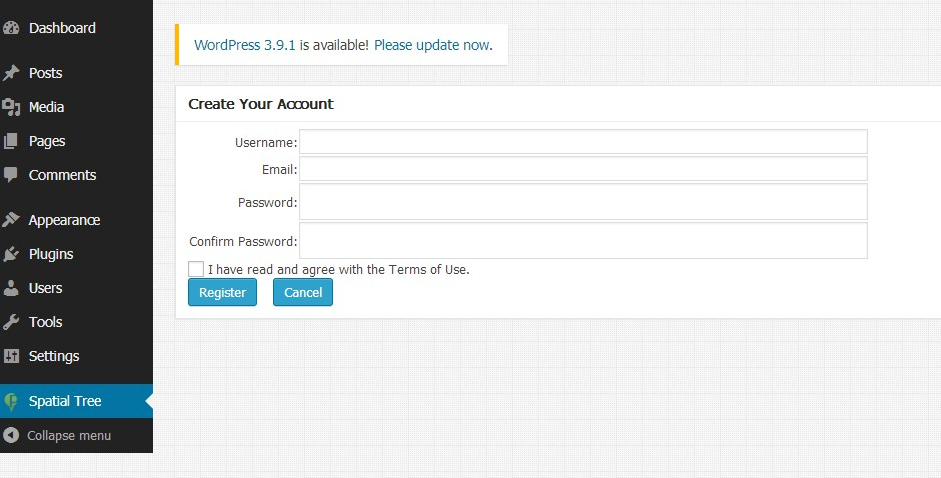
- Please note the plugin only shows limited visualizations for anonymous usage. Please create an account to unlock the full features.
屏幕截图:
更新日志:
0.1
- This is the first beta version of the application.
- Fixed directory issues