Speedix
| 开发者 | wpcoretools |
|---|---|
| 更新时间 | 2026年5月27日 08:31 |
| PHP版本: | 7.4 及以上 |
| WordPress版本: | 7.0 |
| 版权: | GPLv2 or later |
| 版权网址: | 版权信息 |
详情介绍:
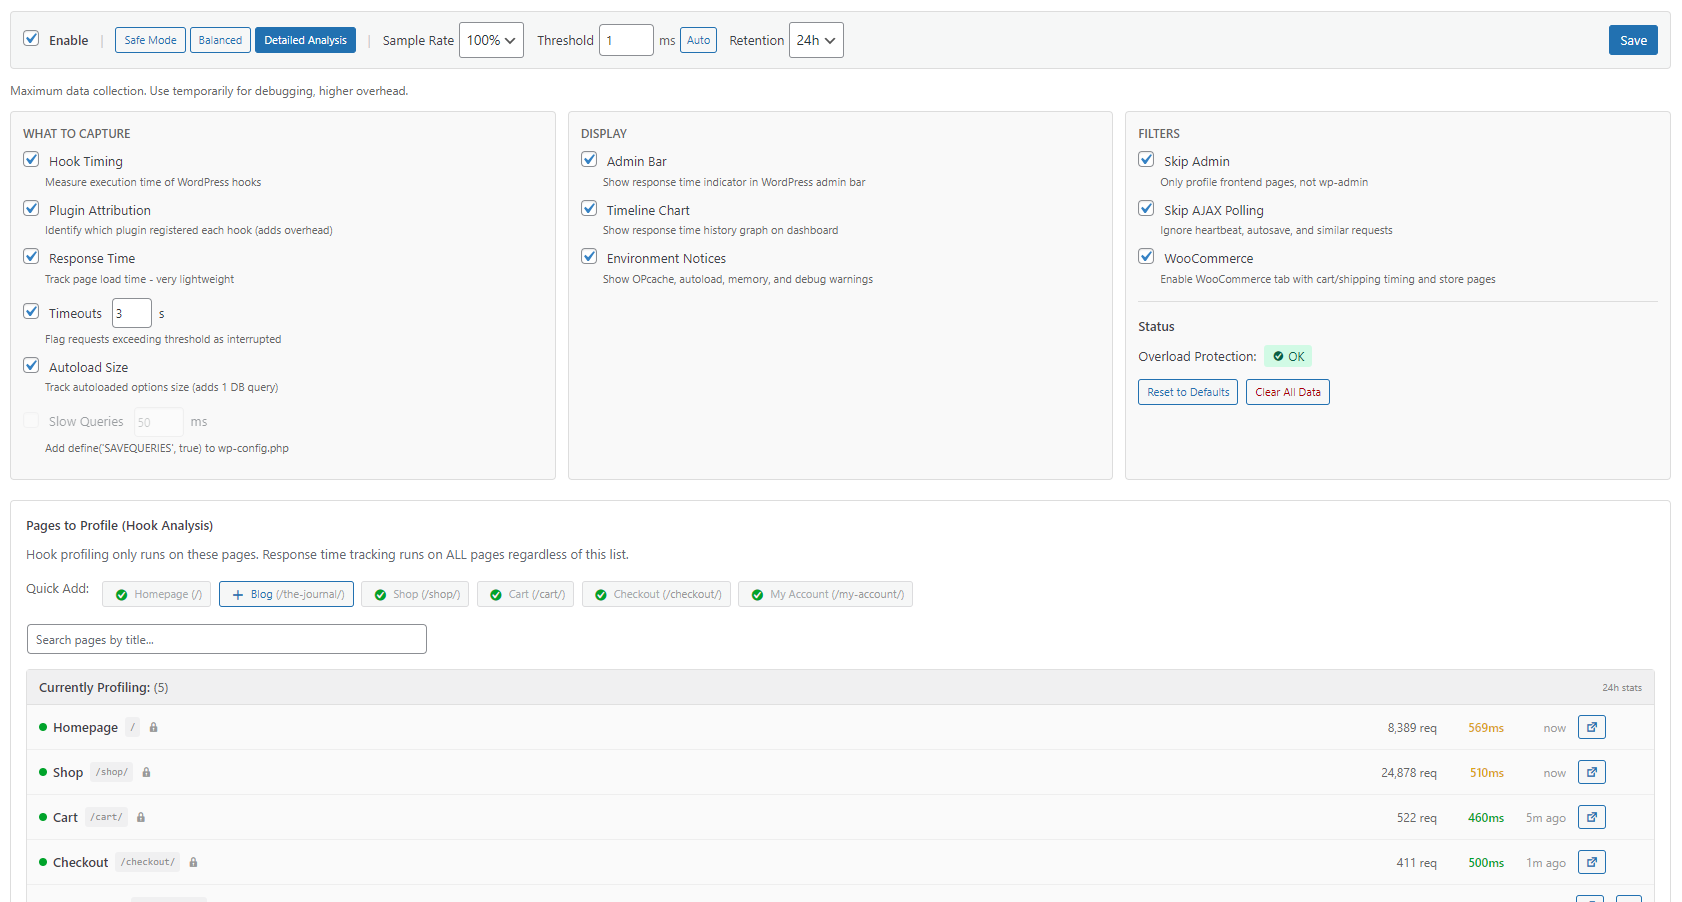
- Sample rate control (10-100% of requests)
- Threshold filtering to only log slow hooks
- Overload protection auto-pauses if overhead spikes
- Auto-cleanup from 1 hour to 7 days retention
安装:
- Upload the plugin files to
/wp-content/plugins/speedix/ - Activate the plugin through the 'Plugins' menu in WordPress
- Go to Tools > Speedix
- Complete the Quick Setup wizard (recommended) or configure manually
- Enable profiling and visit your site to start collecting data
屏幕截图:
常见问题:
Will this slow down my site?
Minimal impact when configured properly. Use "Safe Mode" preset (10% sampling, 2ms threshold) for production sites. The plugin includes overload protection that automatically pauses profiling if overhead exceeds safe limits.
Will this break my site?
No. Speedix uses read-only profiling with built-in safety limits. If overhead gets too high, it automatically pauses for 1 hour. You can also disable at any time from Settings.
How is this different from debugging plugins?
Debugging plugins show detailed info about the current request. Speedix takes a different approach - it aggregates performance data over time to identify persistent slow spots and trends across many page loads.
Why am I seeing 0 hooks collected?
Check these in order:
- Is profiling enabled? Toggle must be ON in Settings.
- Is the page whitelisted? Only pages in "Pages to Profile" are tracked.
- Sample rate too low? At 25%, only 1 in 4 requests profile. Set to 100% for testing.
- Threshold too high? Set to 0ms temporarily to capture all hooks.
- Are you visiting the right page? Make sure it's in your whitelist.
Why is the plugin breakdown empty?
Enable "Identify plugin sources" in Settings. Without this, hooks are captured but not attributed to specific plugins.
What does "unknown" plugin mean?
Appears when callbacks can't be traced to source files. Common causes: anonymous closures, dynamically generated functions, or code outside plugin/theme directories.
Can I leave it running on production?
Yes, especially in Safe Mode. Sample rate ensures only 10-25% of requests are profiled, and overload protection prevents performance impact.
How long is data kept?
Default: 24 hours. Configurable from 1 hour to 7 days. Data is automatically cleaned up via WordPress cron.
Does it work with page caching?
The profiler measures uncached PHP execution. Cached pages bypass PHP entirely and won't appear in profiles - this is expected behavior since cached pages are already optimized.
Can I use this on multisite?
Yes. Each site maintains its own profiling data. Network admins can access the dashboard on any site.
更新日志:
- Compatibility: Tested with WordPress 7.0 and WooCommerce 10.8.
- Added: "More tools by WPCoreTools" page (Dashboard → tab) listing the rest of our free, GPL toolkit (Email Verify, Disposable Email Guard, Tidy Media). Each entry shows whether it's already active on the site, with one-click activate links and Thickbox modal install for missing plugins.
- Fixed: Frontend timing AJAX endpoint inserting non-existent
response_time_mscolumn, causing repeated WordPress database errors in PHP error log
- Added: Iframe source tracking - click iframe count to see which iframes are on the page
- Added: Iframe details stored with each page load (host, src, id, title, lazy status)
- Added: Up to 10 iframes tracked per page with full URL details
- Added: Hidden iframe detection - invisible/no-src iframes no longer count as blocking
- Added: Iframe name attribute captured for better identification (e.g., reCAPTCHA)
- Fixed: Iframe blocking count mismatch with details list (was using MAX aggregation)
- Added: Max Hooks per request now configurable in settings (50-500, default 150)
- Added: Presets set appropriate Max Hooks values (Safe: 80, Balanced: 150, Detailed: 300)
- Changed: Site health scan now runs at 3:00 AM instead of relative to activation time
- Changed: Default threshold raised to 2ms (reduces noise from sub-millisecond hooks)
- Changed: Codebase passed through WordPress Coding Standards (phpcbf) - formatting only, no behavioral changes
- Fixed: Frontend Timing header elements overlapping issue
- Added: Frontend timing tracking - measures FCP, LCP, DOM, and Load in the browser
- Added: Frontend Timing enabled by default for new installations
- Added: Desktop vs Mobile mini trend charts in Frontend Timing card
- Added: Frontend Timing history modal showing all metrics (LCP, FCP, DOM, Load) over time
- Added: Max values shown alongside averages on all timing charts and tooltips
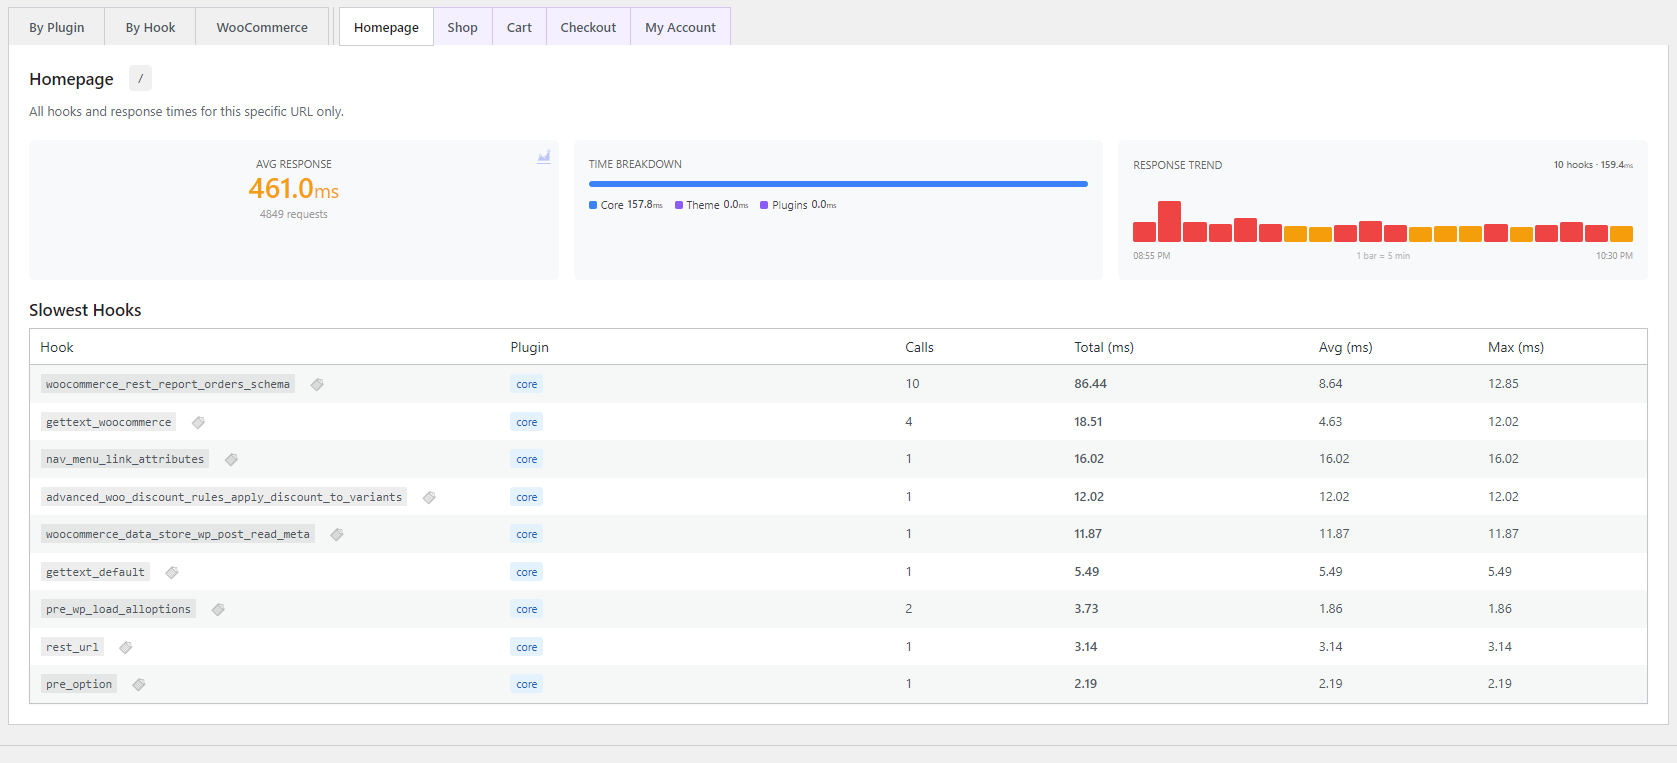
- Added: Per-page tabs now load data separately via AJAX (improved performance)
- Added: Cache detection for frontend page loads (via Navigation Timing API)
- Added: Inline scripts/styles tracking in Assets modal
- Improved: Assets modal source detection for CDN-hosted local files
- Fixed: Frontend timing card now correctly shows desktop values
- Fixed: Clear Data now properly clears External API logs and Site Health scan results
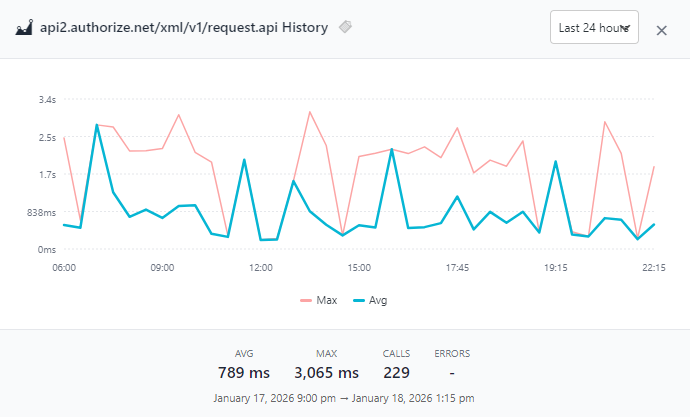
- Added: External APIs tab now shows source plugin badge for each HTTP call
- Added: Source detection uses backtrace to identify which plugin initiated API requests
- Improved: History chart icon grayed out for endpoints with insufficient data points (<3)
- Improved: Tooltip explains "Not enough data for chart" when hovering inactive chart icons
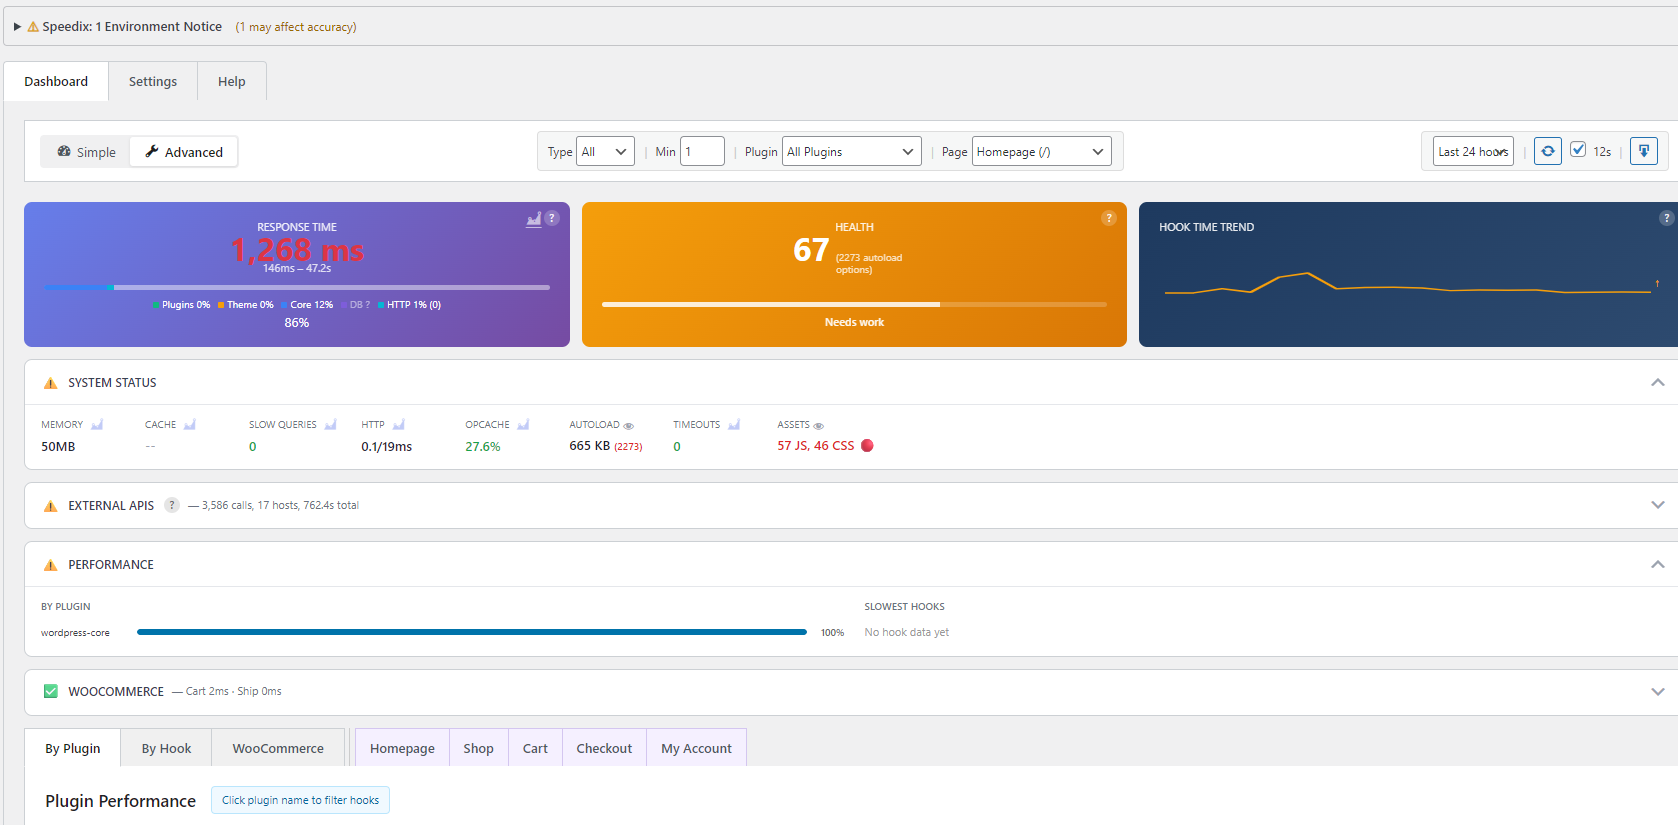
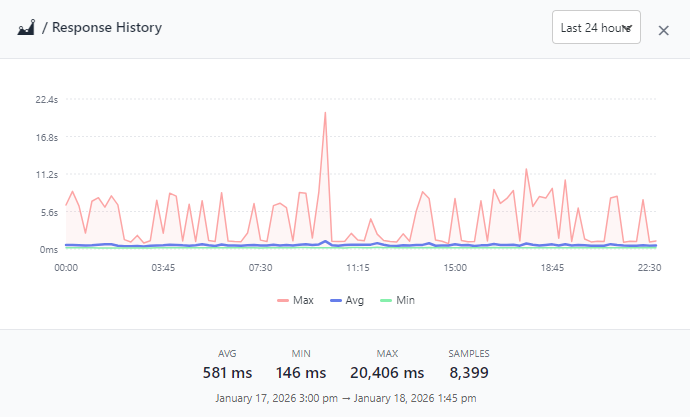
- Added: Response Time card now shows request count, P95 percentile, and Frontend/Admin split
- Added: Time period indicator in Response Time card header
- Added: Timeout alerts shown directly in Response Time card
- Added: Clear "Site Health Scan" button restored to Health card
- Improved: More actionable metrics at a glance
- Redesigned: Dashboard top cards - clearer layout with better information hierarchy
- New: Time Breakdown card shows PHP/DB/HTTP split with visual bars
- New: Response Time card now shows trend comparison (faster/slower vs previous period)
- New: Health card includes sparkline trend showing score changes over time
- Improved: Cards always show useful data even without hook profiling enabled
- Removed: Bundled translations - plugin is now English-only (reduces zip size by 40%)
- Note: Technical terminology (hooks, profiler, threshold) doesn't translate well; target audience is developers who work in English
- Fixed: Setup wizard now applies all preset settings (track_incomplete, track_autoload_size, track_object_cache, track_slow_queries)
- Fixed: Site Health modal auto-opens after wizard completion
- Added: Data retention varies by preset - Safe: 12h, Balanced: 24h, Detailed: 48h
- Added: Daily health email option in setup wizard (step 3)
- Fixed: Site Health severity levels - bloated options and disabled OPcache now flagged as issues
- Improved: Assets modal shows source location (plugin/theme/core/external) with copy option
- Improved: User sessions display now shows user count alongside size
- Improved: Input sanitization follows WordPress handbook (wp_unslash before sanitize)
- Validated: All security checks pass, translations verified, WordPress.org ready
- Added: Site Health Scan with 22 checks for database bloat, configuration issues, and performance problems
- Added: PHP version check (warns if below 8.0)
- Added: User sessions size check (detects wp_usermeta bloat)
- Added: Action Scheduler history check (WooCommerce completed actions)
- Added: Site Health Scan button on Health card for quick access
- Added: Setup wizard now offers initial Site Health Scan on completion
- Added: Email Report button - sends site health report to current user's email
- Added: Copy Report button - copy scan results to clipboard
- Added: Daily automated site health email reports (configurable in settings)
- Added: Mobile-responsive HTML email template for site health reports
- Improved: OPcache check now shows memory usage, cached scripts count, and restart count vs limits
- Improved: Passed items now collapsed in accordion to save screen space
- Added: Output buffer size tracking (HTML output bloat detection)
- Added: Memory limit percentage (how close to crashing)
- Added: Included files count (PHP file loading overhead)
- Added: Textdomain count (translation file loading overhead)
- Added: CPU time tracking via getrusage() (CPU-bound vs I/O-bound)
- Added: Asset Count toggle in settings to enable/disable JS/CSS tracking
- Fixed: TypeError when asset source URL is null (inline scripts)
- Fixed: JavaScript error on dashboard load (sectionCache undefined)
- Fixed: Health score now calculated in JavaScript only (single source of truth)
- Improved: Admin widget shows response time only (lighter, faster loading)
- Removed: Graph icon from slowest hooks section
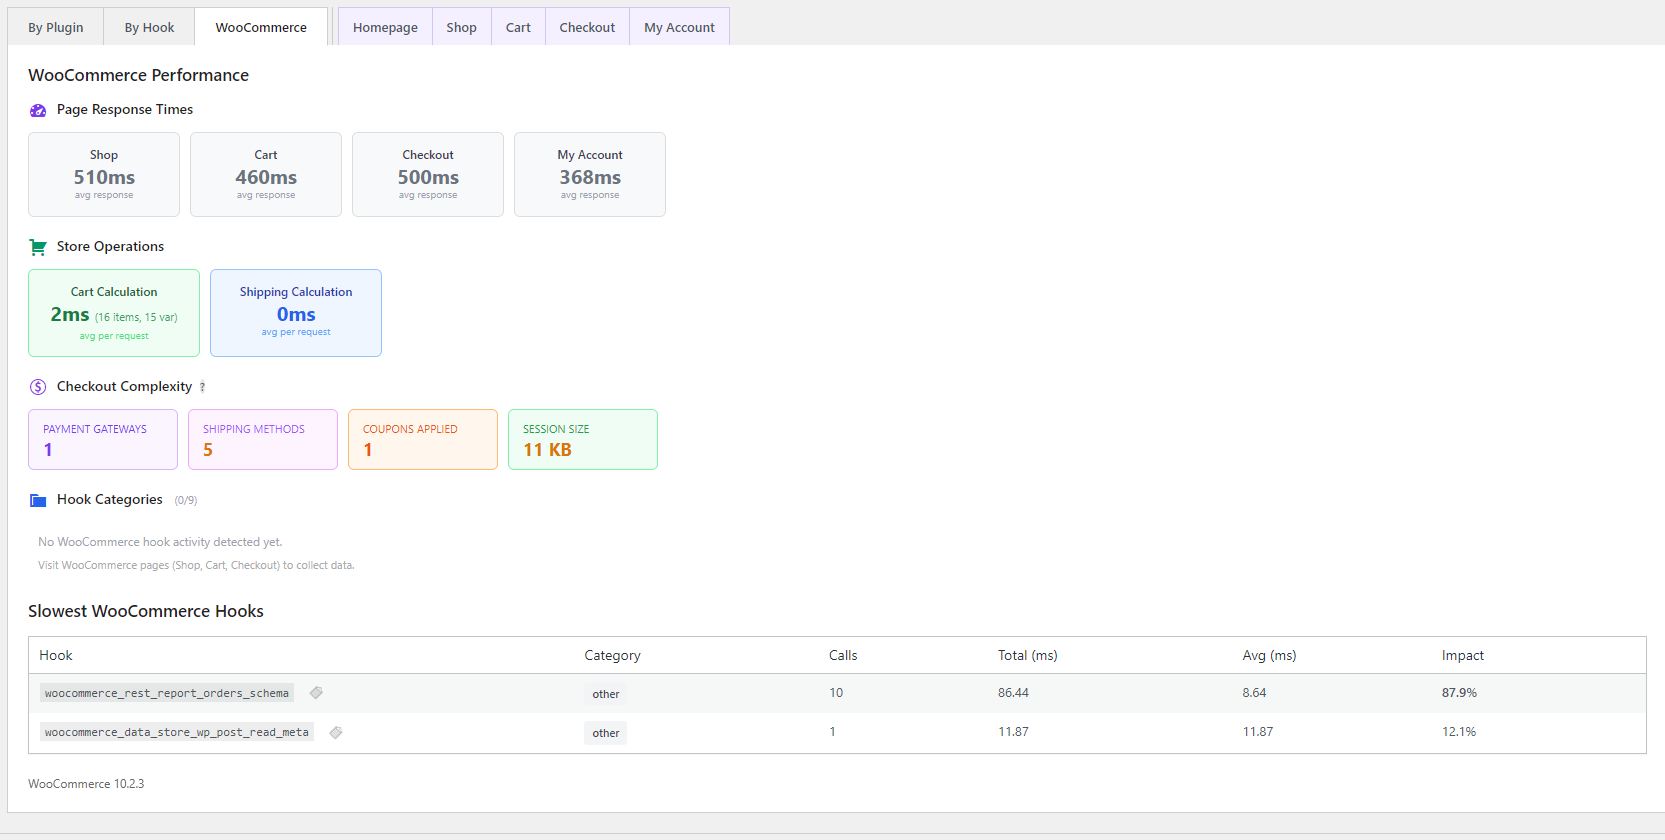
- Added: WooCommerce checkout complexity metrics (payment gateways, shipping methods, coupons, session size)
- Added: Clickable Assets stat opens modal showing all enqueued JS/CSS files with sizes
- Improved: Autoload options modal shows "By Source" tab grouping options by plugin
- Improved: Health score penalty for excessive assets (>25, >40, >60 files)
- Added: Asset tracking - counts enqueued JS/CSS files per page
- Added: Assets metric in System Status showing JS/CSS file counts
- Added: OPcache status history tracking (hit rate, memory usage, script count)
- Added: External API call logging with host/path breakdown
- Added: Clickable API rows open history graph
- Fixed: Dashboard shows average HTTP time per request
- Added: WordPress admin dashboard widget with health score and slowest plugins
- Added: Color-coded metrics based on performance thresholds
- Fixed: Plugin Check warnings for direct database queries
- Fixed: WooCommerce page timing cards now show response times
- Optimized: Database schema reduced storage by ~70%
- Improved: Faster queries with composite primary keys
- Added: Incomplete request detection - tracks timed out or interrupted requests
- Added: Warning indicator shown on pages with incomplete requests
- Added: Responses data included in JSON/Markdown exports
- Added: Smart calibration with Apply and Apply & Save buttons
- Added: Calibration suggests sample rate based on hook count
- Added: DB and HTTP time breakdown in Response Time card
- Improved: Quick Presets in Sampling section
- Improved: Response Time card centered layout
- Changed: Dashboard is default view when opening plugin
- Added: Copy to clipboard for hook names
- Added: Plugin file path on hover over badges
- Added: Dark mode support (follows system preference)
- Fixed: All PHPCS security warnings
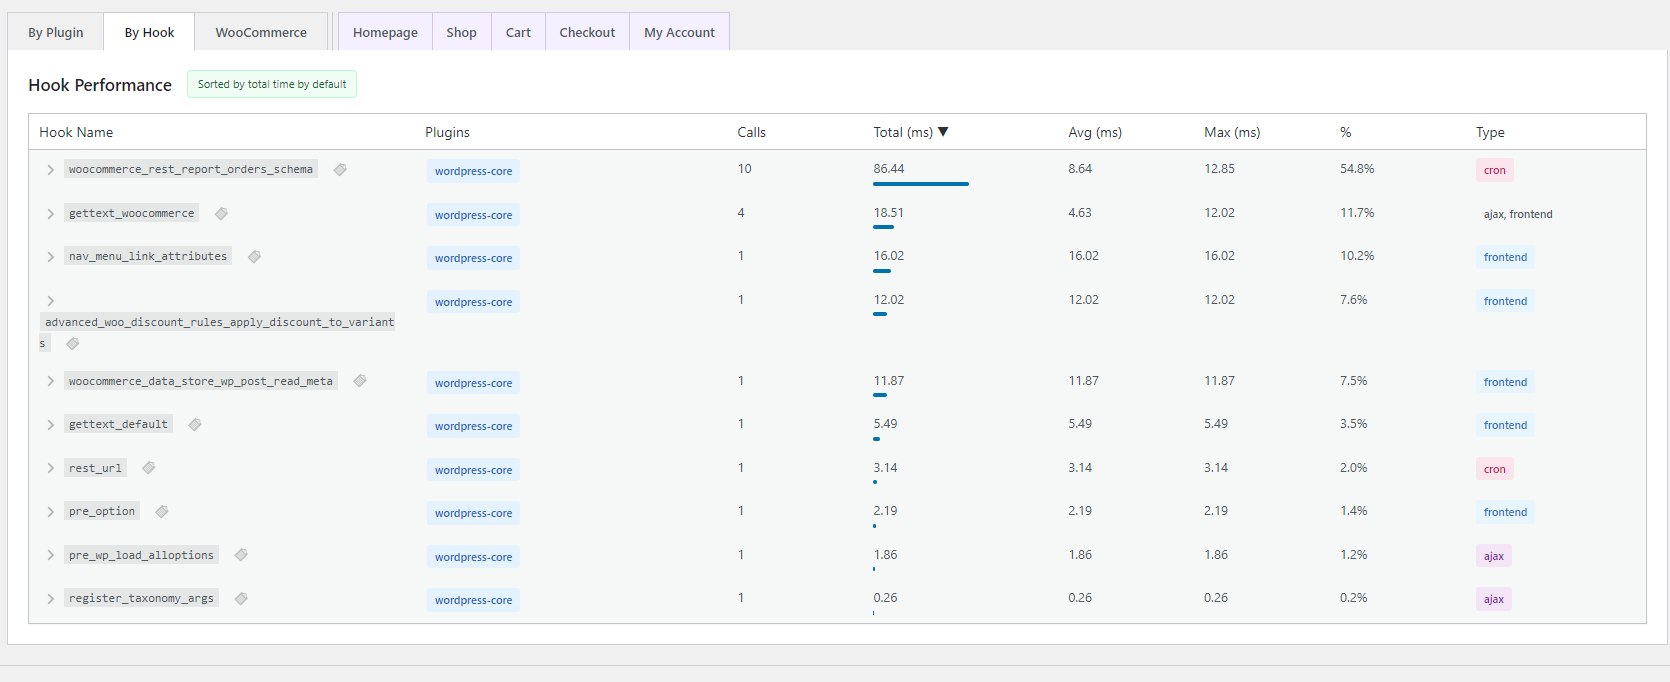
- Fixed: By Hook tab shows each hook once (aggregates all plugins)
- Fixed: Hotspots only shows hooks with avg >= 1ms
- Improved: Cleaner hook list without duplicates
- Improved: Simplified dashboard with 3 summary cards
- Improved: Timeline uses 5-minute intervals
- Improved: Only render active tab data
- Added: Tooltip help icons on cards
- Added: Overload Protection status in Settings [See full changelog in plugin folder]