Plugin Name
| 开发者 | rinaldi6109 |
|---|---|
| 更新时间 | 2013年10月16日 01:58 |
| PHP版本: | 3.5 及以上 |
| WordPress版本: | 3.5 |
| 版权: | GPLv2 or later |
| 版权网址: | 版权信息 |
详情介绍:
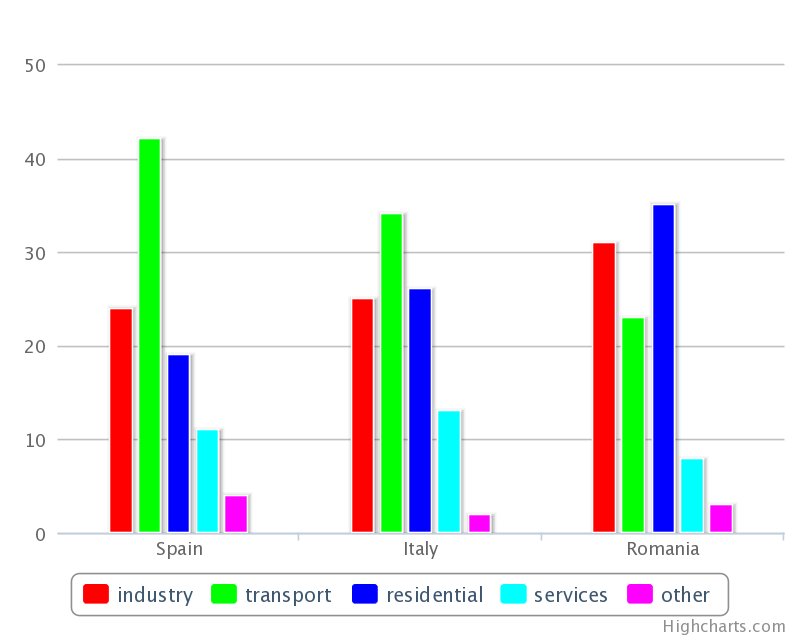
Table2Chart enables a shortcode to draw a stylish, interactive chart reading numerical data from a table inserted in the same post. It uses the Highcharts JS library (*).
(*) Please read http://www.highcharts.com/products/highcharts for informations.
In its simplest formulation, [Table2Chart] shortcode creates the chart from the first table in the post with default settings.
Several arguments can be specified (default values are within brackets):
- table: number which indicates the cardinal position of the table in the post to gather the data from (1)
- width: chart width in pixel (500)
- height: chart height in pixel (400)
- type: chart type to choose from bar (horizontal bars), column (vertical bars), line, area (column)
- title: chart title (empty)
- subtitle: chart subtitle (empty)
- titlex: category axis title (empty)
- titley: value axis title (empty)
- order: row if data series are horizontal, column if they are vertical (column)
- namecol: position of the row containing the series or category titles (1)
- namerow: position of the column containing the series or category titles (1)
- excluderows: position of rows (e.g. 2 or 3,4) to exclude from the chart (empty)
- excludecols: position of columns (e.g. 2 or 5,6,7,8,9) to exclude from the chart (empty)
- includerows: if set, only the rows whose position is specified (e.g. 2 or 3,4) are included in the chart (empty)
- includecols: if set, only the columns whose position is specified (e.g. 2 or 5,6,7,8,9) are included in the chart (empty)
- background: background color in hexadecimal format (#ffffff)
- color: colors of data series (#ff0000,#00ff00,#0000ff,#00ffff,#ff00ff,#ffff00)
- convert: true if numerical values in the table are in continental (1.234,56) format, false otherwise (true)
- hide: true if the table has to be hidden, false otherwise (false)
安装:
- Upload the Table2Chart.zip file from the 'Plugins' section of Admin menu in WordPress
- Activate the plugin from the 'Plugins' section of Admin menu in WordPress
屏幕截图:
更新日志:
0.5
- Added support for scatterplot and bubble plot.
- Added support for enclosing form and integration with HighCharts API.
- Fixed code to allow negative values.
- Fixed compatibility issue with IE 9.
- Added support for hide argument.
- Added compatibility with extra html tags put by CloudFlare service.
- Added support for arguments includerows and includecols.
- Fixed axis title setting (shortcode arguments have to be written in lower case).
- Added support for empty cells.
- Code rewritten to save shortcode arguments as application/json script rather than chart div content.
- Use a local version of HighCharts library v.2.3.5 which is not affected by a problem present in the new released v.3.0.
- Support of new parameters excluderows and excludecols to exclude some rows and columns from a chart.
- Allow jQuery to be placed in the footer of the page.
- Support for currency numbers ($, �, �, etcetera).
- Fixed wrong number (>1,000) conversion.
- First public release