Titanium Error Intelligence – PHP Error Monitor & Diagnostics
| 开发者 | aplugins |
|---|---|
| 更新时间 | 2026年9月1日 21:53 |
| PHP版本: | 7.4 及以上 |
| WordPress版本: | 7.1 |
| 版权: | GPLv2 or later |
| 版权网址: | 版权信息 |
详情介绍:
- Treats the debug log as an input to grouped diagnostics rather than as the end product.
- Compares retained occurrence timing to identify spikes, bursts, persistence and recurring intervals.
- Tracks source-version observations so a grouped error can be compared across plugin, theme or Core version changes.
- Correlates privacy-reduced request context with supported fatal-style errors to show which execution areas are affected.
- Runs locally without sending the retained error history or request-impact data to a bundled external diagnostics service.
- Groups supported fatal, parse, recoverable fatal, uncaught and WordPress database errors by a normalized fingerprint.
- Detects sudden error spikes relative to the retained recent rate.
- Detects recurring timing patterns when recent occurrences have a sufficiently stable interval.
- Detects short bursts and errors that remain active across multiple days.
- Marks recently introduced grouped errors and errors that have gone quiet.
- Keeps recent occurrence timestamps bounded for lightweight behaviour analysis.
- Retains grouped error intelligence for up to seven days.
- Limits stored history on unusually noisy sites.
- Records the locally installed source version when an error is observed.
- Supports plugins, must-use plugins, themes and WordPress Core.
- Shows the first observed source version and the most recent error version.
- Shows when an error continues after a source version changes.
- Shows when the installed source version has changed and no recurrence has yet been recorded on that version.
- Performs no remote version lookup.
- Correlates available fatal-style request context with a grouped error.
- Separates frontend, REST API, AJAX, cron, login, wp-admin and WP-CLI contexts.
- Stores a normalized route shape rather than a raw query-bearing URL.
- Removes query strings before storage.
- Replaces numeric IDs, email addresses, UUIDs, long hashes, token-like values and sensitive route parameters with placeholders where detected.
- Does not store IP addresses, request bodies, usernames or user IDs.
- Fatal-request correlation keeps only a WordPress/content-relative source file location where possible, otherwise only the filename; full server paths are not retained in request context.
- Can show the most frequently affected normalized local route shapes for a grouped error.
- Request-impact metadata follows the same seven-day retention window as grouped error history.
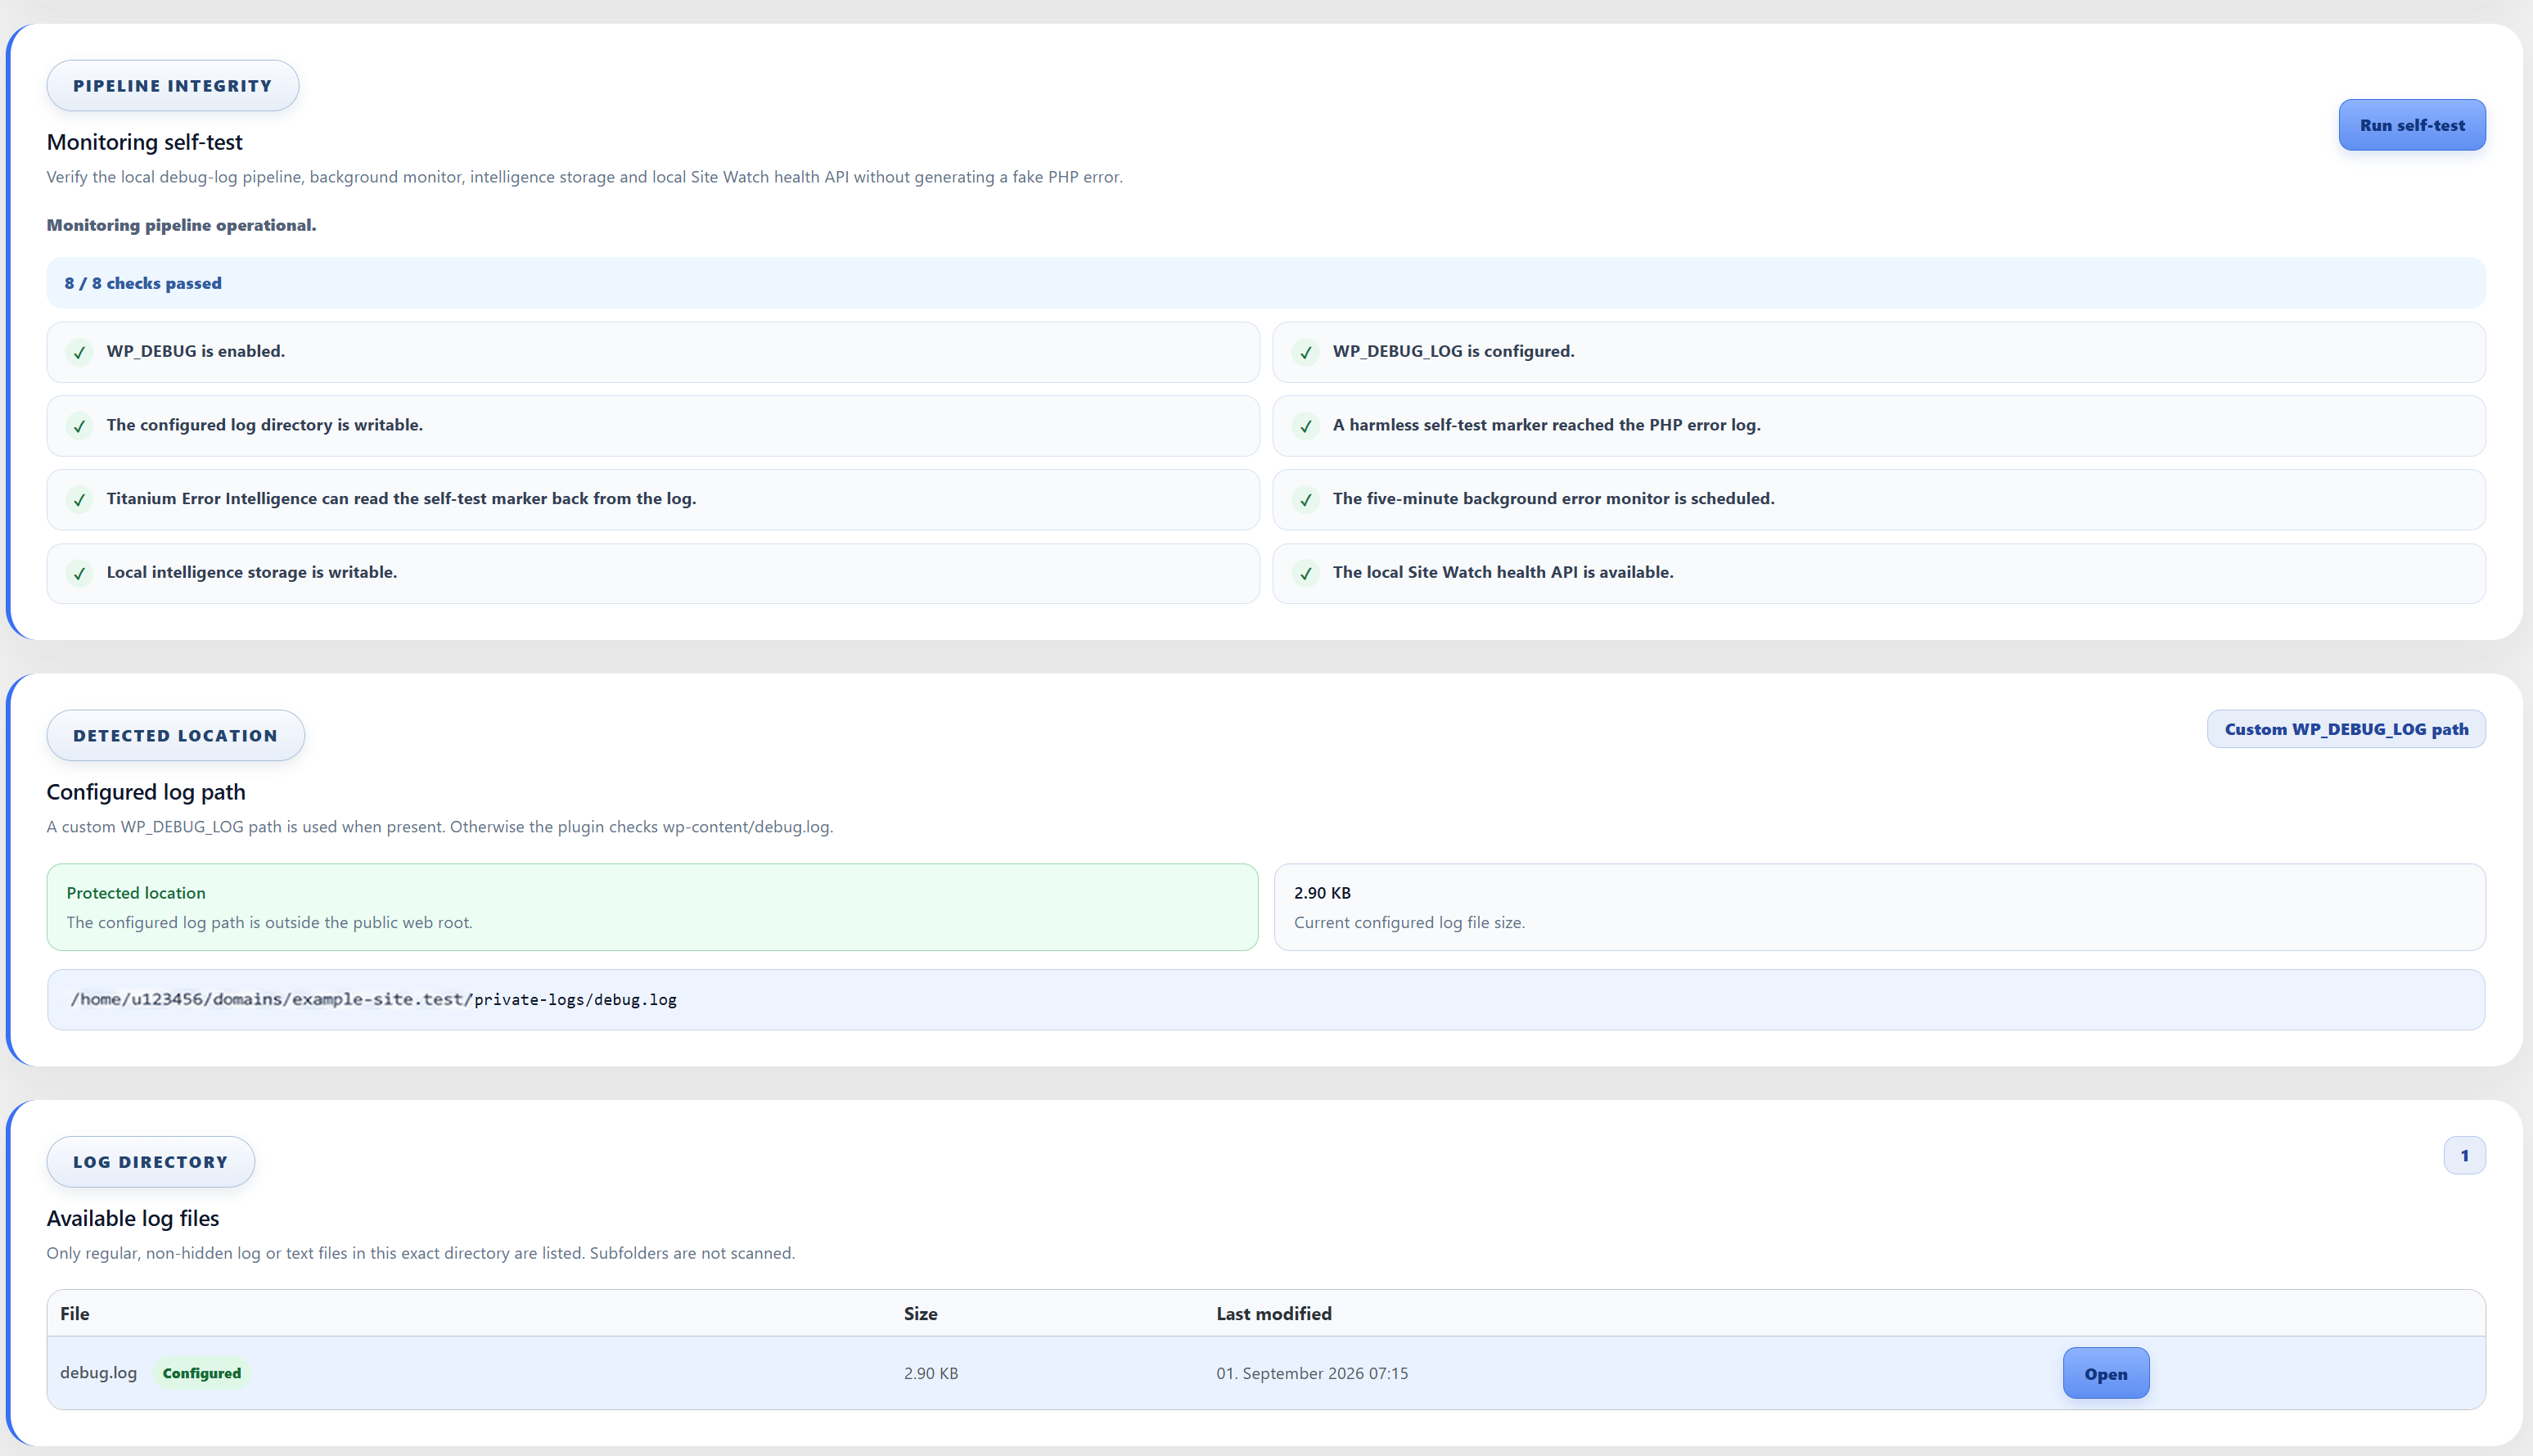
- WP_DEBUG status.
- WP_DEBUG_LOG status.
- Configured log-directory writability.
- Whether a harmless marker reaches the configured PHP error log.
- Whether Titanium Error Intelligence can read that marker back.
- Whether the five-minute background monitor is scheduled.
- Whether local intelligence storage is writable.
- Whether the local Site Watch health API is available.
- Detects a custom WP_DEBUG_LOG path.
- Uses wp-content/debug.log when no custom path is configured.
- Supports absolute custom log paths outside the public web root.
- Can create a plugin-specific private log directory outside the public web root and move the active log there.
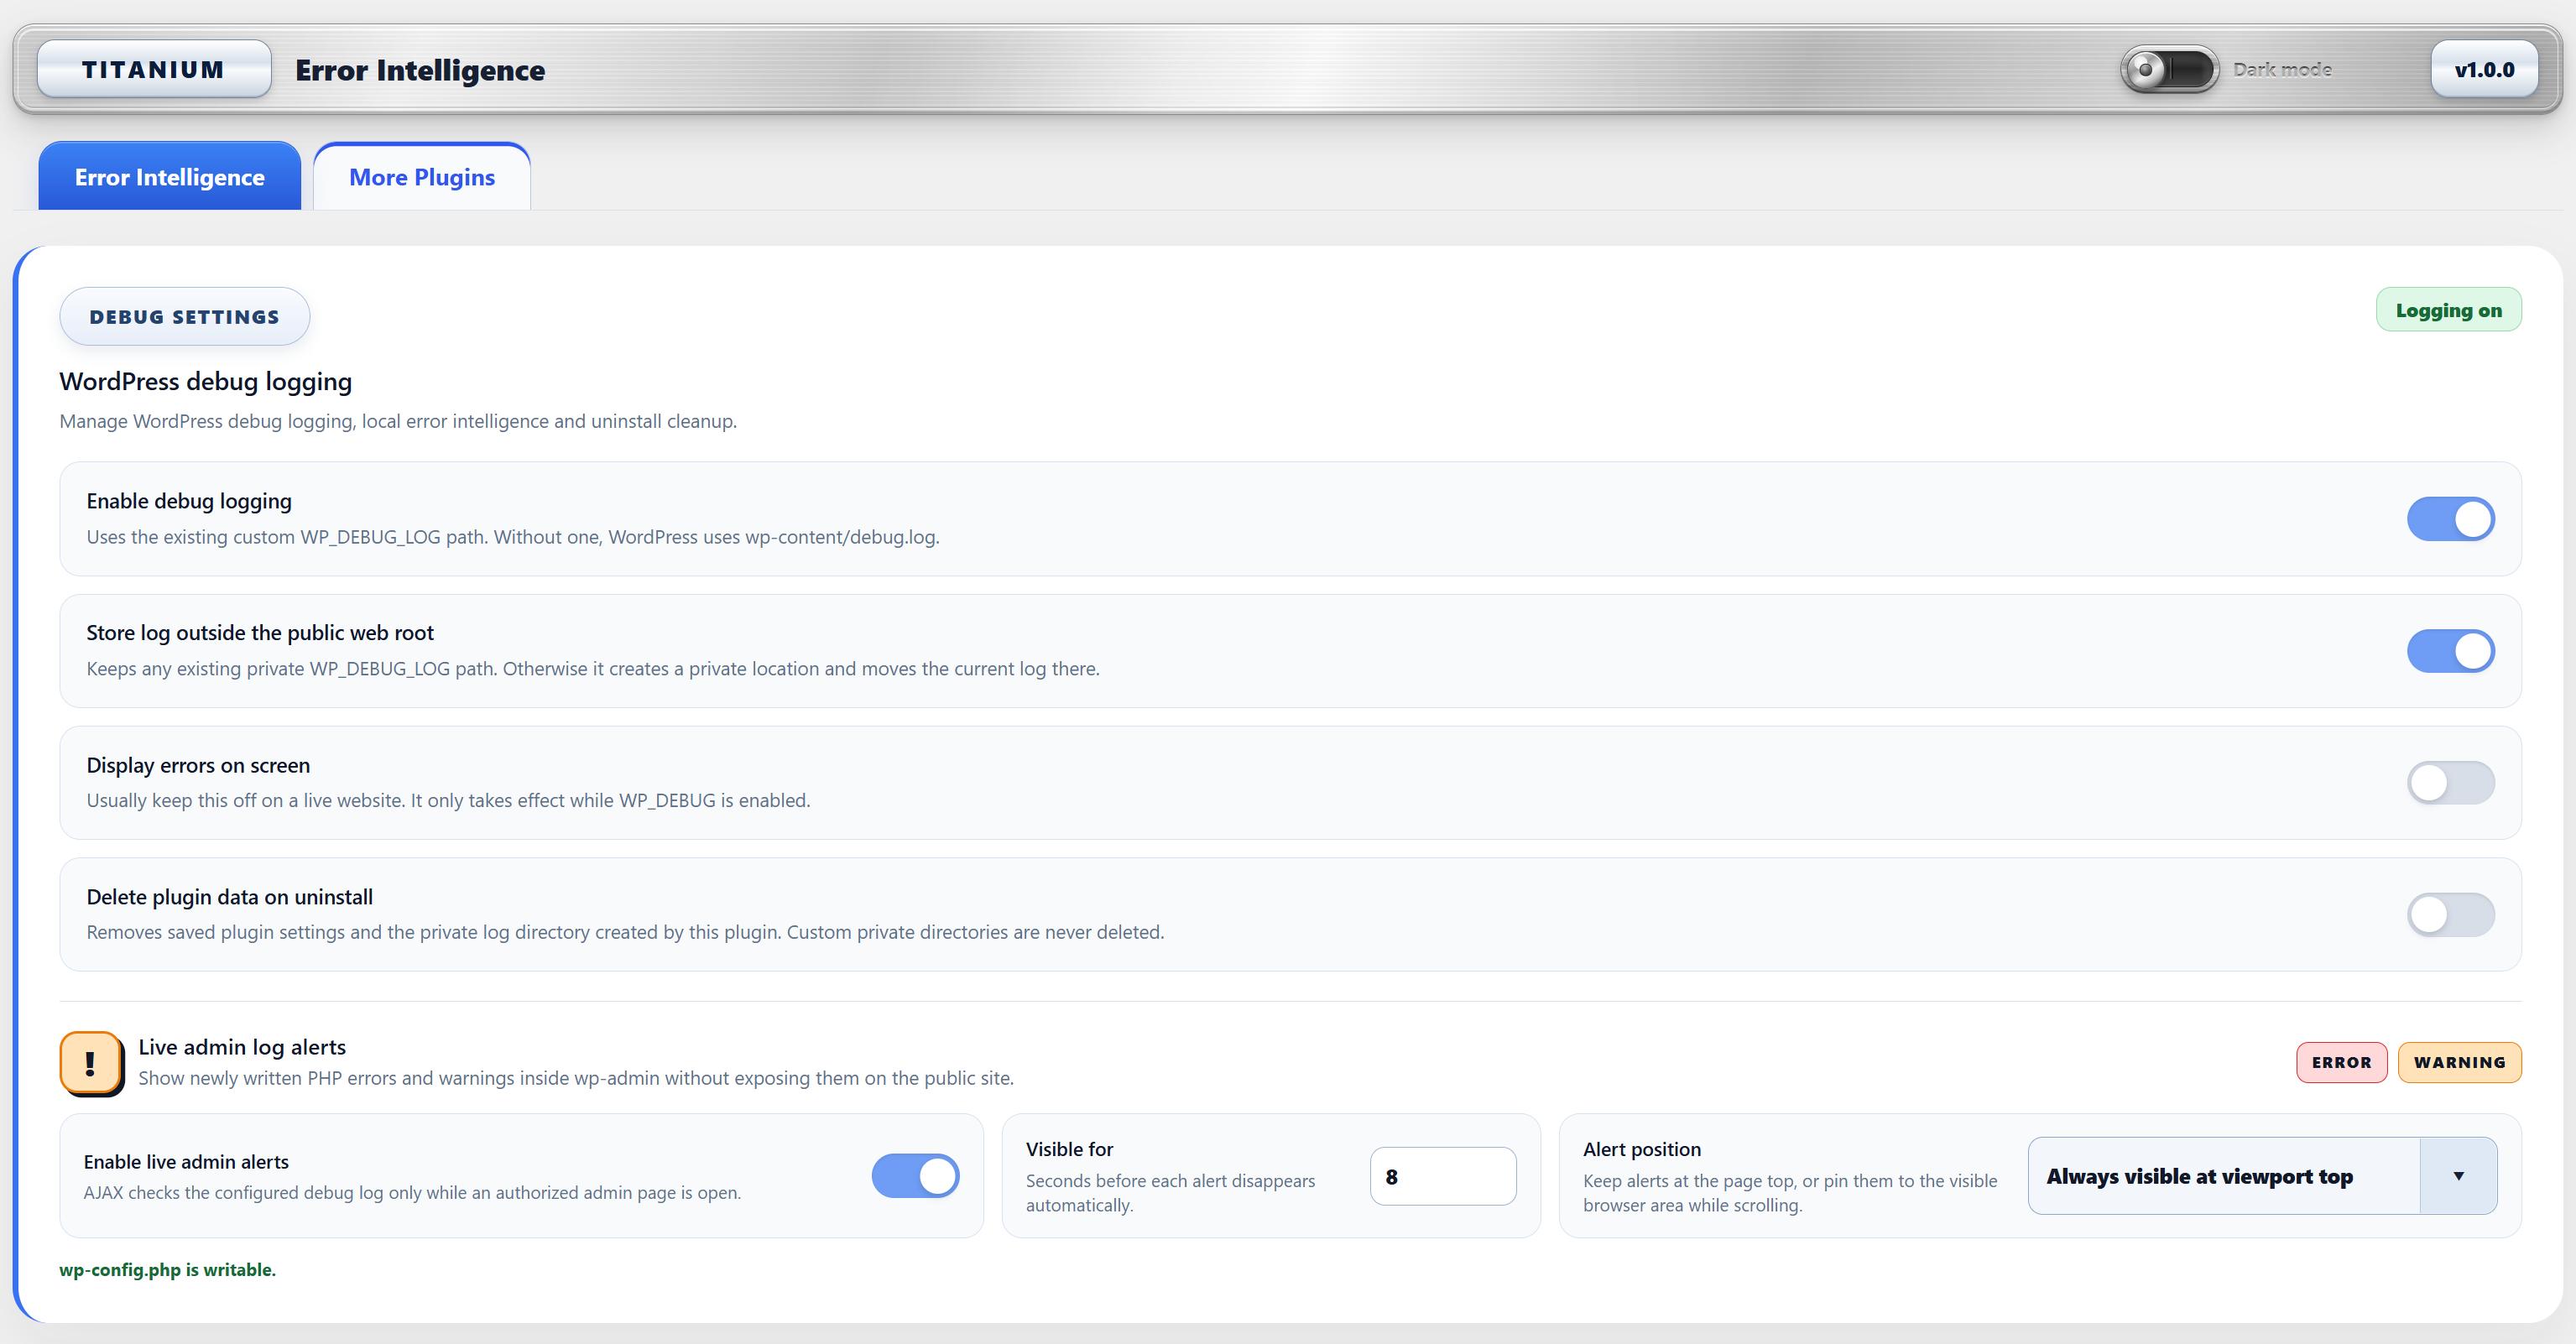
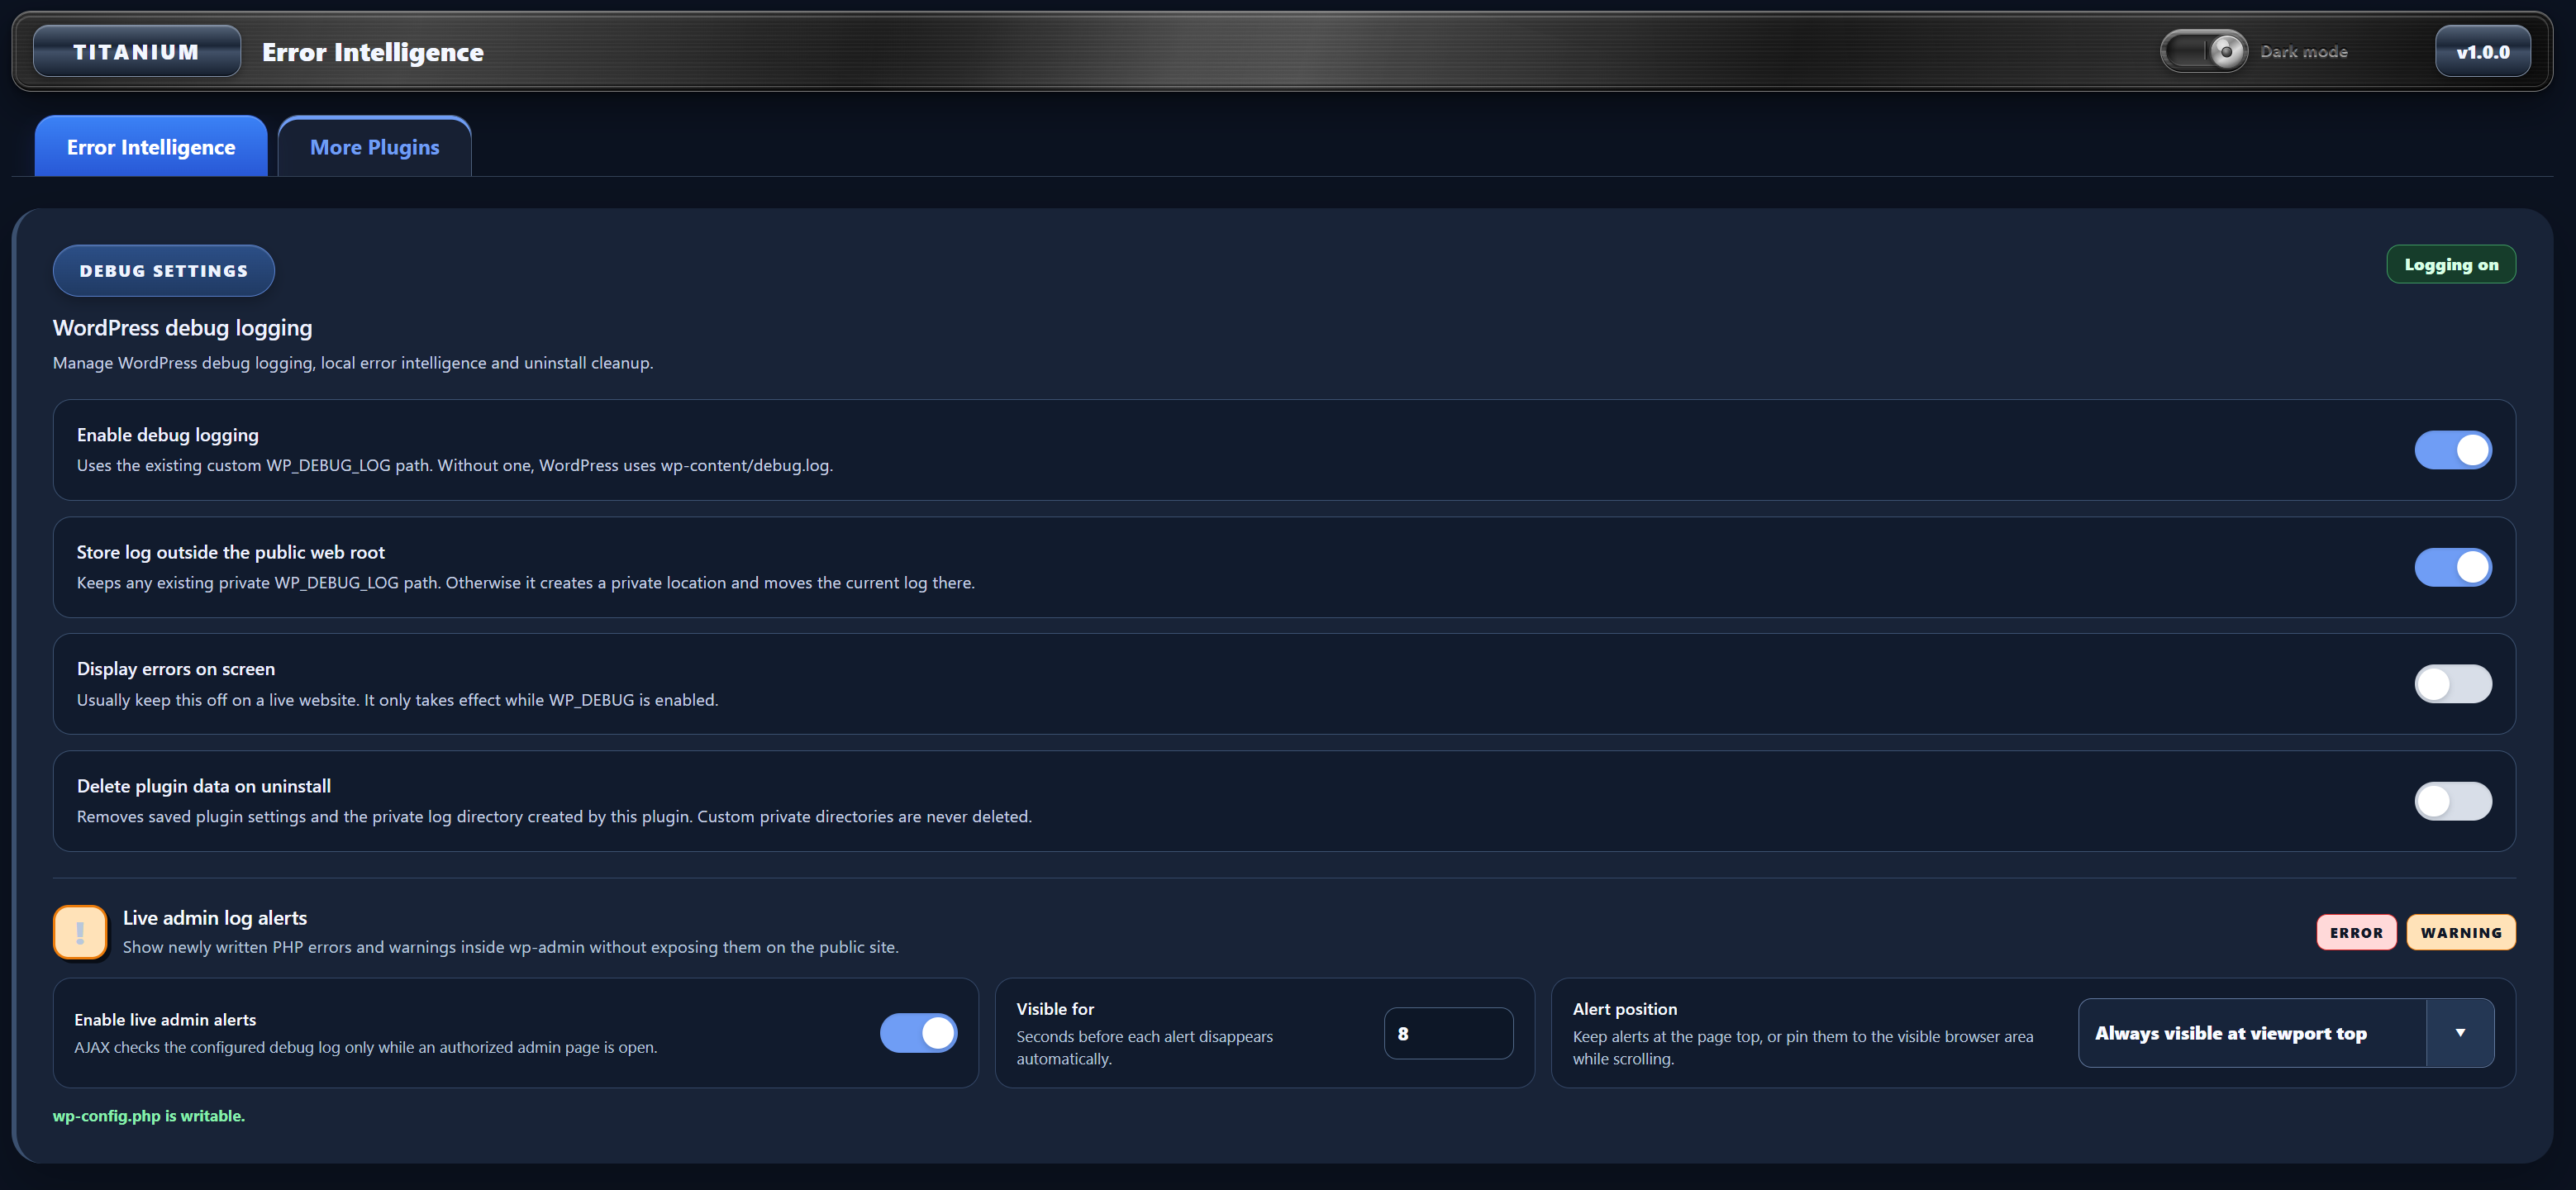
- Enables or disables WordPress debug logging and on-screen error display.
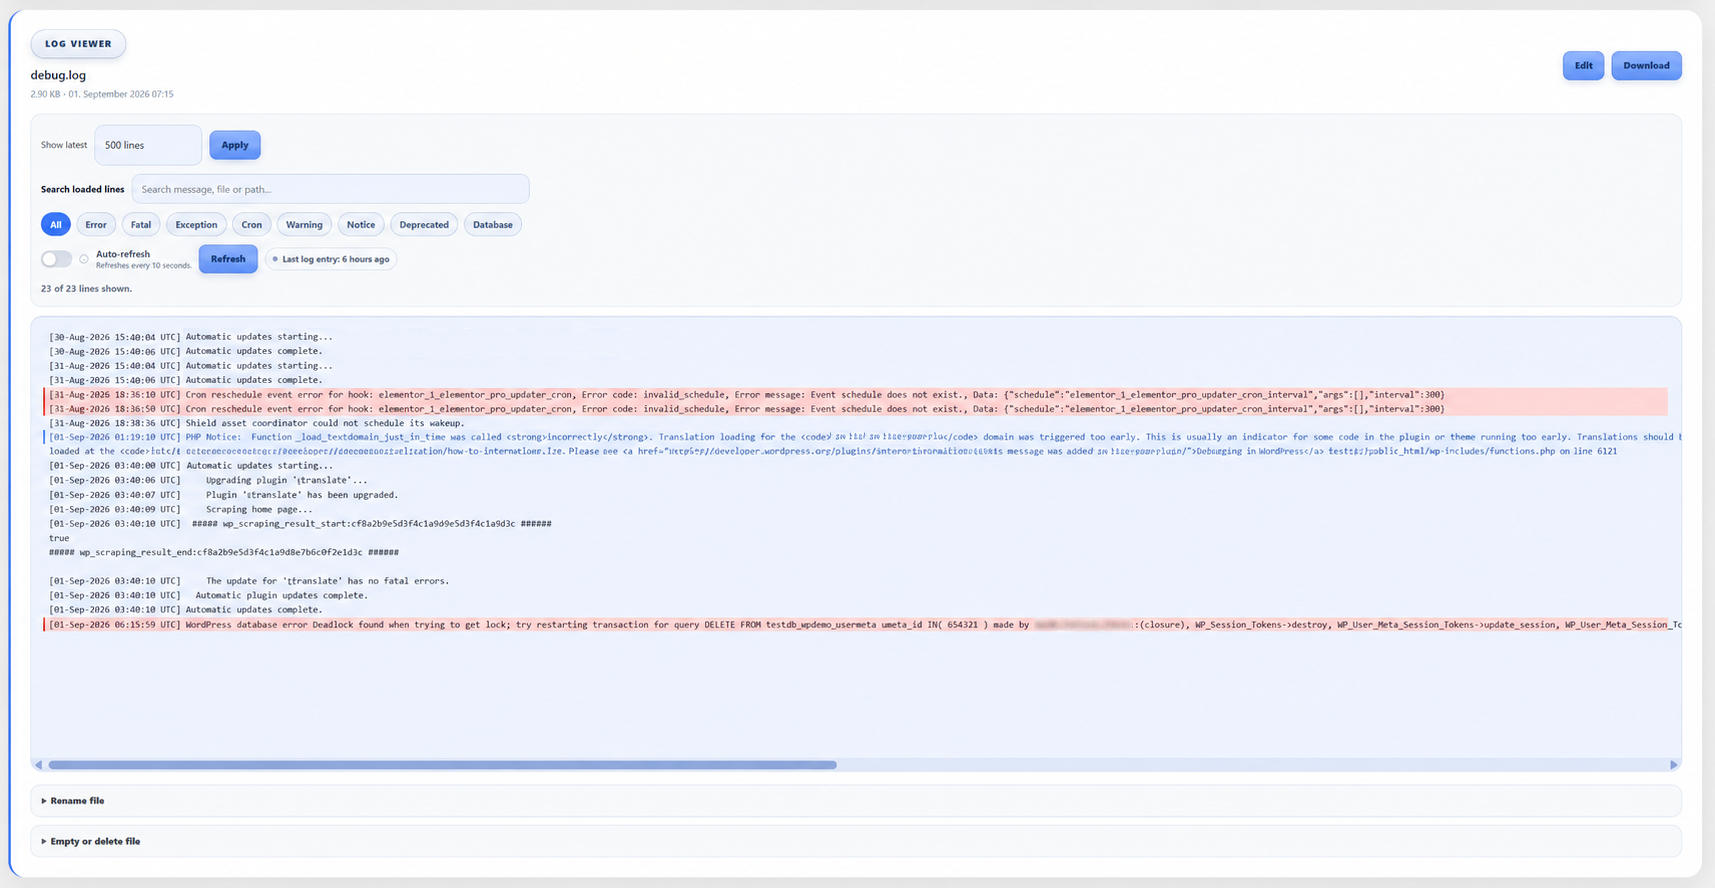
- Lists supported log and text files only in the configured directory; subdirectories are not scanned.
- Reads a bounded tail of large logs for the browser viewer.
- Searches and filters the currently loaded lines in the browser.
- Auto-refresh can wait for a configured log file that does not exist yet and load it when WordPress creates it.
- Renames, empties, deletes and downloads allowed log files through authenticated administrator actions.
- Includes a bounded browser editor for smaller files.
- Keeps the background monitor cursor aligned after primary-log edits, clears, renames and deletes.
- Optionally removes plugin data on uninstall.
- Never recursively deletes unrelated files from a private log directory.
titanium_error_intelligence_get_health_summary()
Local by Default
Titanium Error Intelligence does not send error history or request-impact data to a bundled external service and does not make remote version lookups. Its diagnostics data is stored in the WordPress installation.
安装:
- Upload the
titanium-error-intelligencefolder to/wp-content/plugins/, or install the ZIP through Plugins > Add Plugin. - Activate Titanium Error Intelligence.
- Open Titanium Error Intelligence in wp-admin.
- Enable WordPress debug logging if it is not already enabled.
- Run the Monitoring Self-Test to verify the local pipeline.
屏幕截图:
常见问题:
Is this only a debug.log viewer?
No. The viewer is one tool in the plugin. The main diagnostics layer fingerprints and groups supported critical errors, analyses their frequency and timing, tracks source-version changes and correlates available request-impact context.
How does spike detection work?
The plugin keeps a bounded recent occurrence history. It compares the recent 15-minute activity with the retained preceding rate and requires multiple recent occurrences before an error can be labelled as a spike. A single isolated error is not considered a spike.
What is a periodic error?
When enough retained occurrences have a sufficiently stable interval, the plugin labels the grouped error as periodic and reports the approximate repeat interval. It reports the timing pattern only; it does not claim that a particular cron job caused the error unless that information is independently known.
What does the Request Impact Map store?
When context is available, it can store the execution context, HTTP method, privacy-reduced route shape, logged-in/guest classification, timestamp and bounded diagnostic metadata used for local correlation. It does not store IP addresses, URL query strings, POST bodies, usernames or user IDs.
Why do some errors have no request context?
Request context can be attached only when the plugin is already running in the request and PHP reaches the registered shutdown handler. Very early failures, failures that prevent local storage, and errors found only in an existing log may not have matching context.
Does the plugin send error data to an external service?
No. Error intelligence, history, request context and self-test data stay in the WordPress installation. The Site Watch integration is a local PHP function that another installed Titanium component can call.
Does it work with a private WP_DEBUG_LOG path?
Yes, provided PHP has permission to read the configured directory and file. File-changing actions also require write permission.
Does the plugin modify wp-config.php?
Only when an administrator uses the debug configuration switches. The plugin changes only WP_DEBUG, WP_DEBUG_LOG and WP_DEBUG_DISPLAY. Existing custom private WP_DEBUG_LOG paths are preserved.
Does the self-test generate a PHP error?
No. It writes a uniquely identified harmless marker through PHP's normal error-log channel and verifies that the marker can be read from the configured log. The marker is not treated as a critical error by the intelligence scanner.
How does WordPress Multisite work?
Titanium Error Intelligence must be network activated. Intelligence data and settings are network-scoped, request context can be captured across sites, and one five-minute scanner runs from the main site. The plugin admin UI is available from the main site's wp-admin.
更新日志:
- Initial release