
Health and Server Condition - Site Health Reports & Monitoring
详情介绍:
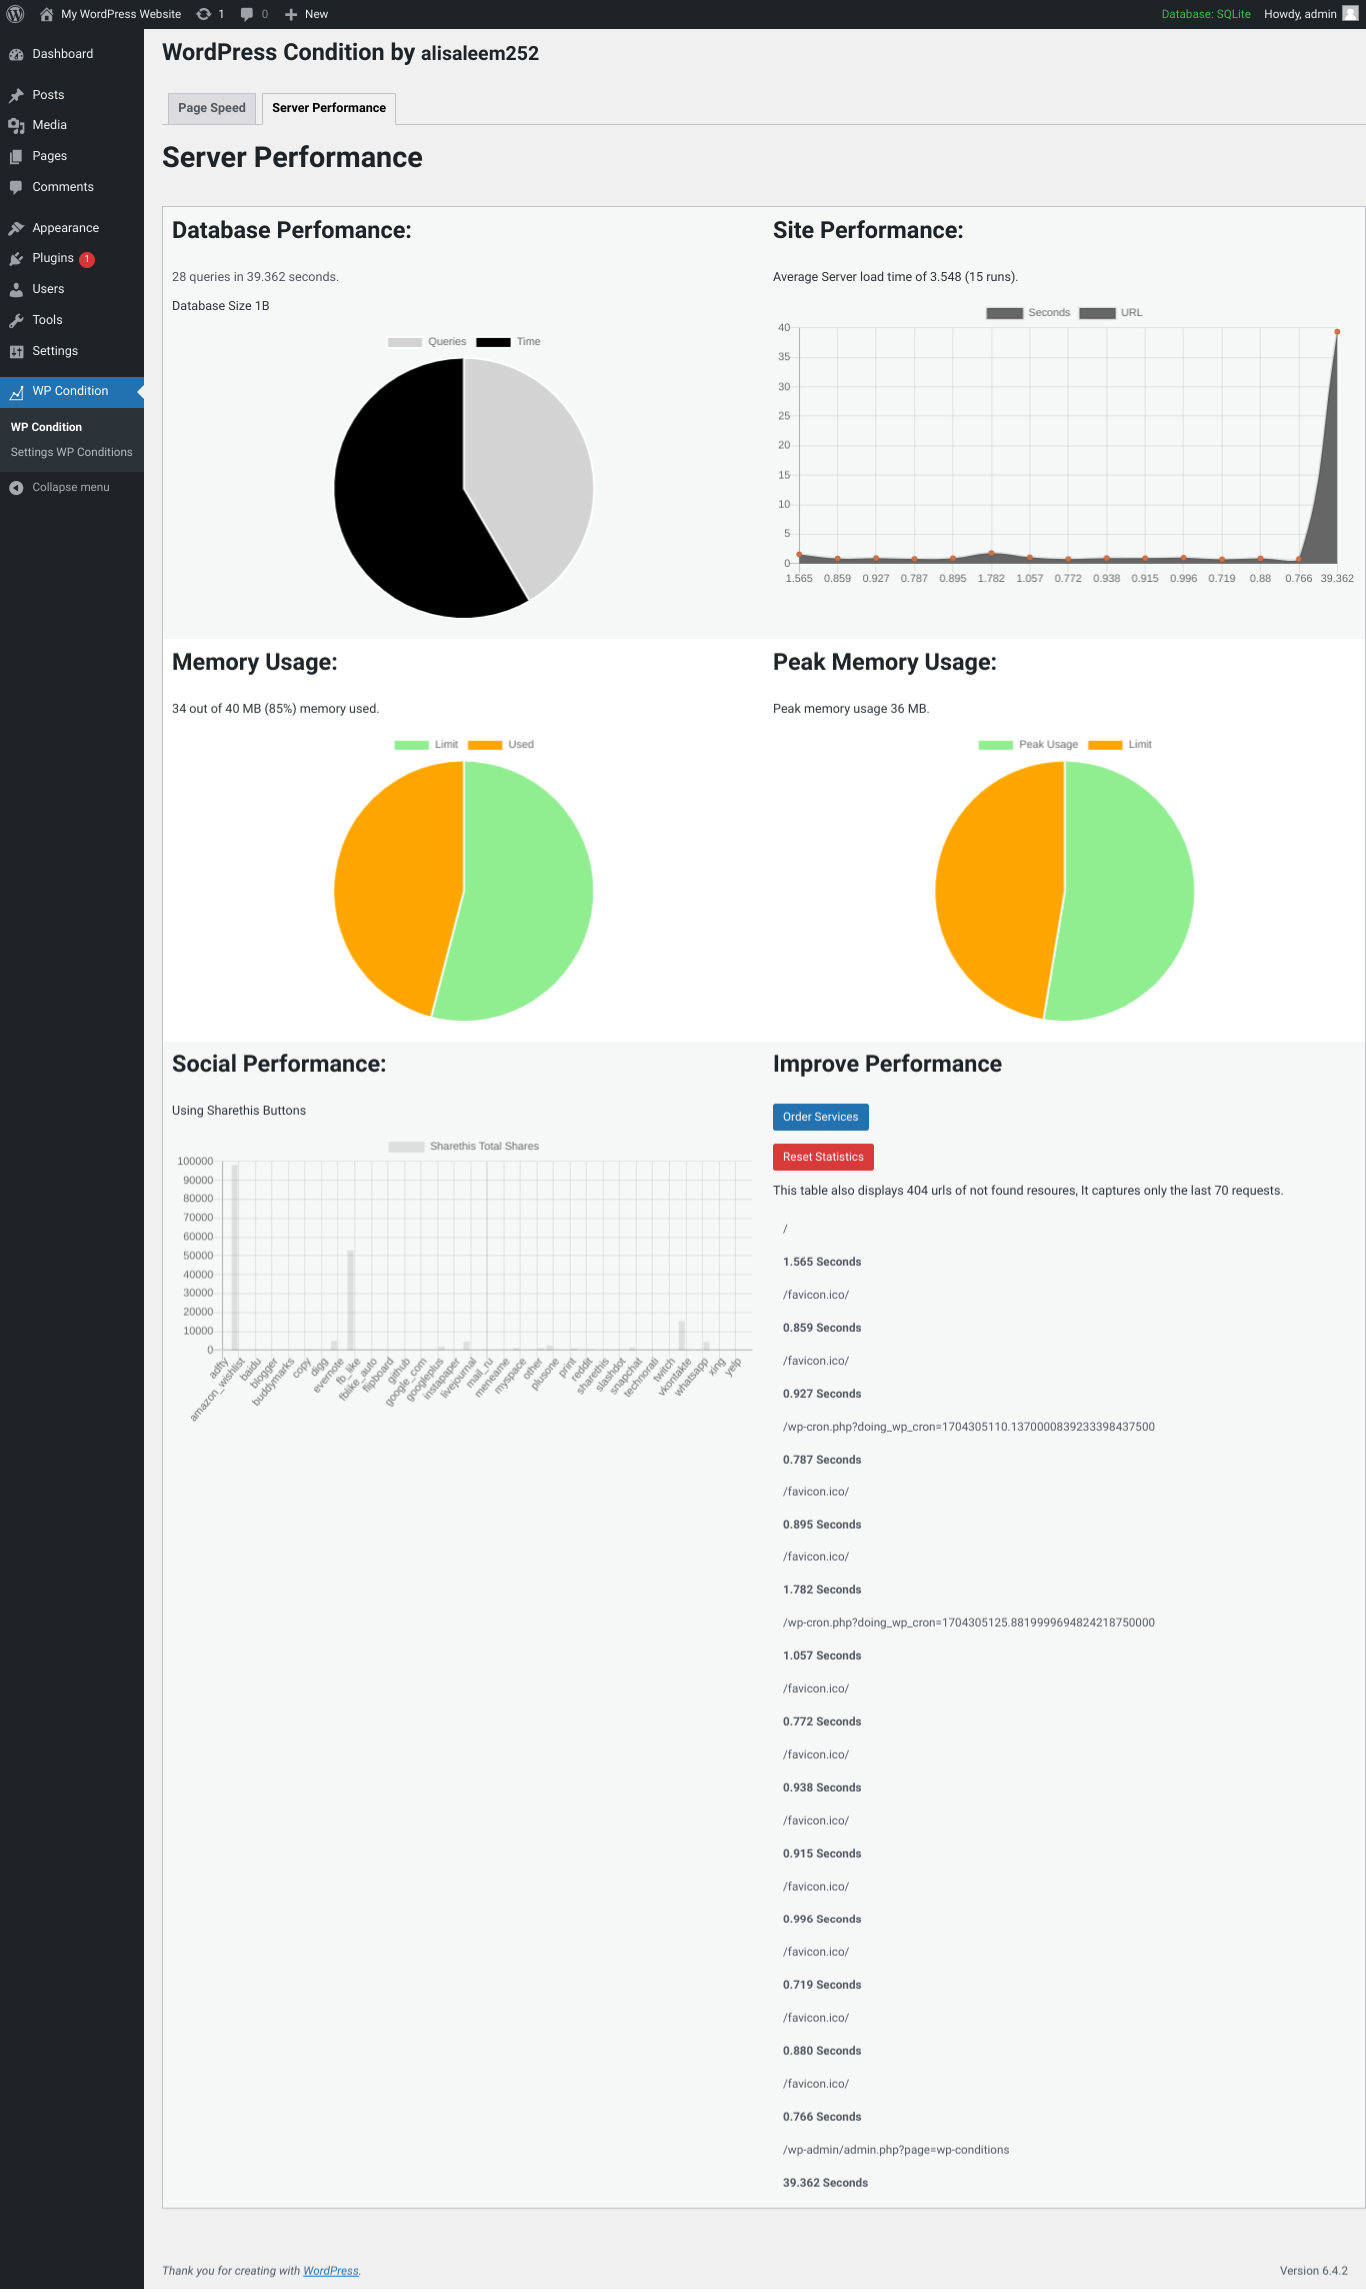
- Server & hosting - PHP version against the official end-of-life calendar, memory limit, execution time, upload limit, PHP extensions, disk space, server load and RAM (Linux), HTTPS and SSL certificate expiry.
- WordPress - core/plugin/theme updates, plugins paused after a crash, fatal PHP errors (with the plugin or theme that caused them), WP-Cron health, debug mode, automatic updates, search-engine visibility, permalinks.
- Database - server version, query response time, size, autoloaded options (and the biggest offenders), expired transients, spam/auto-draft/revision clutter, MyISAM tables, character set.
- Security - WordPress core files verified against the official WordPress.org checksums, publicly readable backups/logs/config copies, wp-config.php permissions, "admin" username, number of administrators, risky open registration, dashboard file editor.
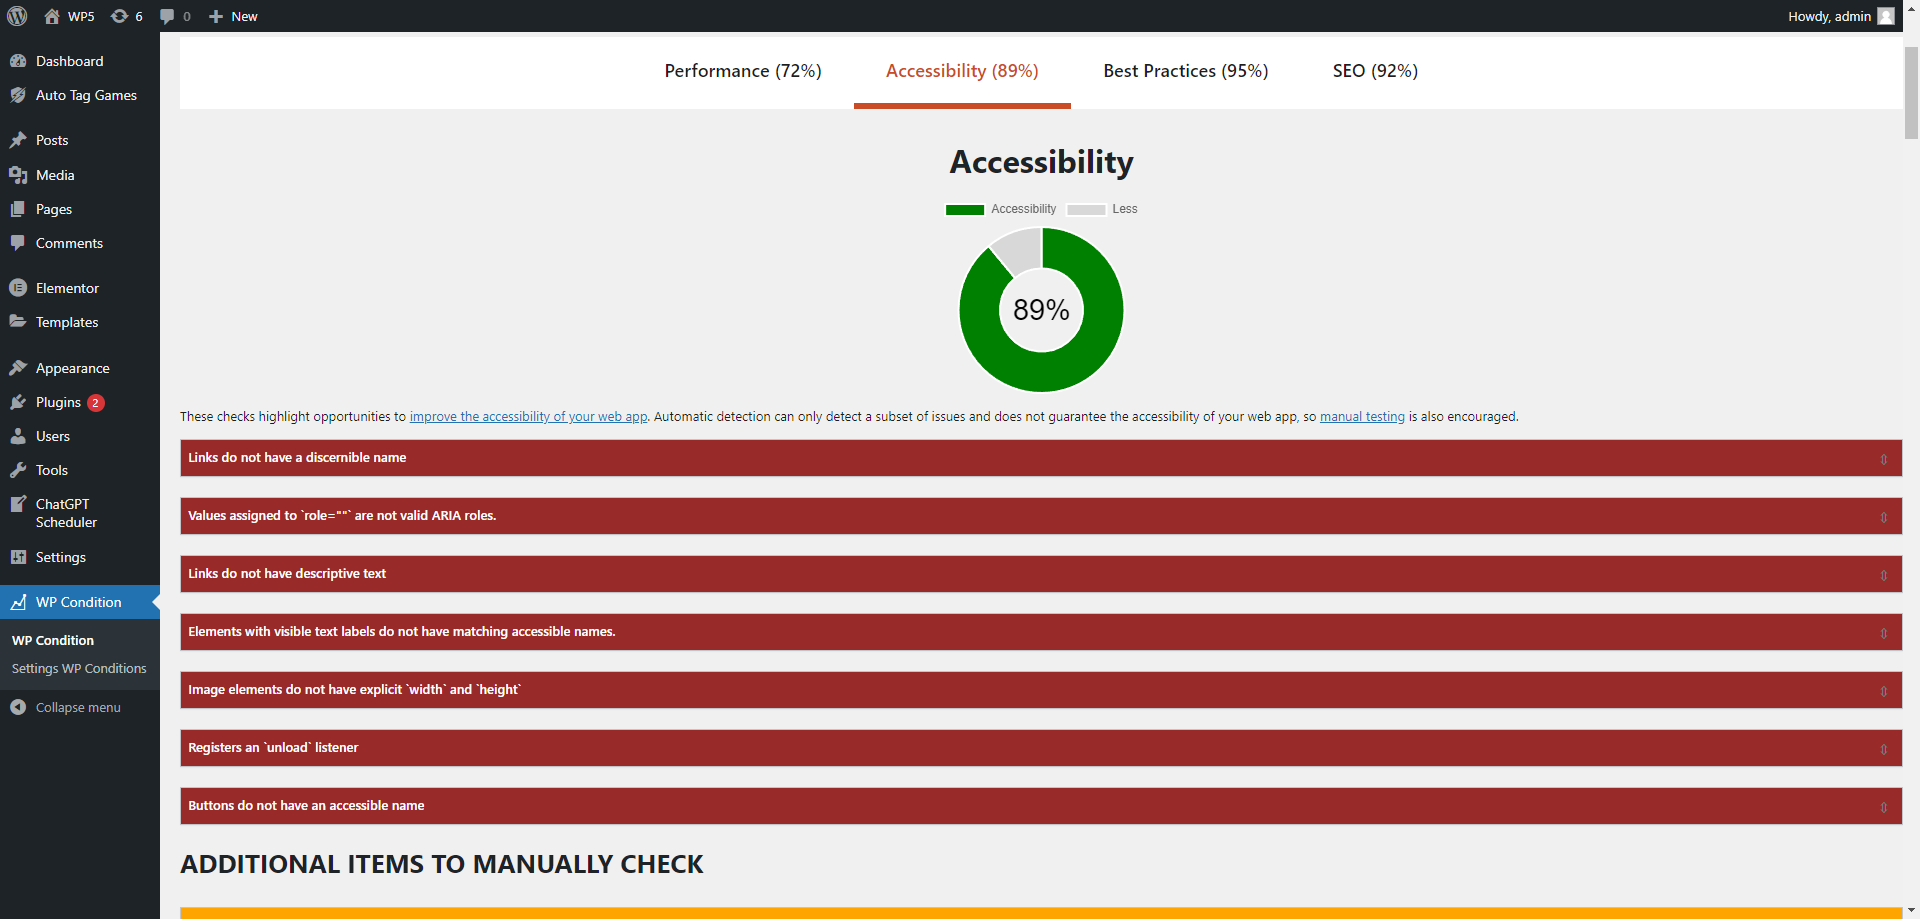
- Performance - the homepage as a visitor sees it (status, response time, compression), page cache detection, OPcache, object cache, real page generation time, queries and memory measured on real visits, optional Google PageSpeed.
- Daily, weekly or monthly HTML email report (with a plain-text version) to one or several addresses: score and change since the last report, what needs attention with fixes, availability, real page speed, slowest pages, pending updates, server snapshot, fatal errors.
- Critical alerts checked hourly - site unreachable, SSL expiring, disk almost full, modified core files, fatal errors, plugin crashes and more. One email per new issue, never a flood.
- Preview exactly what recipients will see, send a test to any address, and review the send log.
安装:
- Upload the plugin to
/wp-content/plugins/or install it from the Plugins screen. - Activate it. The first scan runs automatically.
- Open Health & Server in the admin menu.
- Go to Settings to choose who receives the reports and how often, then press Send test on the Reports tab.
屏幕截图:



常见问题:
Reports are not arriving.
WordPress cannot send mail from some servers. Install an SMTP plugin such as WP Mail SMTP and press "Send test" again. The Reports tab shows the exact error in the send log.
How does the score work?
Every check has a weight. Passed checks earn full points, warnings half; informational items are not scored. One critical issue caps the score at 79, three or more at 59.
Why does the score say "information" for HTTPS or caching on my local site?
On local and development sites (localhost, .local, .test, private IPs or WP_ENVIRONMENT_TYPE local/development) production-only checks are not counted against you.
Does it slow my site down?
No. Visitor sampling records a few numbers after the page was already built, only for a share of visits, in a single small option. Scans run in the background once an hour.
Do the hourly checks need WP-Cron?
Yes. On low-traffic sites WP-Cron only runs when someone visits. If you use a real server cron (DISABLE_WP_CRON) make sure it calls wp-cron.php every few minutes. The plugin tells you if scheduled tasks are late.
Is "availability" real uptime monitoring?
It is a self-check: your site requests its own homepage every hour. It reliably catches broken sites, but it cannot see problems that block outside visitors only (DNS, firewall in front of the server). Use an external monitor for that in addition.
I upgraded from version 4. What happens to my data?
The old PageSpeed dumps and load-time logs are removed. If you had entered your own Google API key it is kept; the shared default key that older versions shipped is not used any more.
更新日志:
- Complete rewrite as a health and monitoring plugin.
- New: 0-100 health score with 40+ real server, WordPress, database, security and performance checks and exact fixes.
- New: scheduled email reports (daily/weekly/monthly) and instant critical alerts, with preview, test send and send log.
- New: real visitor speed sampling, slowest pages, fatal PHP error capture with the culprit plugin/theme.
- New: hourly history - availability, response time, database size, disk space and score trends.
- New: core file integrity check, exposed-file check, SSL expiry, WP-Cron health, plugin-crash detection.
- New: safe database cleanup and autoload analysis.
- Changed: Google PageSpeed is now optional, uses your own API key, and keeps history.
- Fixed: removed the front-end option write on every page view, the bundled shared API key and the discontinued social-share counters.
- Removed: bundled Chart.js (charts are now lightweight inline SVG).
- Added Mobile Page Speed Analysis Support
- Added Google Page Speed Analysis
- Initial release