WP e-Commerce Recommendations
| 开发者 | nToklo |
|---|---|
| 更新时间 | 2013年11月26日 22:55 |
| PHP版本: | 3.5 及以上 |
| WordPress版本: | 3.7.1 |
| 版权: | GPLv2 or later |
| 版权网址: | 版权信息 |
详情介绍:
- Recommendations are proven to increase sales and, until now, have not been affordable or easy for small business to make use of
- nToklo's service is free for up to 100,000 events per day
- Analytics console for your nToklo account shows user activity, best-performing recommendation location, purchase funnel and busiest times of day / week / month
- Plugin installation is quick and easy - you can create your (required) nToklo account without leaving your Wordpress admin panel
- Recommendations or charts can be displayed on your site from WP's admin with widgets - no technical knowledge required
- Seven styles and colour schemes to choose from
- With some technical knowledge, widgets can be included in any area of the site with a function call in your templates
安装:
- You can either install via the Plugins > Add new menu item in your WordPress admin or download recommendations-for-wp-ecommerce.zip from the WordPress plugin directory (if you’ve done the latter, you’ll need to upload this file to the /wp-content/plugins/ directory of your store and then unzip it.
- Activate the plugin through the 'Plugins' menu in WordPress.
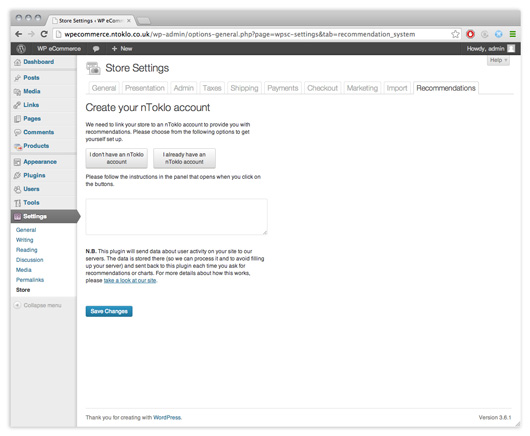
- Create an nToklo account as instructed on the "Settings > Store > Recommendations" tab.
- Once you’ve set up your nToklo account, you must activate the account by clicking on the link that you receive in your verification email.
- Once that’s done you need to let people use your site for at least 24 hours. Please note that we cannot show you recommendations or charts until we have some user activity posted to our servers.
- Place widgets on your pages using either the widget menu, or by using function calls like: do_shortcode(["ntoklo_chart", "max_items=5&widget_color=orange"]);
屏幕截图:
常见问题:
Why do I need an account with nToklo?
You need one because user activity data is sent from your site to our servers and stored there, so that we can process the data, understand your user behaviour, and send back recommendations when you request them. The computations have to be run on our servers and, with up to 100,000 events per day supported for free accounts, you really don't want to have all of that data taking up disk space on your server.
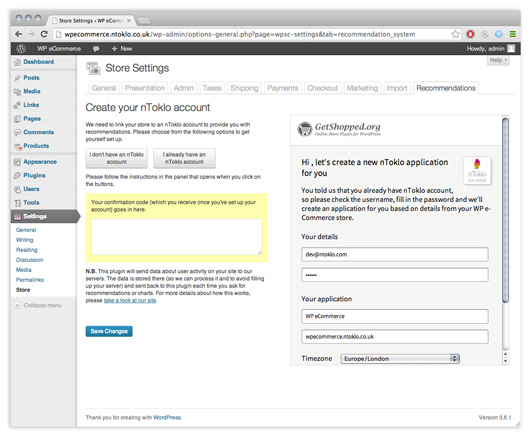
How do I set up an nToklo account?
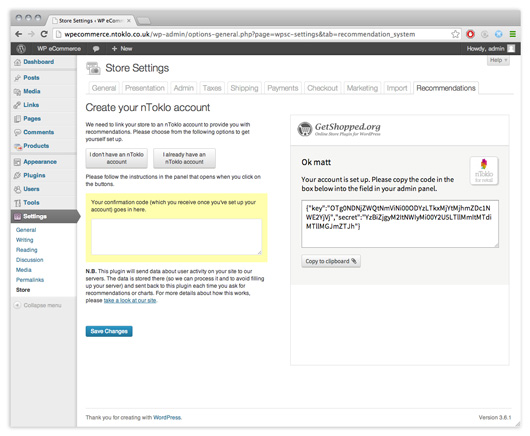
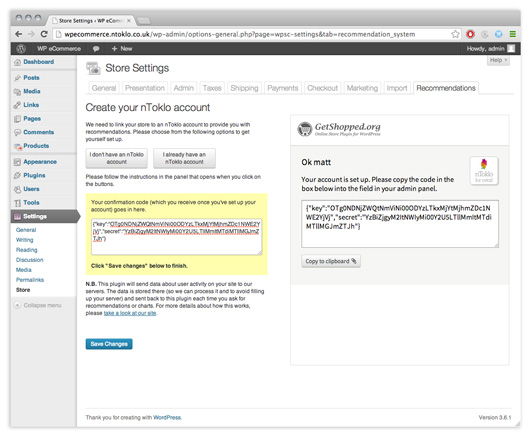
From within the Wordpress admin page, as the first step after activating the plugin. Just go to /wp-admin/options-general.php?page=wpsc-settings&tab=recommendation_system. You'll see two buttons - one for new customers and one for customers who already have an nToklo account. Clicking one of these will display a panel with a registration form. Complete the form and you'll see a confirmation page with a code for you to copy from the panel into the textarea in your settings page, which is highlighted in a yellow panel.
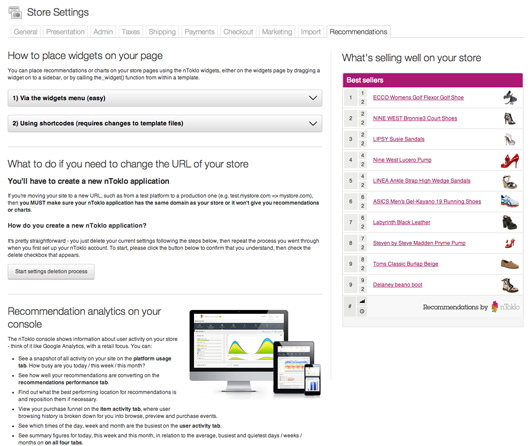
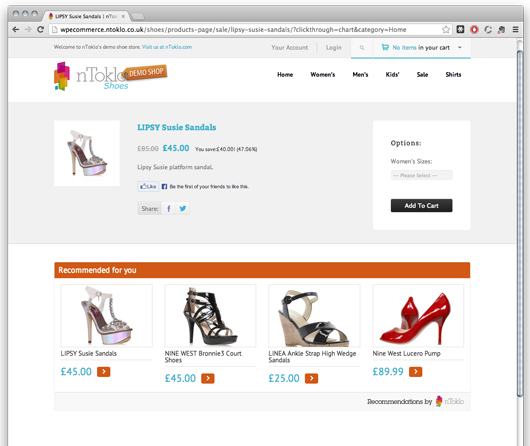
How do I put recommendations or a chart on my page?
Assuming that you have already set up an account You can place recommendations or charts on your store pages using the nToklo widgets, either on the widgets page by dragging a widget on to a sidebar, or by using shortcodes.
1) Via the widgets menu
This is the easiest way and is recommended for non-technical users. Go to the Appearance > Widgets page and drag either or both of the WPeC widgets on to your sidebar (WPeC chart or WPeC recommendations). Next you can configure settings for each widget and preview them on your store.
2) Using shortcodes
This method gives you greater flexibility when positioning your widget but is slightly more complicated For recommendations, you should call: [ntoklo_recommendations $arguments] Where $arguments can be any of the following: Key Accepted values Defaults title String Recommended for you max_items An integer between 1 - 9. Please note that 2 and 3-column grids will only display multiples of 2 and 3 respectively. 6 layout
- row
- column_image_above
- column_image_right
- grid_2_column
- grid_3_column
- chart
- plum
- pink
- orange
- green
- blue
- dark_blue
- DAILY
- WEEKLY
- plum
- pink
- orange
- green
- blue
- dark_blue
How do I change the style of the widget?
There are six layout options for the recommendations widget, and one for the chart widget, as well as 6 colour schemes available to both. You can also alter the size of the images to suit your site design.
I've set up an account and placed widgets on my page, but I can't see recommendations or charts - why not?
- Have you waited at least 24 hours since installing the plugin?
- Has there been any user activity on your site?
My recommendations don't make sense - why not?
If there is very little activity on your site, we won't know very much about your product catalogue or user behaviour, so we have to make recommendations based on what we do know.
Yesterday I saw recommendations on my site but now there aren't any - why not?
If there was no activity on your site yesterday, then we can't serve recommendations
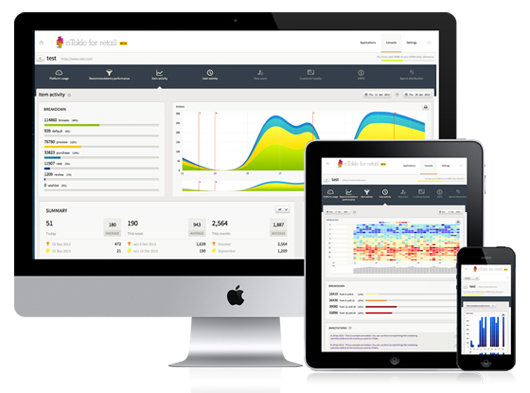
How do I see what's been happening on my site?
The nToklo console at https://console.ntoklo.com/login will show you analytics or user activity on your site, including: The nToklo console shows information about user activity on your store - think of it like Google Analytics, with a retail focus. You can:
- See a snapshot of all activity on your site on the platform usage tab. How busy are you today / this week / this month?
- See how well your recommendations are converting on the recommendations performance tab.
- Find out what the best performing location for recommendations is and reposition them if necessary.
- View your purchase funnel on the item activity tab, where user browsing history is broken down for you into browse, preview and purchase events.
- See which times of the day, week and month are the busiest on the user activity tab.
- See summary figures for today, this week and this month, in relation to the average, busiest and quietest days / weeks / months on on all four tabs.
- Keep track of real-world events such as promotional campaigns, overlaying the data on the graphs using our annotations.
更新日志:
- Initial commit