WP Flot
| 开发者 | YSH |
|---|---|
| 更新时间 | 2016年8月9日 23:21 |
| PHP版本: | 2.5 及以上 |
| WordPress版本: | 4.4 |
| 版权: | GPLv2 |
| 版权网址: | 版权信息 |
详情介绍:
This plugin adds shortcodes for line, pie and bar charts, created with the Flot javascript library.
For more information on Flot see their website.
用法
Use the [linechart], [piechart] or [barchart] shortcodes, with the data enclosed between the tags (see example). You can further change the appearance of your chart by using a number of attributes, a full list of which can be seen here. If you have the Shortcake plugin enabled, you can add the charts using the 'Add Media' button.
The javascript file is not loaded on all pages to reduce pageload, but will be automatically added to all pages using the shortcodes after it has been loaded once. Alternatively, you can set a custom field 'flot' to 'yes'.
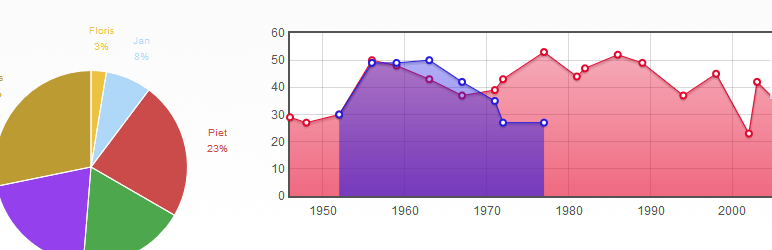
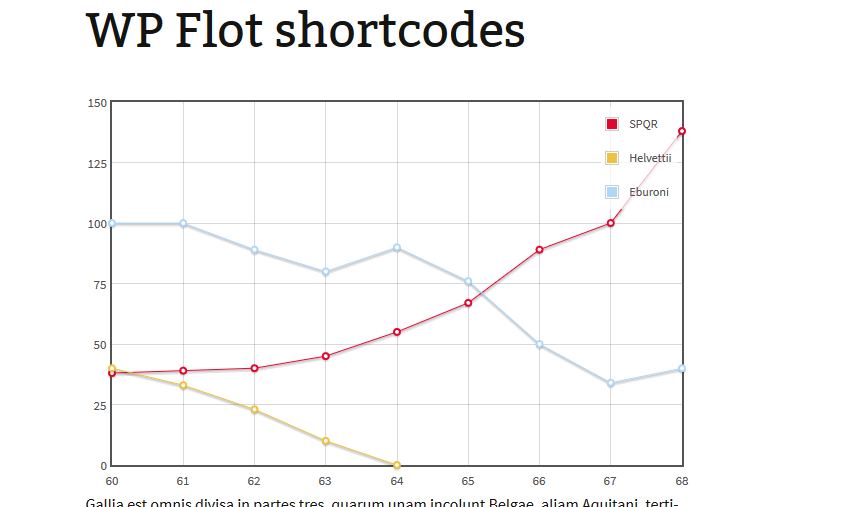
Linechart example:
[linechart minx="1950" maxx="1965" miny="0" maxy="100" steps="false" fill="true" points="false" legend="true"] { label: "Series 1", data: [[1963, 43], [1959, 48], [1956, 50], [1952, 30]] }, { label: "Series 2", data: [[1952, 30], [1956, 49], [1959, 49], [1963, 50]] } [/linechart]
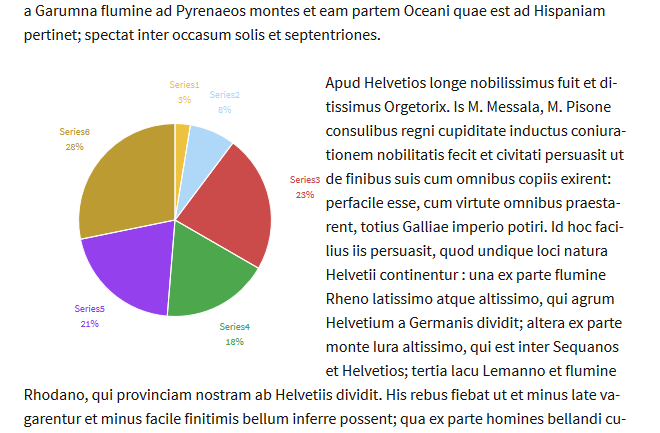
Pie chart example:
[piechart donut="0.5"] { label: "Series1", data: 10}, { label: "Series2", data: 30}, { label: "Series3", data: 90}, { label: "Series4", data: 70}, { label: "Series5", data: 80}, { label: "Series6", data: 110} [/piechart]
Bar chart example:
[barchart] { label: "Bars", data: [[1, 6],[2, 4],[3, 5],[4, 6],[5, 14],[6, 5],[7, 12]] }, { label: "More bars", data: [[1.5, 3],[2.5, 3],[3.5, 15],[4.5, 3],[5.5, 10],[6.5, 11],[7.5, 10]] } [/barchart]
Please note that in Flot, a bar chart reacts like a line chart. If you have two data series with similar positions on the x-axis, they will overlap instead of showing side by side. Also, you need both values to be a number, no text.
安装:
Upload the plugin to your /wp-contents/plugins/ directory, then activate via the plugin menu.
屏幕截图:
常见问题:
My chart doesn't show up
- Make sure your data doesn't contain any errors, such as a misplaced comma. The web inspector of your browser can help you with this.
- Check the source of the page, if the javascript contains an html tags, such as p or br, there probably is a problem with the wpautop filter.
- If this is the first time you view your page, try reloading. The necessary files are not included on the first time the page is loaded.
I want a fancy graph not supported by the shortcodes
Flot supports much more advanced graphs than are supported with these shortcodes, but you can add these manually. If you set the custom field 'flot' to 'yes', the plugin will load Flot for you. You can then just add your own javascript code in the editor. Check the Flot websites for a number of examples.
更新日志:
- 0.1 - First version
- 0.1.1 - Problems with the style of the legend fixed.
- 0.1.2 - Added barcharts.
- 0.1.3 - Added translation: Dutch. Small bug fixes.
- 0.1.4 - No longer needed to set shortcodes. Reduced size for javascript files. Graphs will show properly on home pages, categories etc.
- 0.1.5 - Update to Flot 0.8.3.
- 0.2 - Support for Shortcake, a plugin to make adding shortcodes easier. Unfortunately, because of the Javascript requirement for the charts, they won't properly preview in TinyMCE.
- 0.2.1 - Update for Shortcake 0.3.
- 0.2.2 - Update for Shortcake 0.4.