Advanced Charts for Gutenberg Blocks Editor
| 开发者 |
shamim496
selimmw bdthemes |
|---|---|
| 更新时间 | 2026年5月21日 17:22 |
| 捐献地址: | 去捐款 |
| PHP版本: | 7.4 及以上 |
| WordPress版本: | 7.0 |
| 版权: | GPLv2 or later |
| 版权网址: | 版权信息 |
详情介绍:
- Improve comprehension of complex information
- Increase reader engagement by up to 80%
- Boost memory retention of key facts and figures
- Enhance the professionalism of your website
- Simplify decision-making for your audience
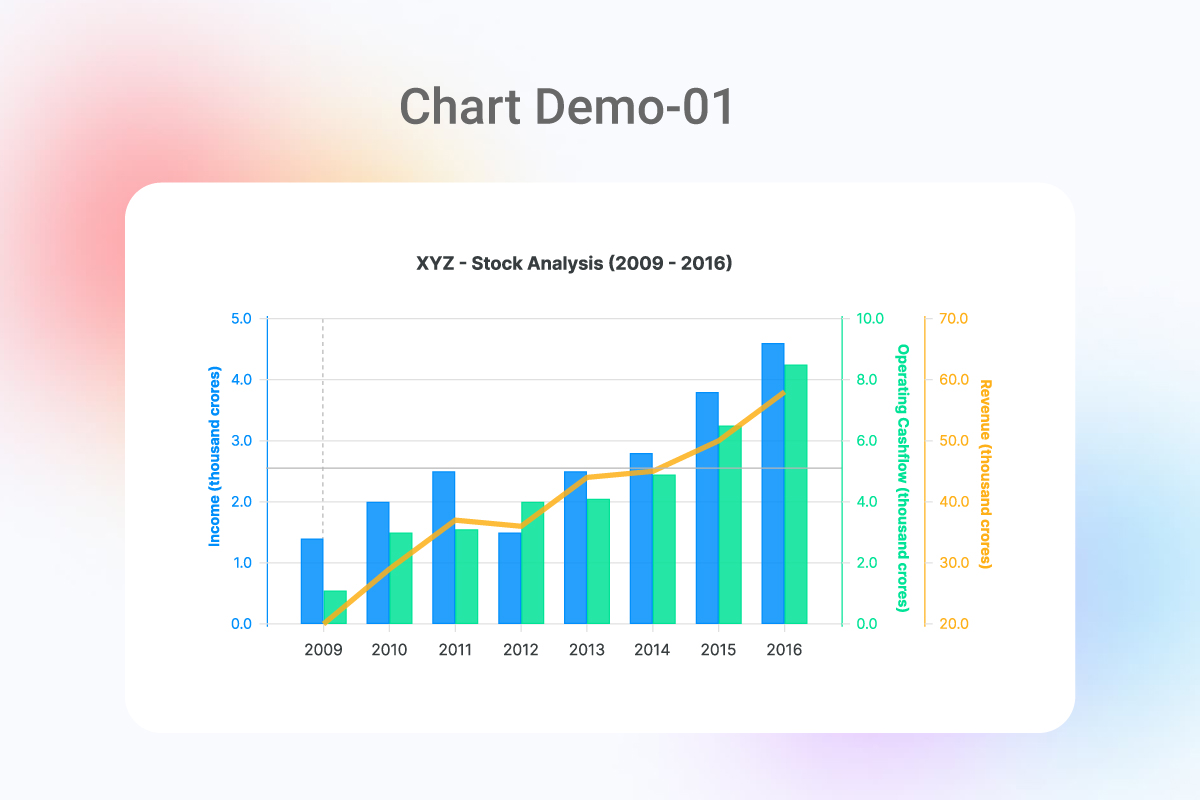
- Bar Charts: Perfect for comparing values across different categories
- Line Charts: Ideal for showing trends and changes over time
- Pie & Donut Charts: Excellent for displaying proportional data and percentages
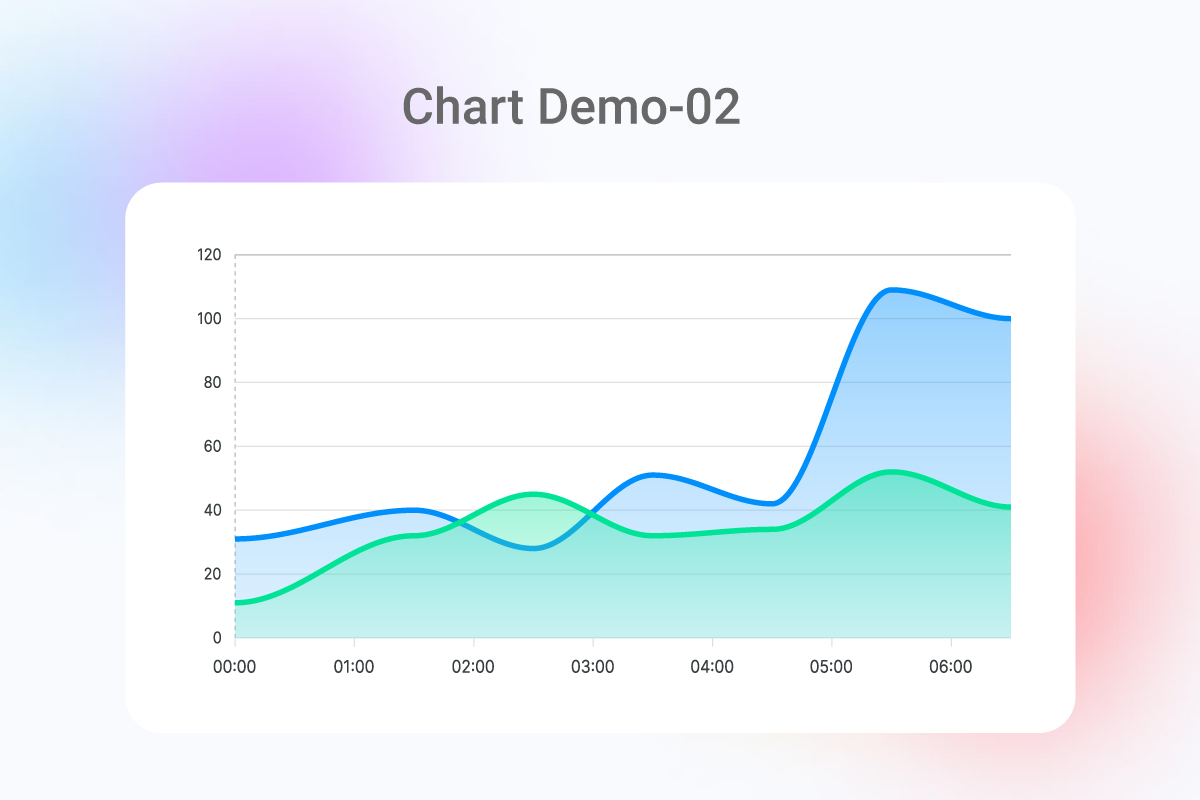
- Area Charts: Great for showing cumulative totals across categories
- Radar Charts: Best for comparing multiple variables at once
- Polar Area Charts: Useful for highlighting variations in a cyclical dataset
- Scatter Plots: Ideal for showing relationships between variables
- Bubble Charts: Perfect for representing three dimensions of data
- Horizontal Bar Charts: Alternative layout for comparing categories
- Stacked Charts: Show composition changes over time or categories
- Rich Color Palettes: Choose from predefined professional color schemes or create your own custom palette to match your brand
- Comprehensive Typography Controls: Customize titles, labels, legends, and tooltips with different fonts, sizes, and styles
- Flexible Axis Configuration: Fine-tune your X and Y axes with custom ranges, step sizes, and formatting options
- Interactive Legend Options: Position, style, and control interactivity of chart legends
- Responsive Behavior Settings: Ensure your charts look perfect on all devices from desktops to smartphones
- Animation Controls: Select from various animation types and durations for chart rendering
- Advanced Tooltip Customization: Create informative, styled tooltips that appear on hover
- Grid and Scale Options: Adjust background grids, ticks, and padding for optimal readability
- Automatically Responsive Charts: Charts dynamically resize to fit any screen size
- Touch-Optimized Interactions: Mobile-friendly tooltips and controls
- Configurable Mobile Displays: Option to show simplified versions on smaller screens
- Fast Loading Times: Optimized code ensures charts load quickly on mobile connections
- Accessibility Compliance: Charts work with screen readers and keyboard navigation
- Simple Table Interface: Enter data directly into an intuitive table within the block editor
- CSV Import: Upload CSV files to instantly create charts from existing data
- Spreadsheet Copy/Paste: Copy data from Excel, Google Sheets, or other spreadsheet programs
- WordPress Database Integration: Connect to your database to display dynamic site data
- External API Support: Pull live data from external APIs for real-time charts
- Reusable Chart Templates: Save chart configurations for consistent reporting
- Data Update Controls: Set automatic refresh intervals for dynamic data sources
- Lightweight Core: Minimal impact on page load times
- Efficient Rendering: Charts render quickly even with large datasets
- Lazy Loading Option: Charts can load only when scrolled into view
- Caching System: Reduces server load for dynamic data charts
- Optimized Assets: CSS and JavaScript files are minified and efficiently loaded
- No jQuery Dependency: Modern vanilla JavaScript for better performance
- Server-Side Rendering: Option for faster initial page loads
- 100% On-Site Processing: All data visualization happens on your server
- No External Dependencies: Charts don't require connections to third-party services
- GDPR Compliance: No personal data is collected or shared
- Secure Data Handling: Safe processing of sensitive information
- Self-Hosted Solution: Complete control over your data and its presentation
- Native Block Editor Experience: Follows WordPress UI/UX patterns for intuitive use
- Theme Compatibility: Works perfectly with any WordPress theme
- Plugin Friendly: No conflicts with popular WordPress plugins
- Multi-Site Compatible: Functions correctly in WordPress network installations
- Classic Editor Support: Shortcode implementation for Classic Editor users
- Translation Ready: Supports internationalization for global users
- Role-Based Access Controls: Restrict chart creation and editing to specific user roles
- Business Websites: Present financial results, growth metrics, and market analysis
- Educational Institutions: Visualize research findings, student demographics, and learning outcomes
- News Organizations: Create informative data journalism with embedded charts
- Government Agencies: Display budget allocations, program results, and public data
- Non-Profits: Illustrate impact metrics, donation allocation, and cause-related statistics
- Healthcare Providers: Share health data, treatment outcomes, and research findings
- Marketing Professionals: Showcase campaign results, audience demographics, and ROI
- Personal Blogs: Enhance content with data-backed visualizations
- E-commerce Stores: Display product comparisons, sales trends, and customer feedback
- One-Click Image Export: Download charts as high-quality PNG or SVG images
- PDF Export: Generate PDF documents containing your charts
- Social Media Optimization: Charts are designed for perfect social sharing
- Embed Codes: Generate embed codes to share your charts on other websites
- Print-Friendly Versions: Charts automatically optimize for printed media
- Data Download: Allow visitors to download the underlying chart data
- Comprehensive Documentation: Detailed guides for every feature
- Video Tutorials: Step-by-step visual instructions
- Sample Templates: Pre-built chart configurations for quick starts
- Regular Updates: New features and improvements based on user feedback
- Dedicated Support: Our team is ready to help solve any issues
- User Community: Share tips and tricks with fellow users
- Developer Resources: APIs and hooks for custom extensions
- Built on Chart.js: Industry-standard JavaScript charting library
- Block Editor Native: Fully embraces WordPress's future direction
- Regular Updates: Continuously enhanced with new features
- Structured Data Support: Charts can include Schema.org markup for better SEO
- Web Standards Compliant: Follows current HTML5, CSS3, and ES6+ standards
- Optimized for Core Web Vitals: Helps maintain excellent page experience scores
- Install the plugin from the WordPress repository
- Add a new chart block to any post or page
- Enter your data or import from a CSV file
- Customize the appearance to match your needs
- Publish and impress your visitors
- Multiple Chart Types: Choose from bar charts, line charts, pie charts, and more.
- Fully Customizable: Customize chart colors, titles, axes, labels, and more.
- Responsive Design: Charts automatically adjust to fit any screen size.
- Data Inputs: Easily input data manually or upload CSV files for automatic chart generation.
- Interactive Charts: Hover effects, tooltips, and more.
- Live Data Integration: Integrate external APIs for live data charts (advanced users).
- Export Options: Allow users to download charts as images (PNG, SVG).
安装:
- Go to the WordPress dashboard
- Got to the Plugins > Add New
- Type "Charts" in the search box
- Click on "Install" button
- After install the plugin Activate the plugin
- Download Charts block plugin zip file from WordPress
- Go to site Dashboard > Plugins > Add New > Upload Plugins
- Select the Charts zip file and proceed to install
- Activate Charts.
屏幕截图:
常见问题:
🤔 How do I add a chart to my post or page?
Simply add a new block, search for "Charts", select the Charts block, and insert it into your content. Then follow the customization options to create your perfect chart.
📊 What types of charts are available in this plugin?
We offer a wide variety of chart types including Bar Charts, Line Charts, Pie Charts, Donut Charts, Area Charts, Radar Charts, Polar Area Charts, Scatter Plots, Bubble Charts, and Horizontal Bar Charts.
📱 Are the charts responsive on mobile devices?
Yes! All charts created with our plugin automatically adjust to fit perfectly on any screen size, from desktop to tablet to mobile phones.
📂 How can I import data into my charts?
You can manually enter data directly into the intuitive table interface, import CSV files, copy/paste from spreadsheets like Excel or Google Sheets, or connect to external data sources via API (advanced users).
🎨 Can I customize the colors and appearance of my charts?
Absolutely! You have complete control over colors, fonts, labels, legends, tooltips, animations, and many other visual aspects to match your brand and website design perfectly.
🔄 Can I update my charts after creating them?
Yes, you can edit your charts at any time. Simply open the post or page containing the chart, select the chart block, and make your desired changes through the block settings.
💾 Can visitors download or share my charts?
Yes! The plugin includes options to allow visitors to download charts as PNG or SVG images, perfect for presentations or sharing on social media.
🚀 Does the plugin slow down my website?
No. We've optimized the plugin for performance with efficient code, lazy loading options, and minimal impact on page load times. Your charts will display beautifully without affecting site speed.
🔌 Does this plugin work with other WordPress plugins?
Yes! Charts is designed to work harmoniously with most WordPress plugins and themes. The plugin integrates seamlessly with the WordPress block editor.
🆘 Where can I get help if I have questions or issues?
We provide comprehensive documentation, video tutorials, and dedicated support to help you create amazing charts. Contact our support team if you encounter any difficulties.