
0 Day Analytics
| 开发者 | sdobreff |
|---|---|
| 更新时间 | 2026年5月28日 17:18 |
| PHP版本: | 7.4 及以上 |
| WordPress版本: | 7.0 |
| 版权: | GPLv3 or later |
| 版权网址: | 版权信息 |
标签
下载
详情介绍:
wp_remote_* calls made by WordPress core, themes, and
plugins. Records URL, method, status code, response time, triggering plugin,
user, and full request/response detail. Export to CSV for external analysis.
Advanced filtering by domain, plugin, status, and date range.
Mail Logger & Composer
Records every email sent through wp_mail() — including headers, body,
attachments, CC, and BCC — and stores it in a searchable log. View the
rendered email body, resend any logged email, or compose and send new emails
directly from the admin. Supports HTML and plain-text previews.
SMTP Configuration
Configure custom SMTP settings (host, port, encryption, username, password)
with a built-in test email tool. Optionally log SMTP debug output to the
WordPress debug log.
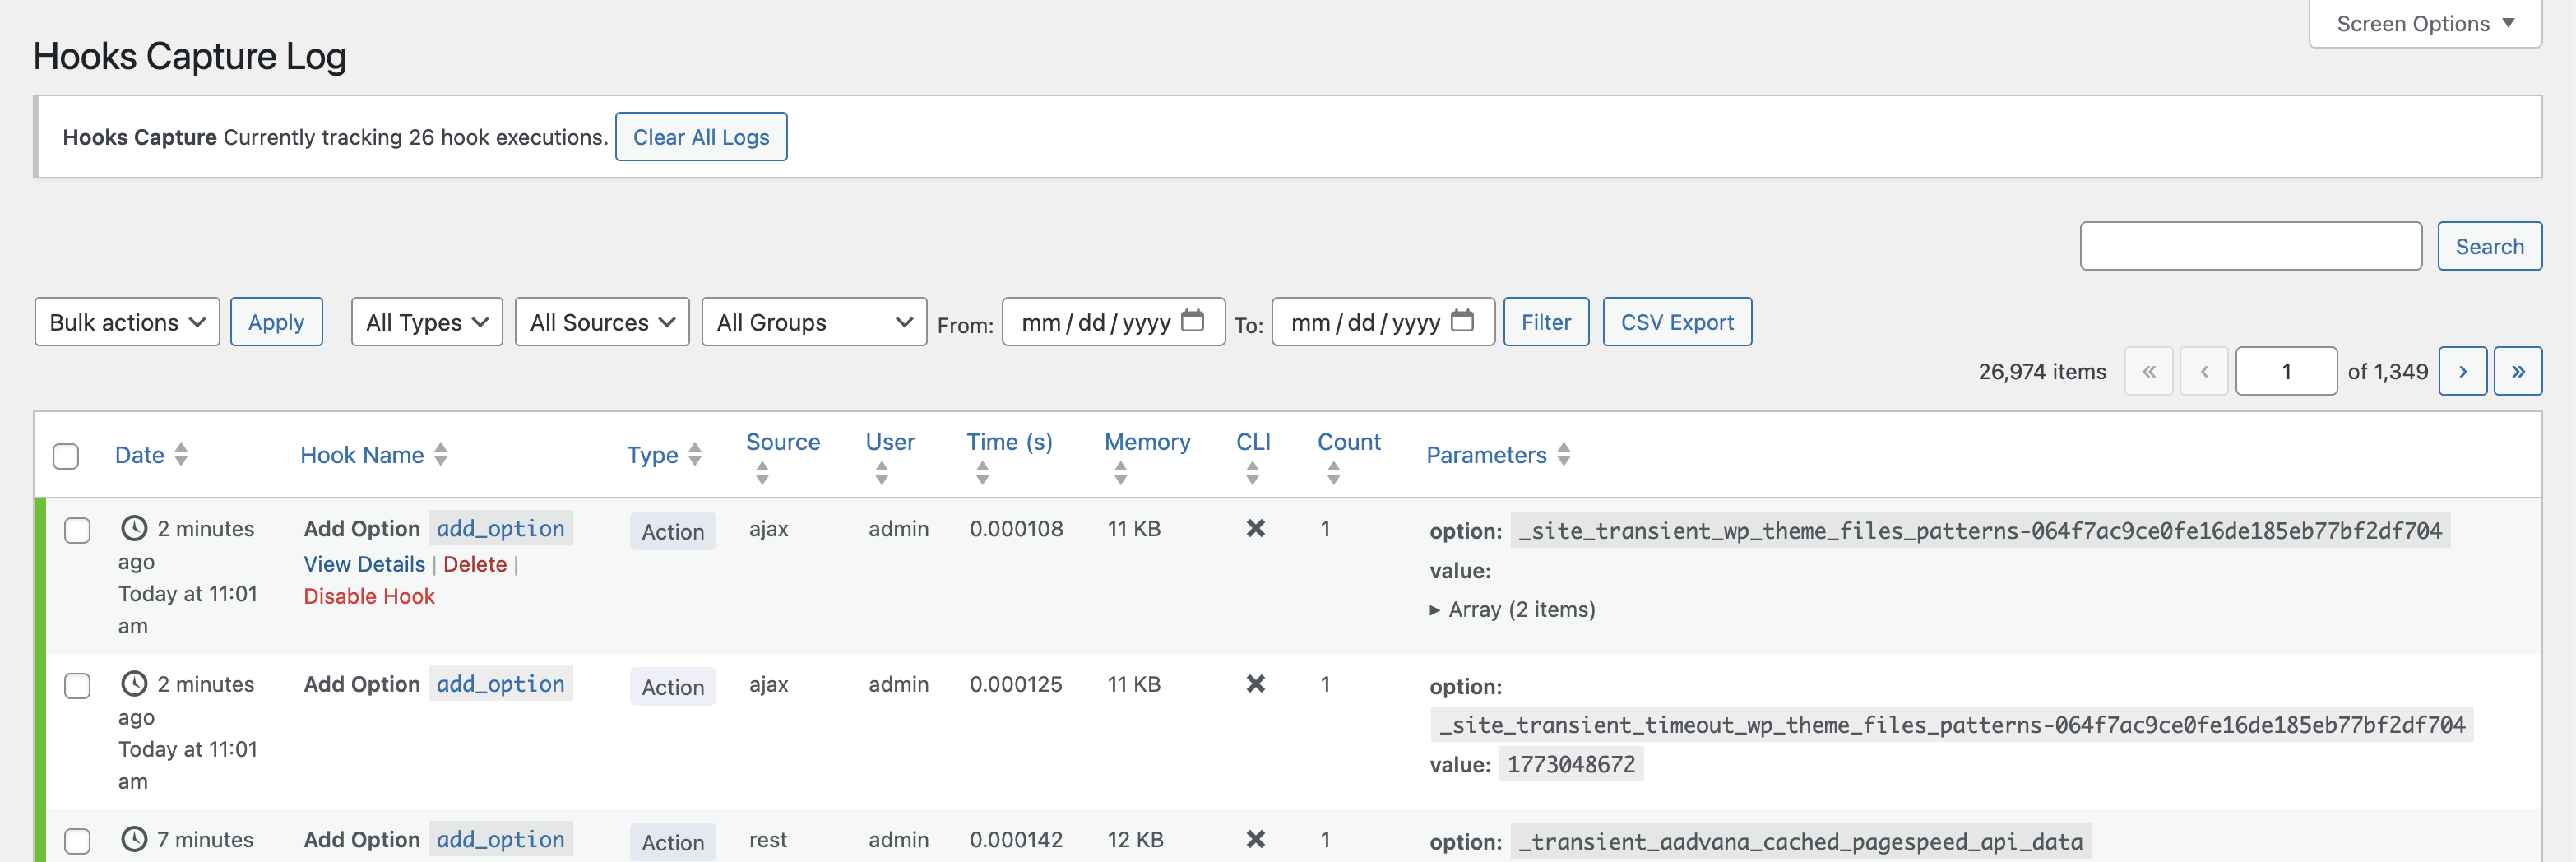
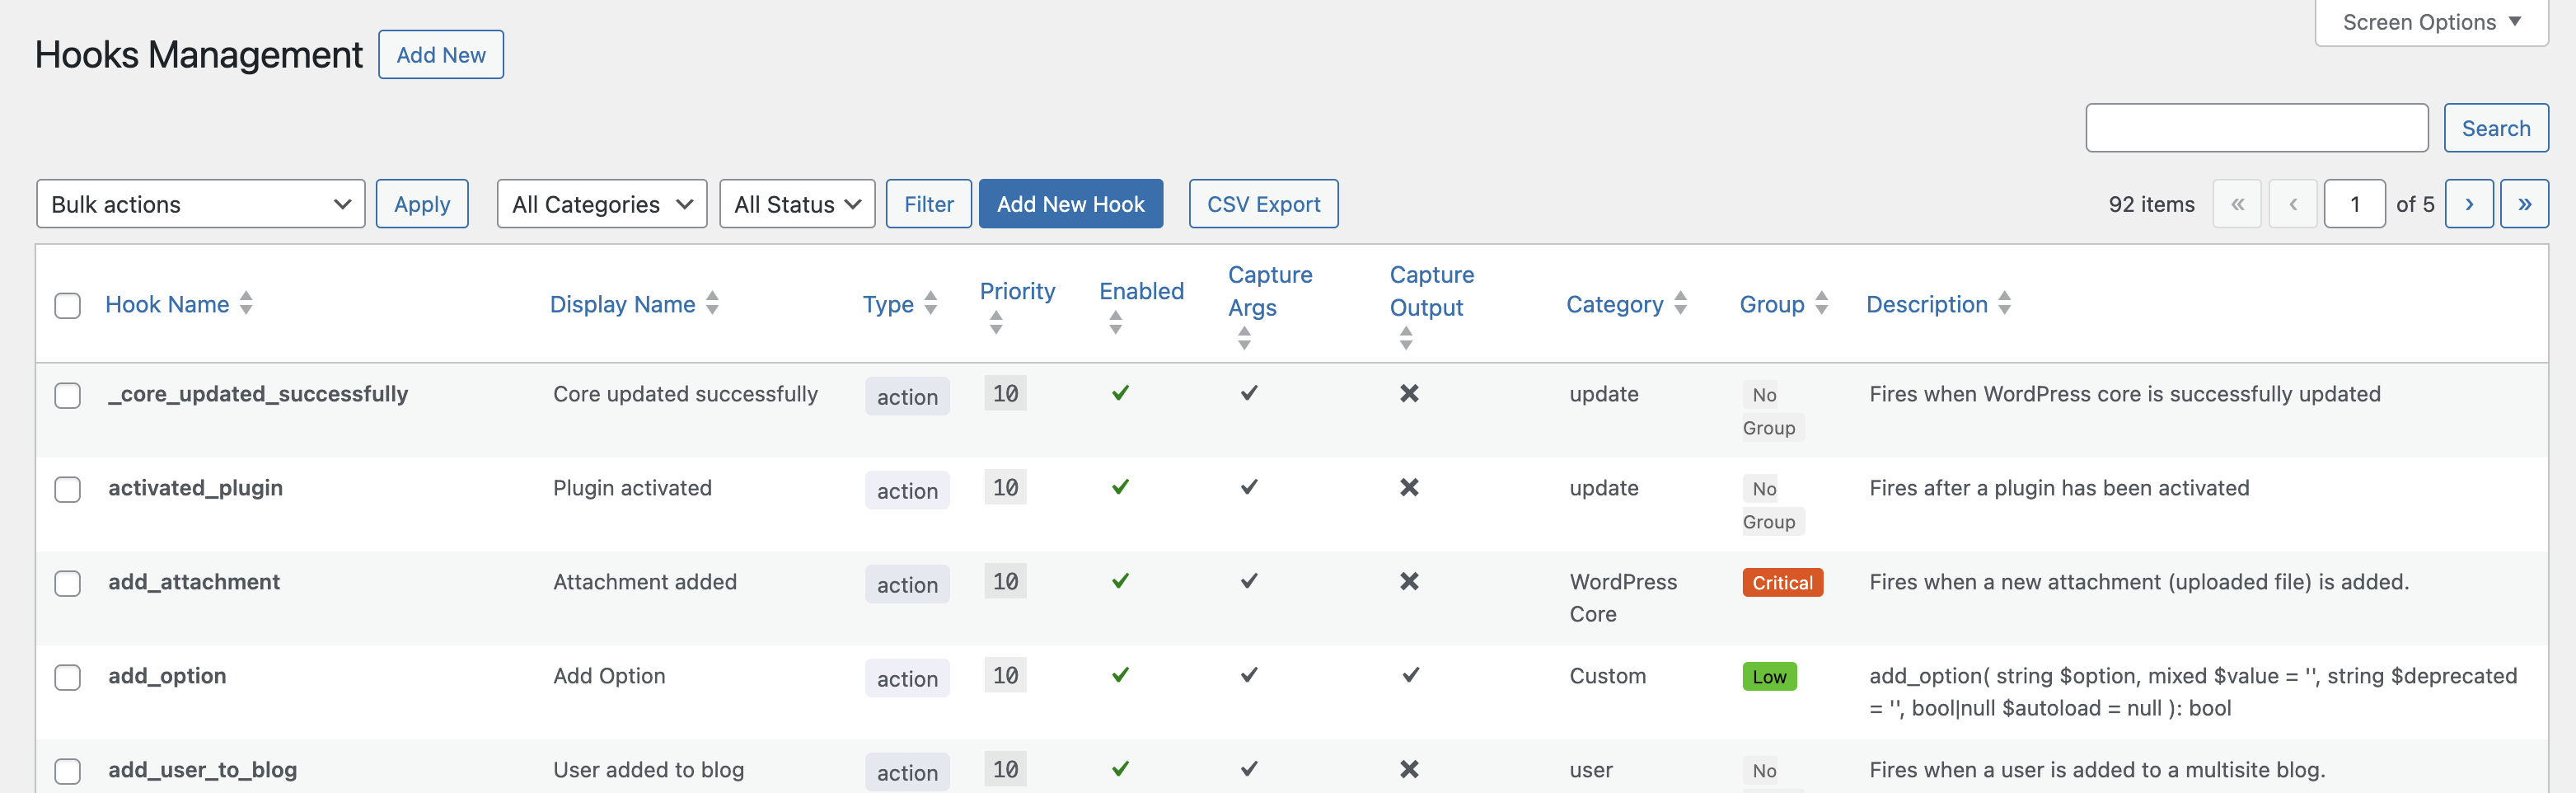
WP Hooks Monitor
Define which WordPress actions and filters (core or custom) you want to
observe. The Hooks Capture module records each invocation with its parameters,
return value (for filters), and a full stack backtrace. Organise monitoring
rules into named groups, enable/disable per hook, and review the captured
output in a dedicated list view.
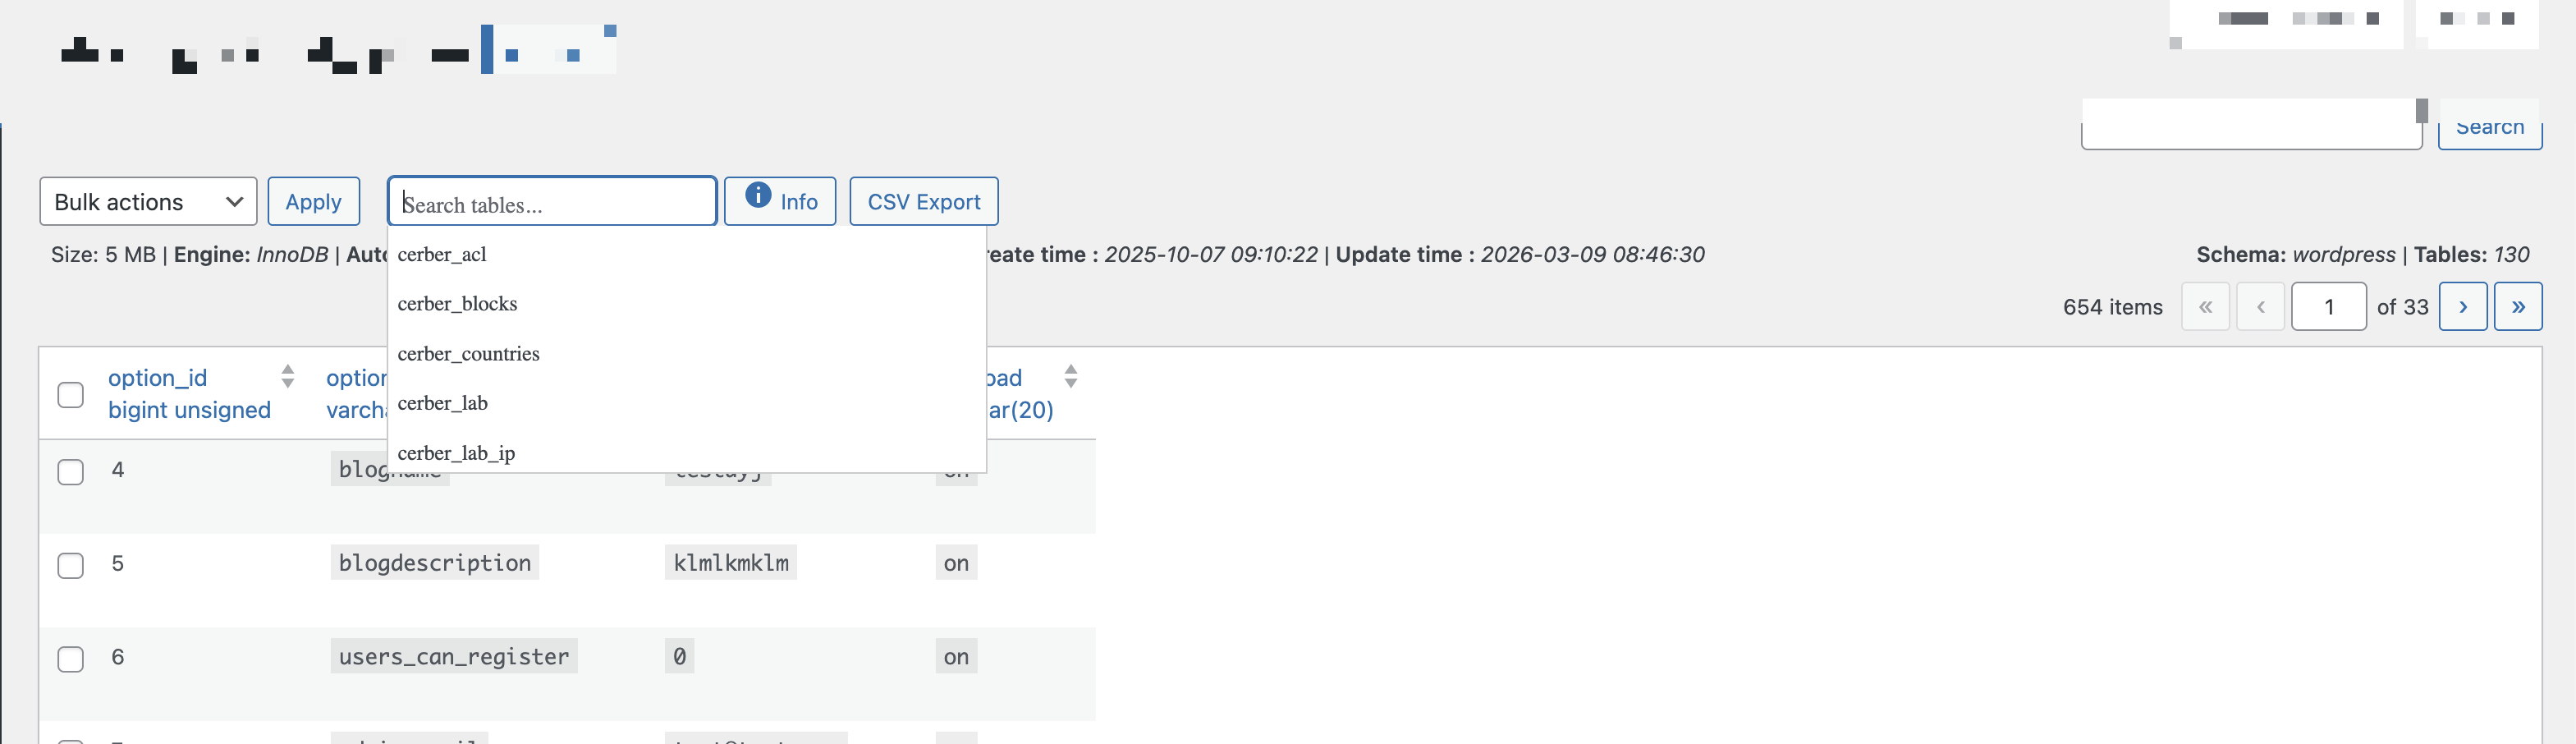
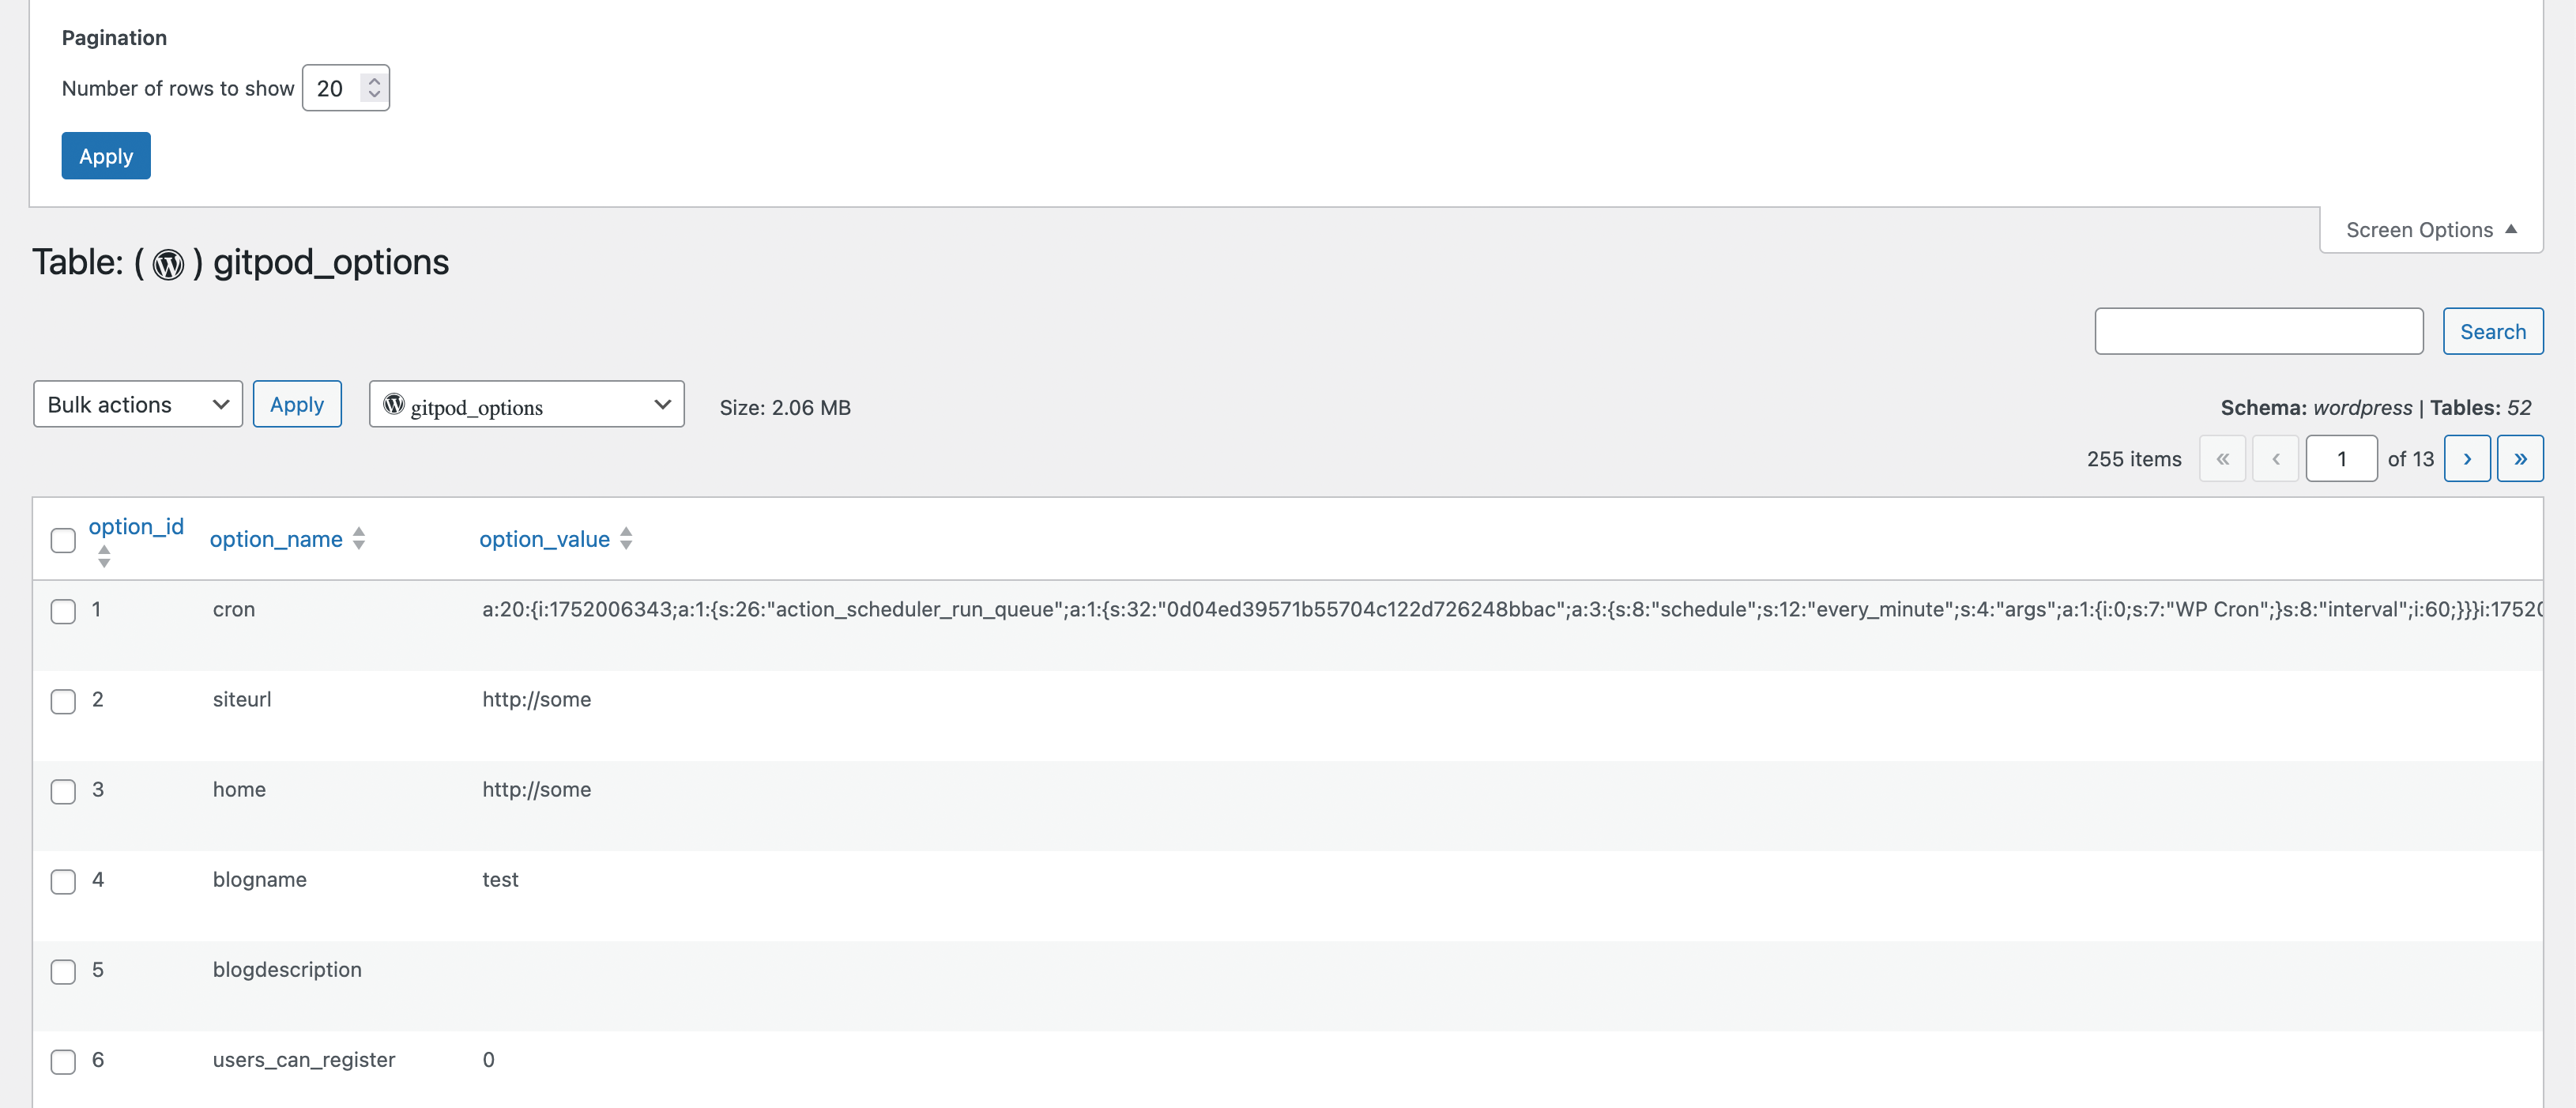
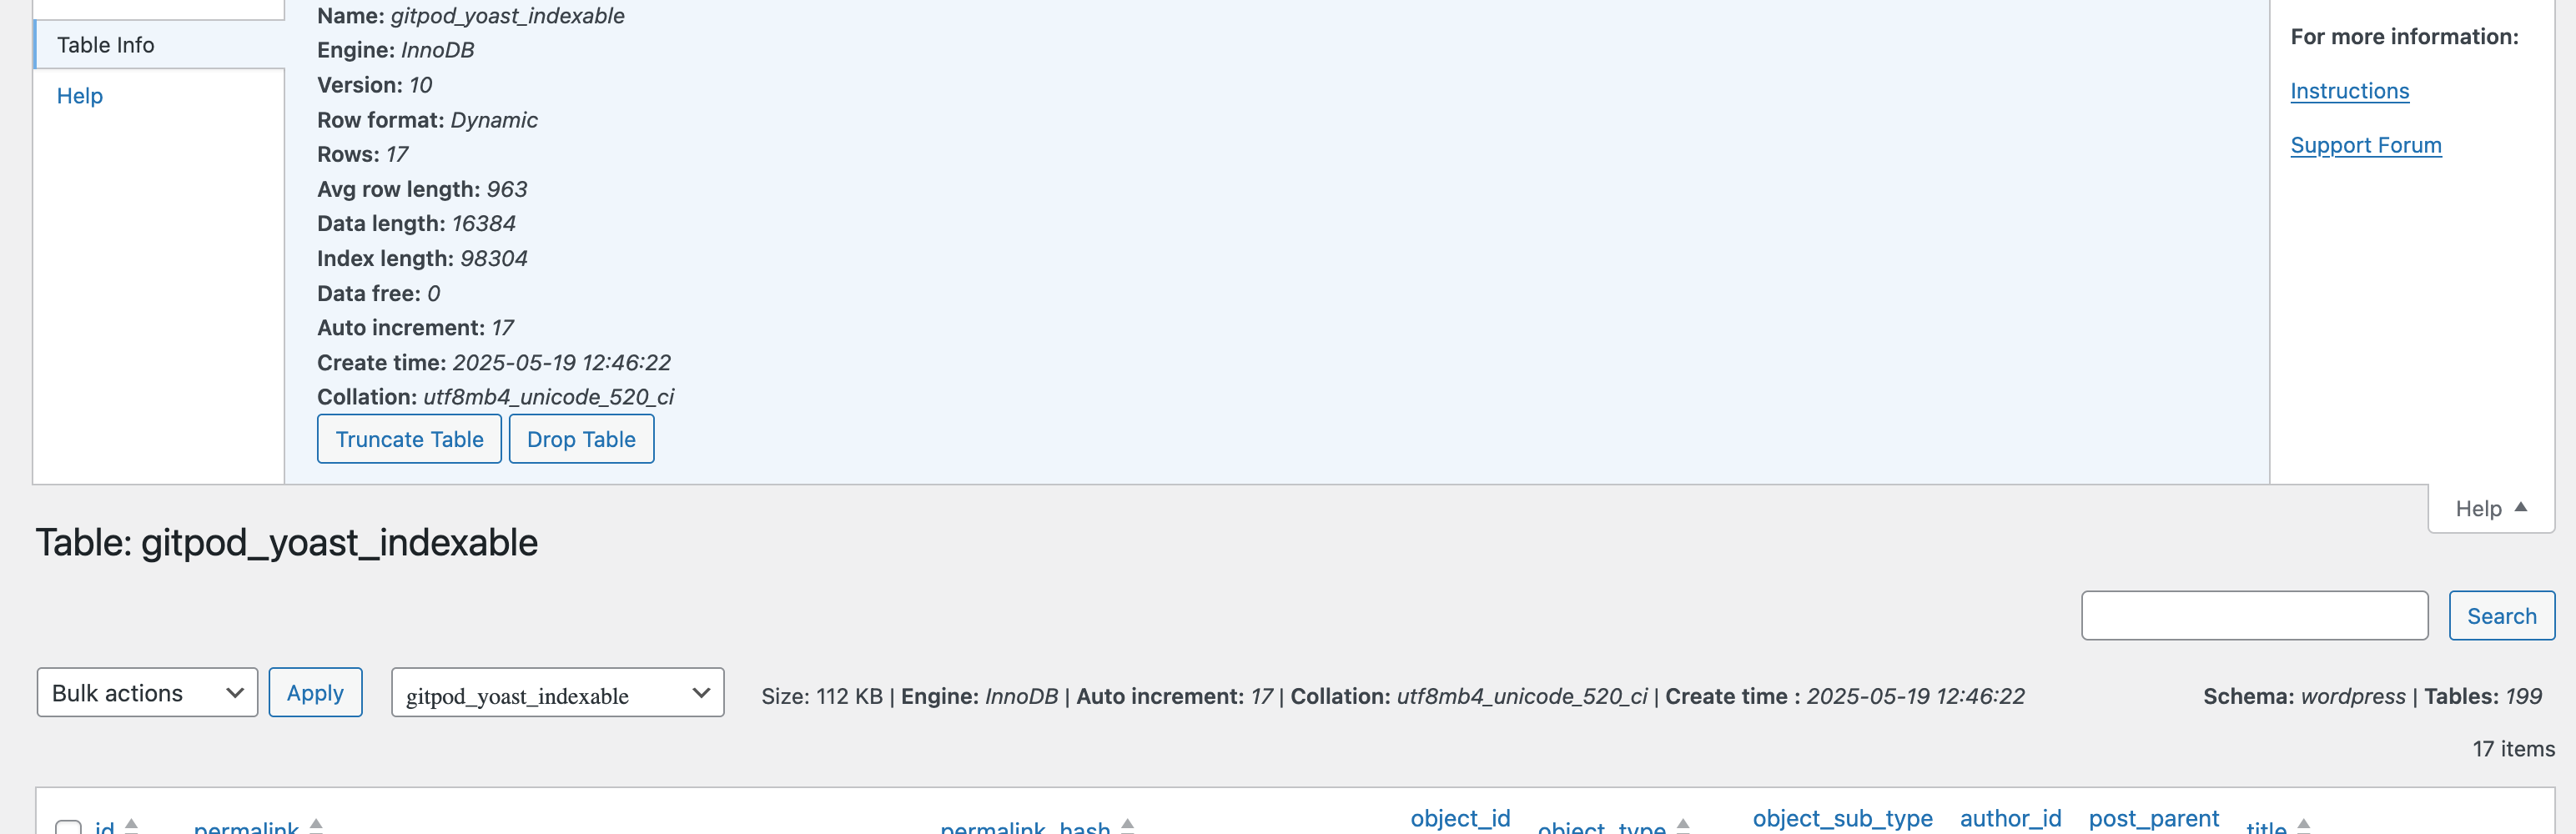
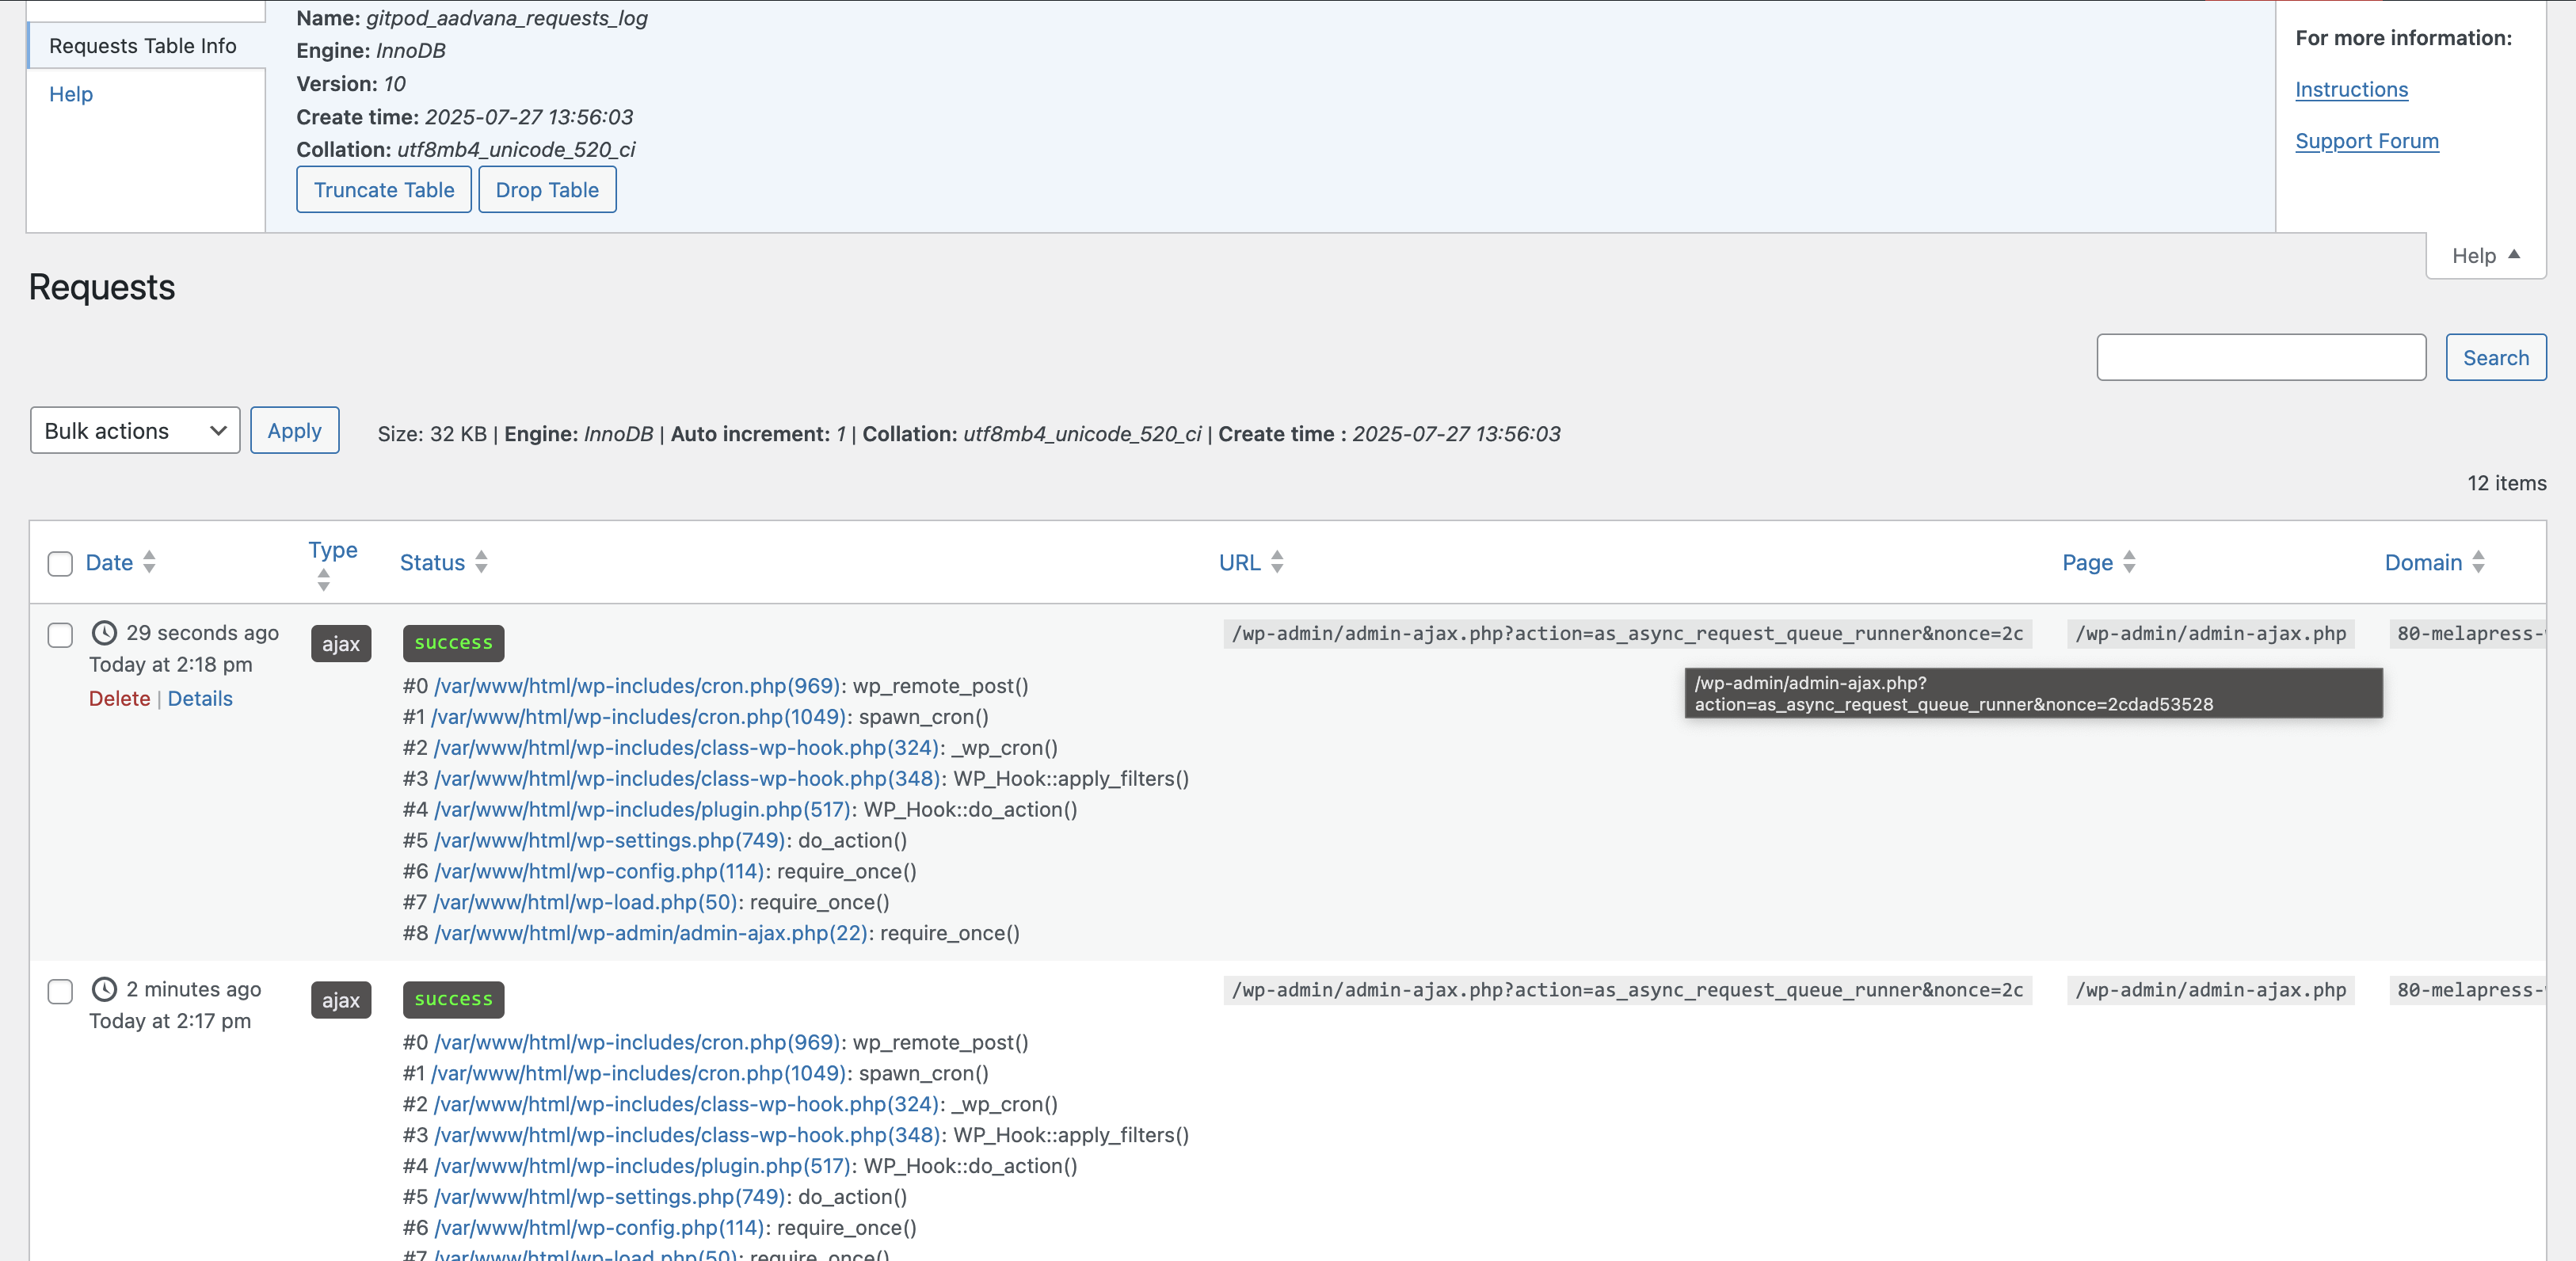
DB Table Manager
Browse, search, edit, and delete records across any table in your
WordPress database — including custom plugin tables. Displays table size,
engine, collation, row count, and schema information. Supports full and
filtered truncation and table drop with confirmation.
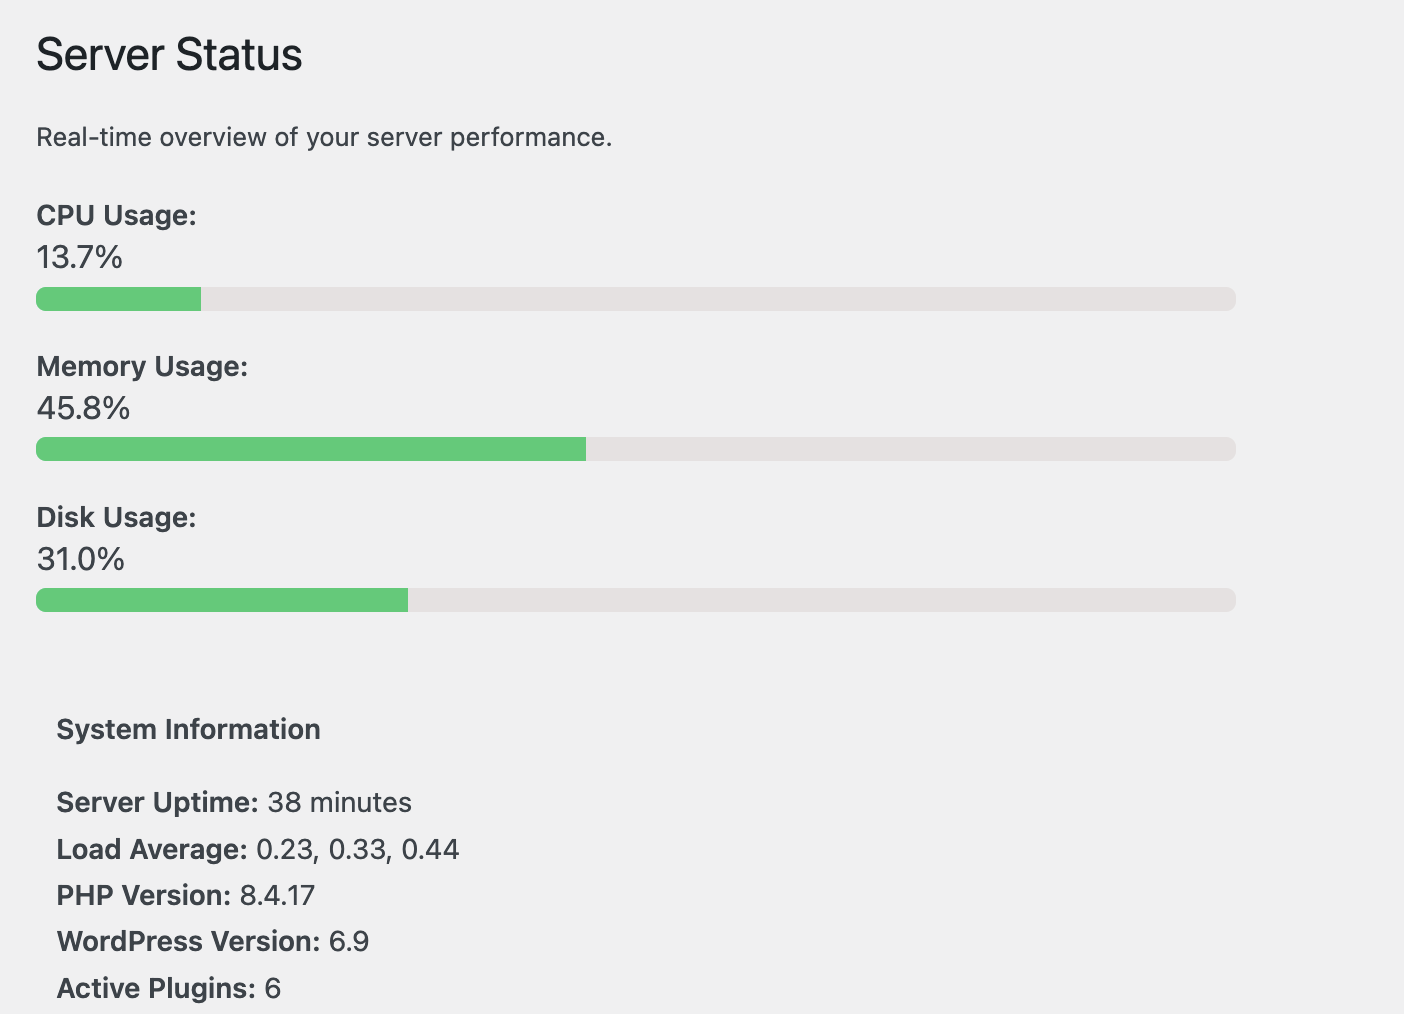
Server Info & System Status
Displays real-time server metrics (CPU load, memory usage, disk space,
PHP version, active extensions) as both admin-bar badges and a dashboard
widget. Also provides a detailed environment report useful for support tickets
and deployment checks.
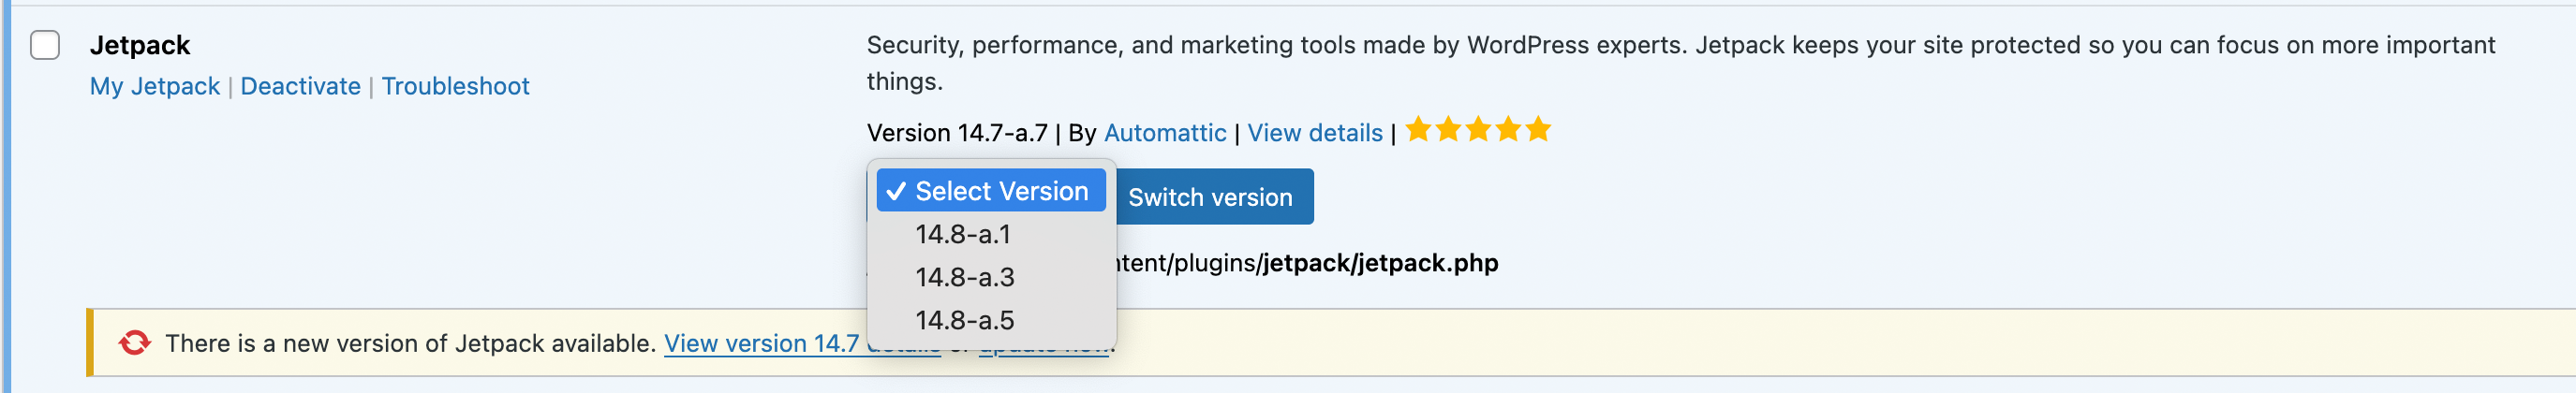
Plugin Version Switcher
Roll back or switch between any previously downloaded version of an installed
plugin without leaving the admin. Useful for quickly reverting after a bad
update. Supports only free plugins from the WordPress repo.
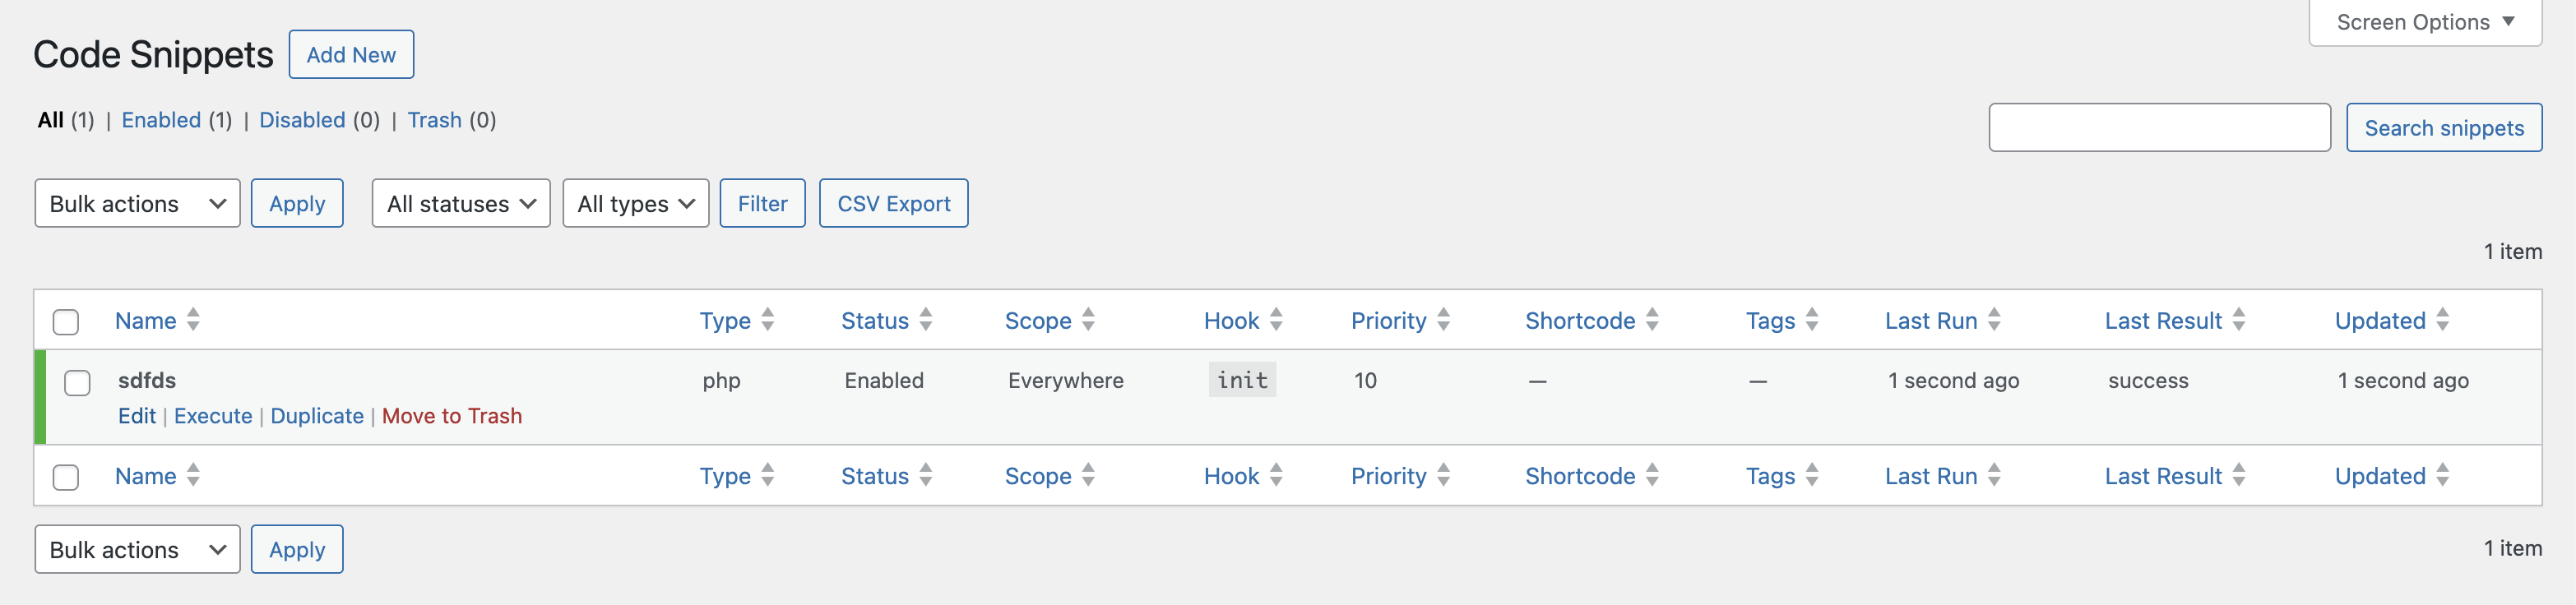
Code Snippets
Write, save, and execute custom PHP snippets from the admin. Snippets support
shortcodes, can be enabled/disabled individually, and are sandboxed before
execution. Useful for one-off data migrations, testing custom logic, or
generating dynamic output without creating a custom plugin.
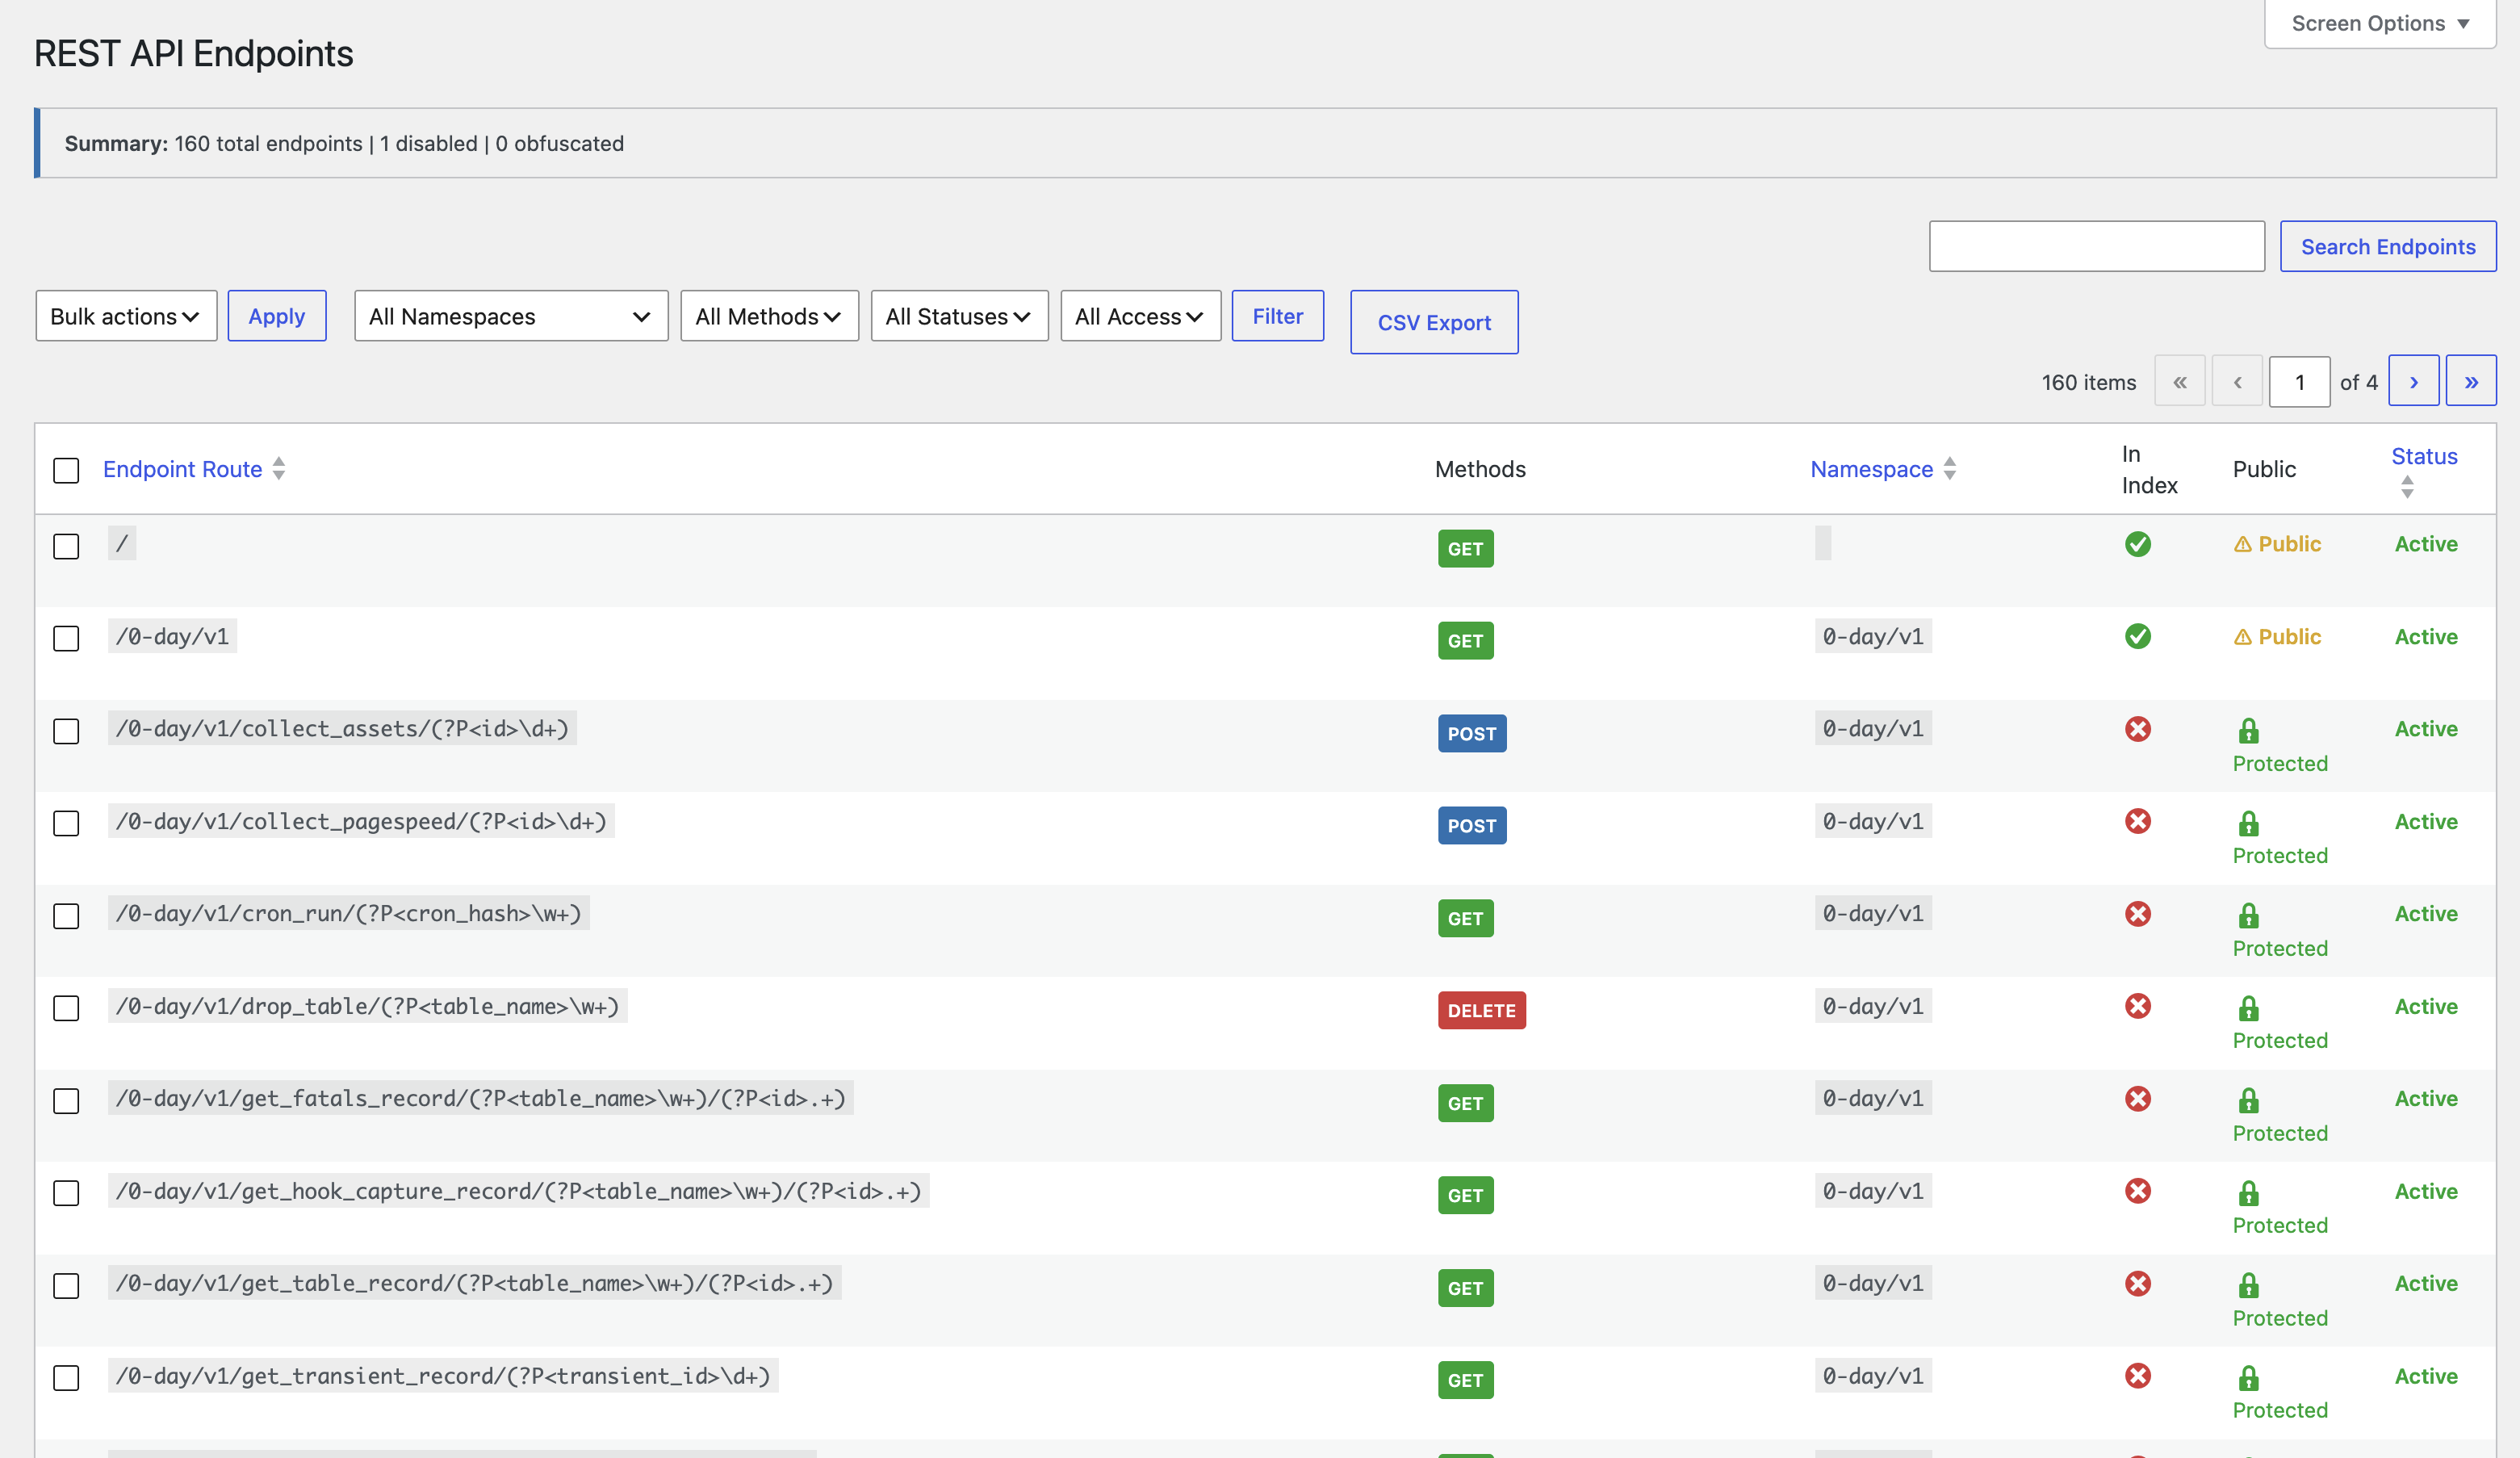
REST API Manager
A security and management tool that gives full visibility and control over
every registered REST API endpoint (/wp-json/). Inspect all registered
routes, disable individual endpoints, restrict HTTP methods, and hide routes
from discovery responses. Useful for hardening your site by removing
unnecessary API surface area.
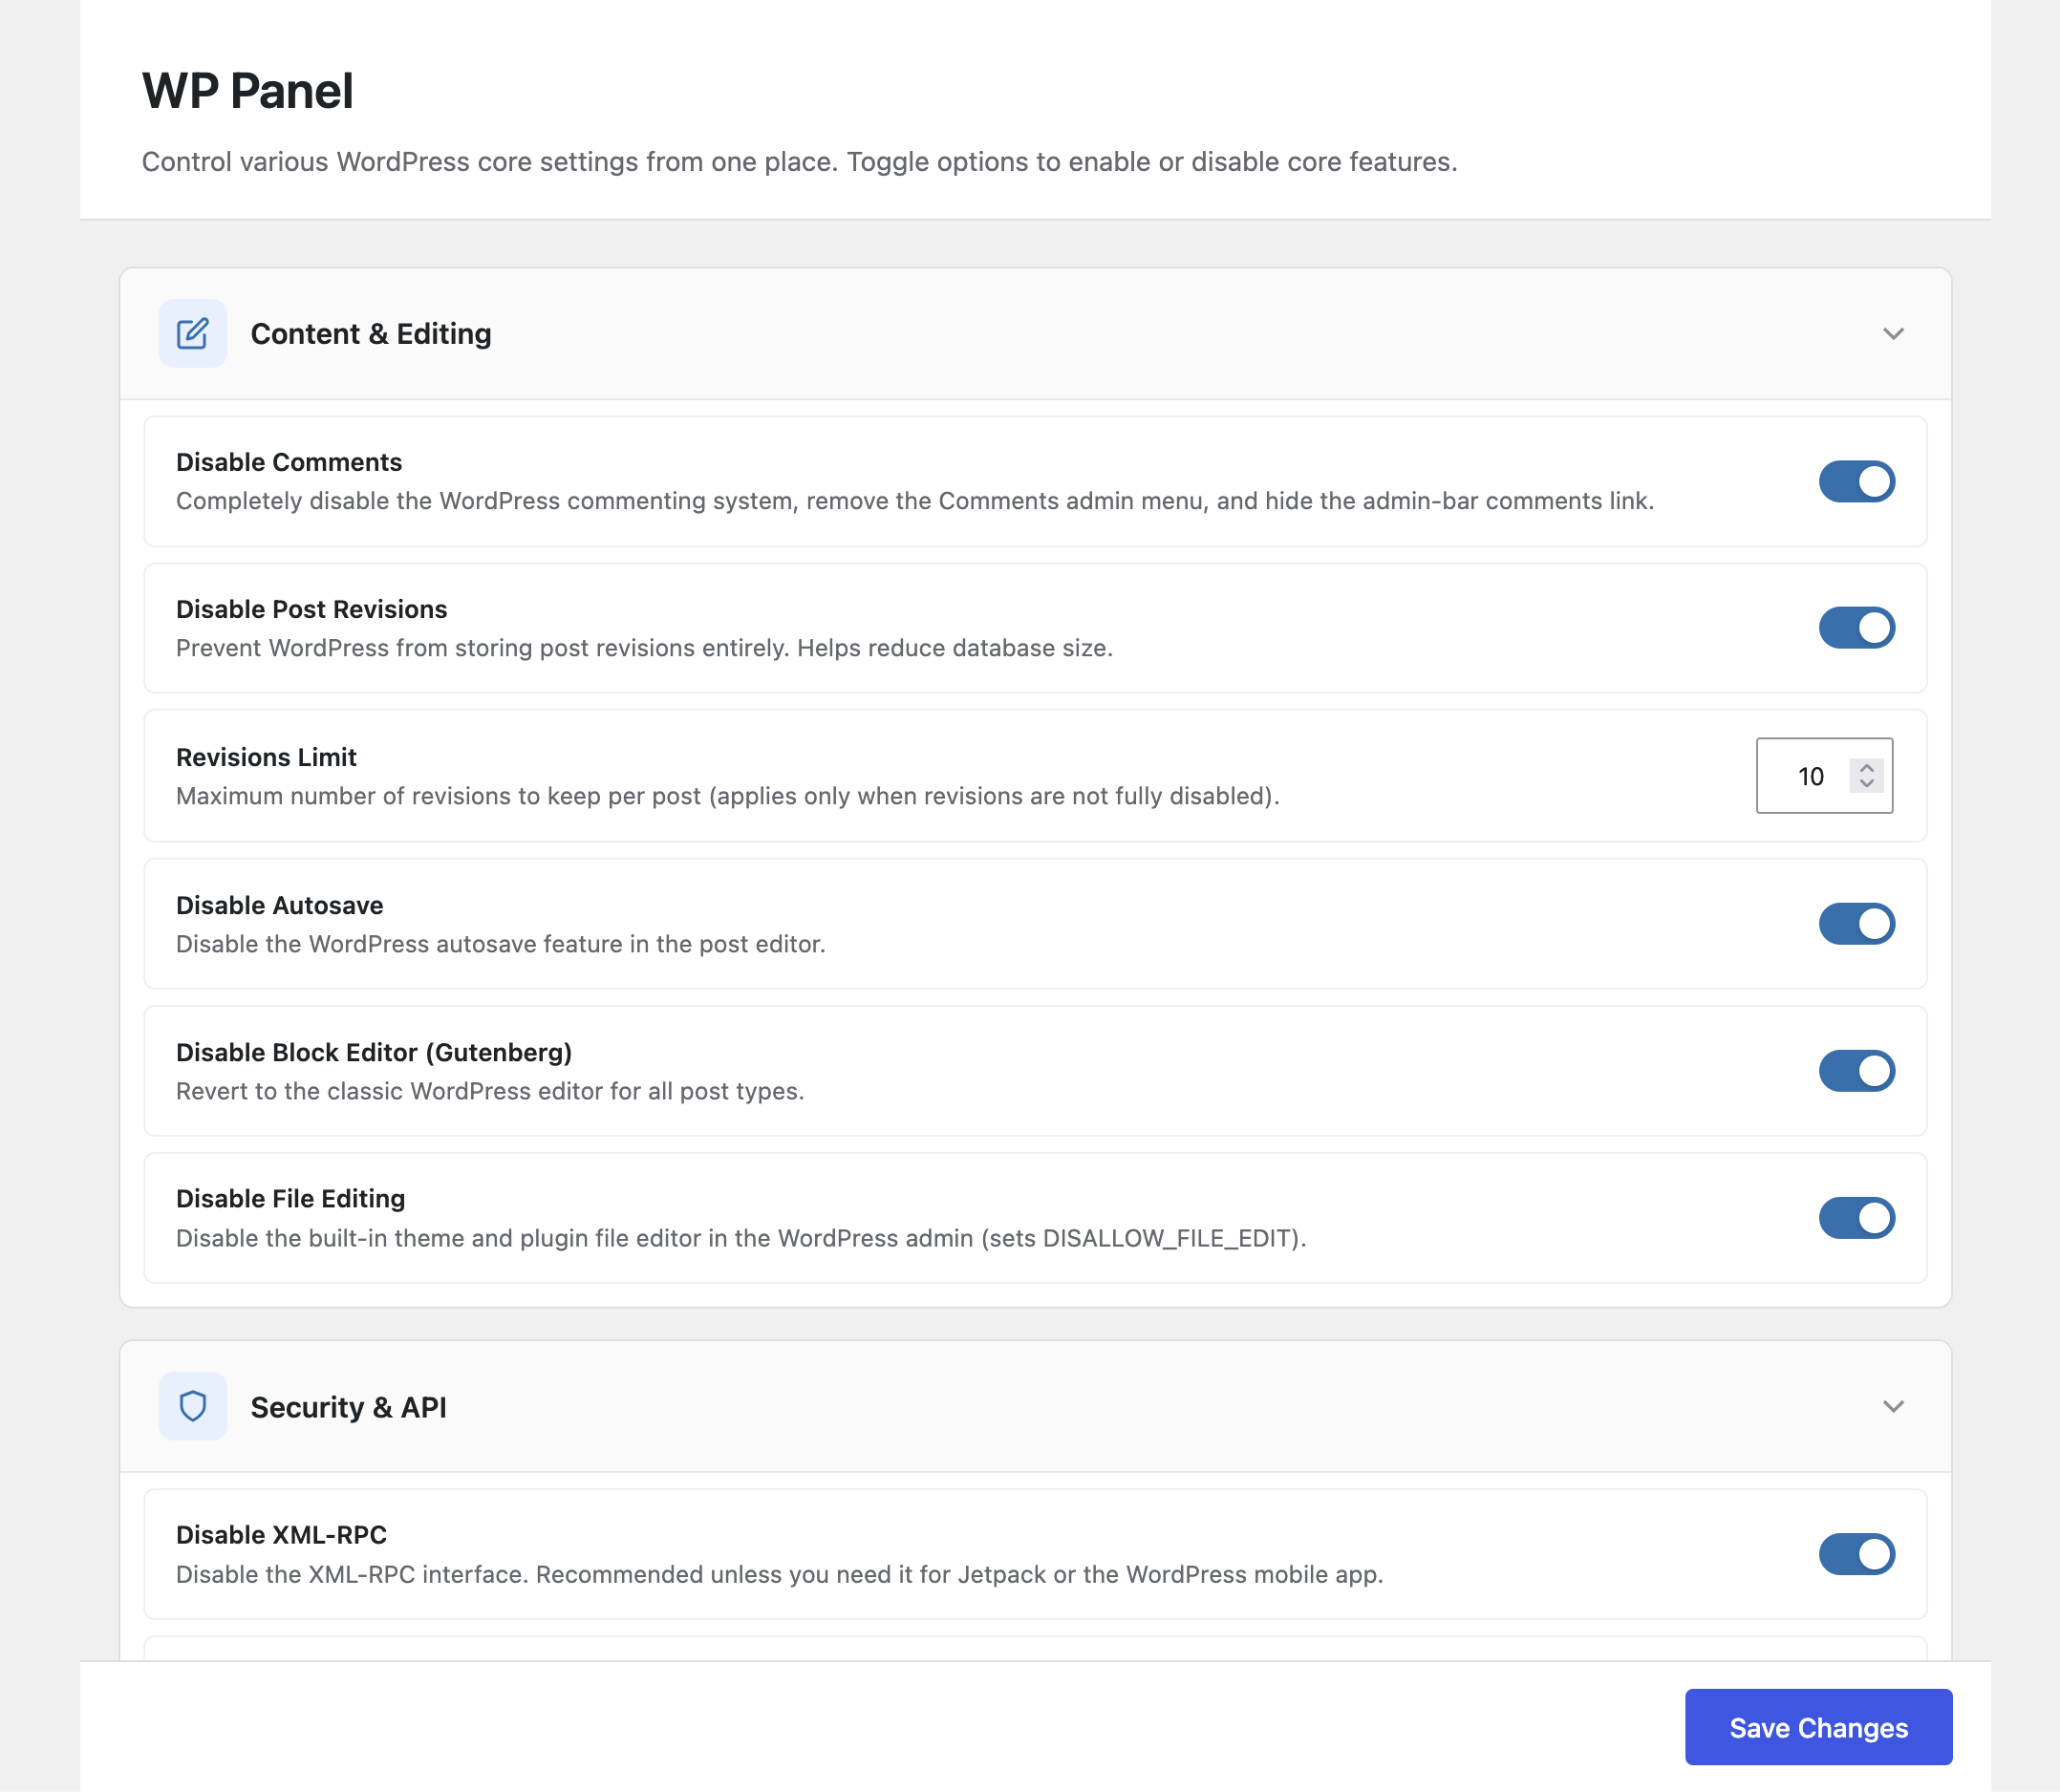
WP Panel
A centralised control panel for toggling WordPress core features and settings.
Enable or disable comments, revisions, auto-updates, XML-RPC, the REST API,
emojis, embeds, heartbeat behaviour, frontend asset loading, and more — all
from a single, organised admin page. No code changes or custom snippets
required.
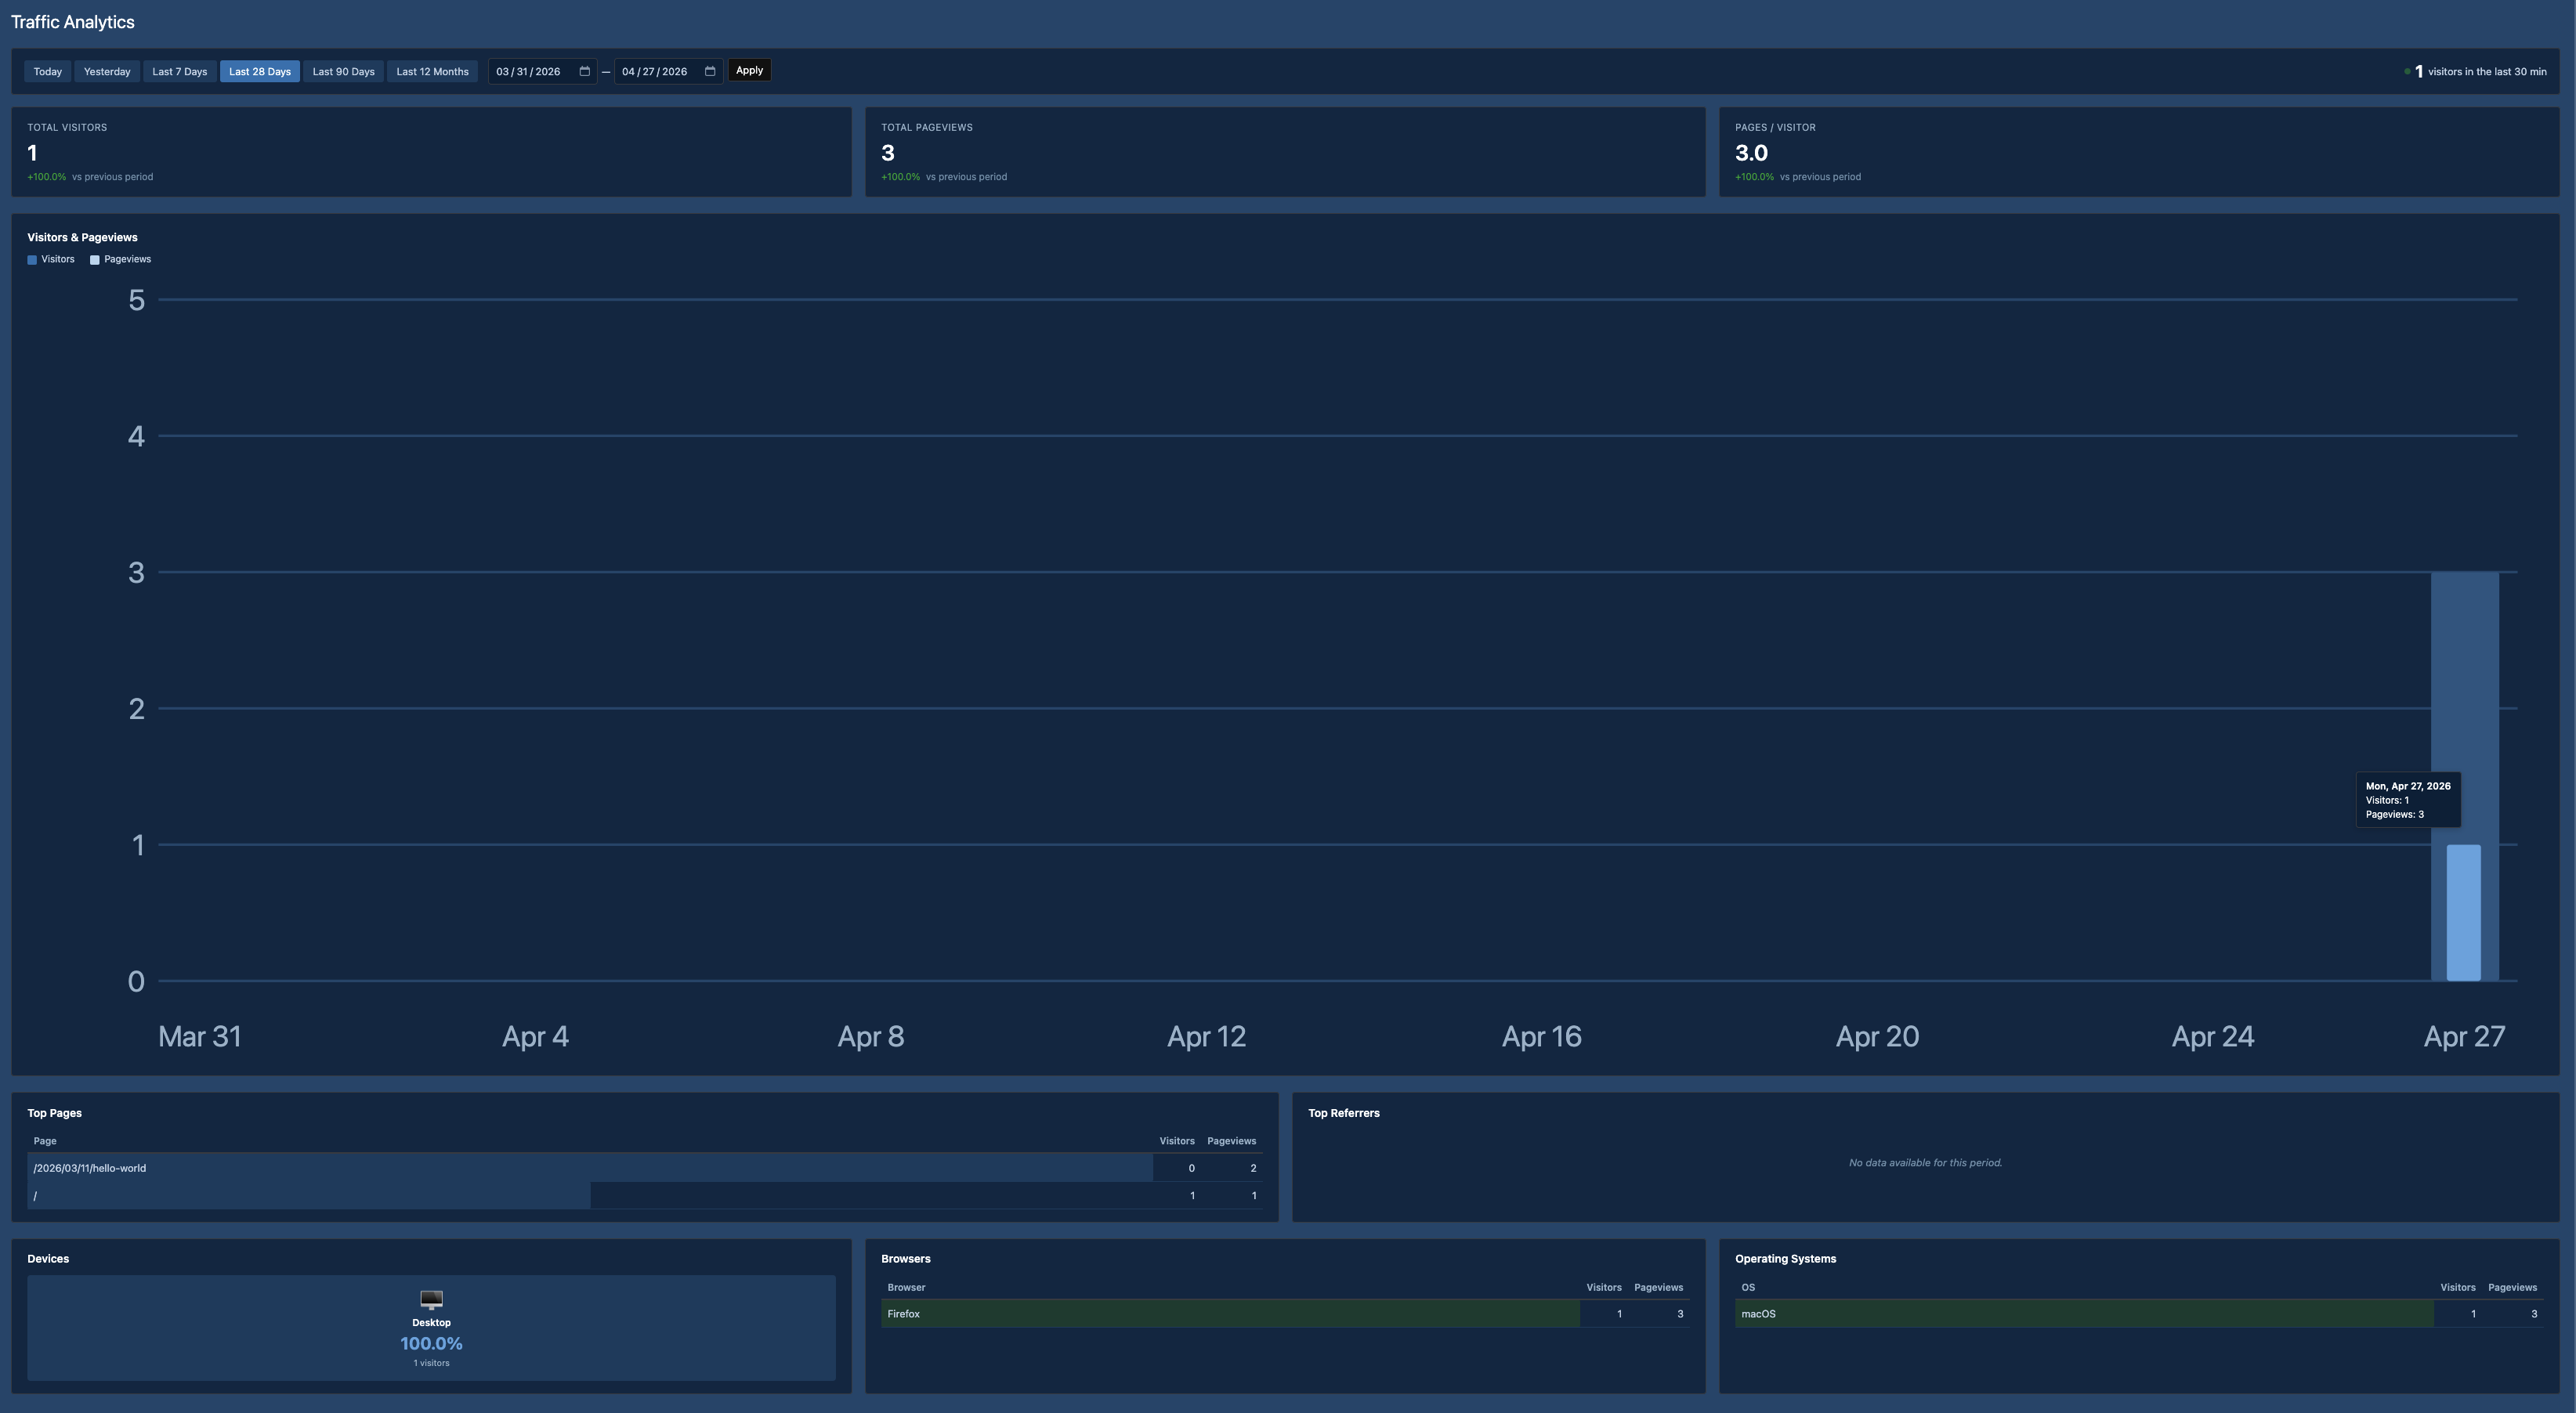
Traffic Analytics
Privacy-focused website traffic monitoring built directly into WordPress — no external services or third-party scripts. Tracks unique visitors, pageviews, top pages, referrers, and technology breakdown (devices, browsers, operating systems) with a visual SVG-based dashboard. Choose between server-side (PHP) or client-side (JavaScript) tracking. Includes real-time visitor count automatic period comparison, configurable data retention, and a high-performance file-based write buffer.
Important: By default, Traffic Analytics uses server-side (PHP) tracking mode. This method is less accurate because it cannot distinguish bots from real visitors as effectively and may miss visitors served from full-page caches. If you need more precise analytics, switch to client-side (JavaScript) tracking in the module settings — this mode runs a lightweight script in the browser that provides significantly more accurate visitor detection and pageview counting.
Security Monitor
Real-time security event monitoring and threat detection for your WordPress
site. Tracks brute-force login attempts, burst rate limiting (DoS protection),
user enumeration attempts, and blocked requests. Displays a summary dashboard
with total events, critical alerts, blocked requests, and active incidents over
the last 7 days. Includes an Emergency Lockdown button to immediately restrict
site access during an active attack. Events are logged with severity level,
IP hash (privacy-preserving), attempt counts, and detailed request information.
Login & Auth Audit
Comprehensive authentication event logging that tracks all login activity on
your site. Records successful logins, failed login attempts, session expirations,
and password resets with full context — including user, IP hash, user agent,
and timestamp. Displays summary statistics (total events, successful logins,
failed logins, password resets) for the last 7 days. Supports filtering by
event type and severity, search, and CSV export.
Recovery Mode
Generate single-use recovery links that can disable a specific plugin or
trigger a custom action — delivered via Slack, Telegram, or any configured
webhook channel. Designed for emergency recovery when the site is inaccessible through normal means. The recovery URLs are sent in Slack and Telegram channels for security.
Other Features
- Dark mode for all admin screens.
- CSV export on all list views (requests, errors, mails, hooks, etc.).
- Screen Options on every screen (configure columns, items per page).
- WP CLI compatible scaffolding for background operations.
- Multisite aware (note: recovery mode has core multisite limitations).
安装:
- Place the
0-day-analyticsfolder into/wp-content/plugins/(or install via the Plugins screen or WP CLI). - Activate on the WordPress Plugins screen.
- Visit 0 Day in the admin menu and configure settings.
- Enable only the modules you need to minimise footprint.
- Recommended: test on staging before enabling on production.
屏幕截图:


常见问题:
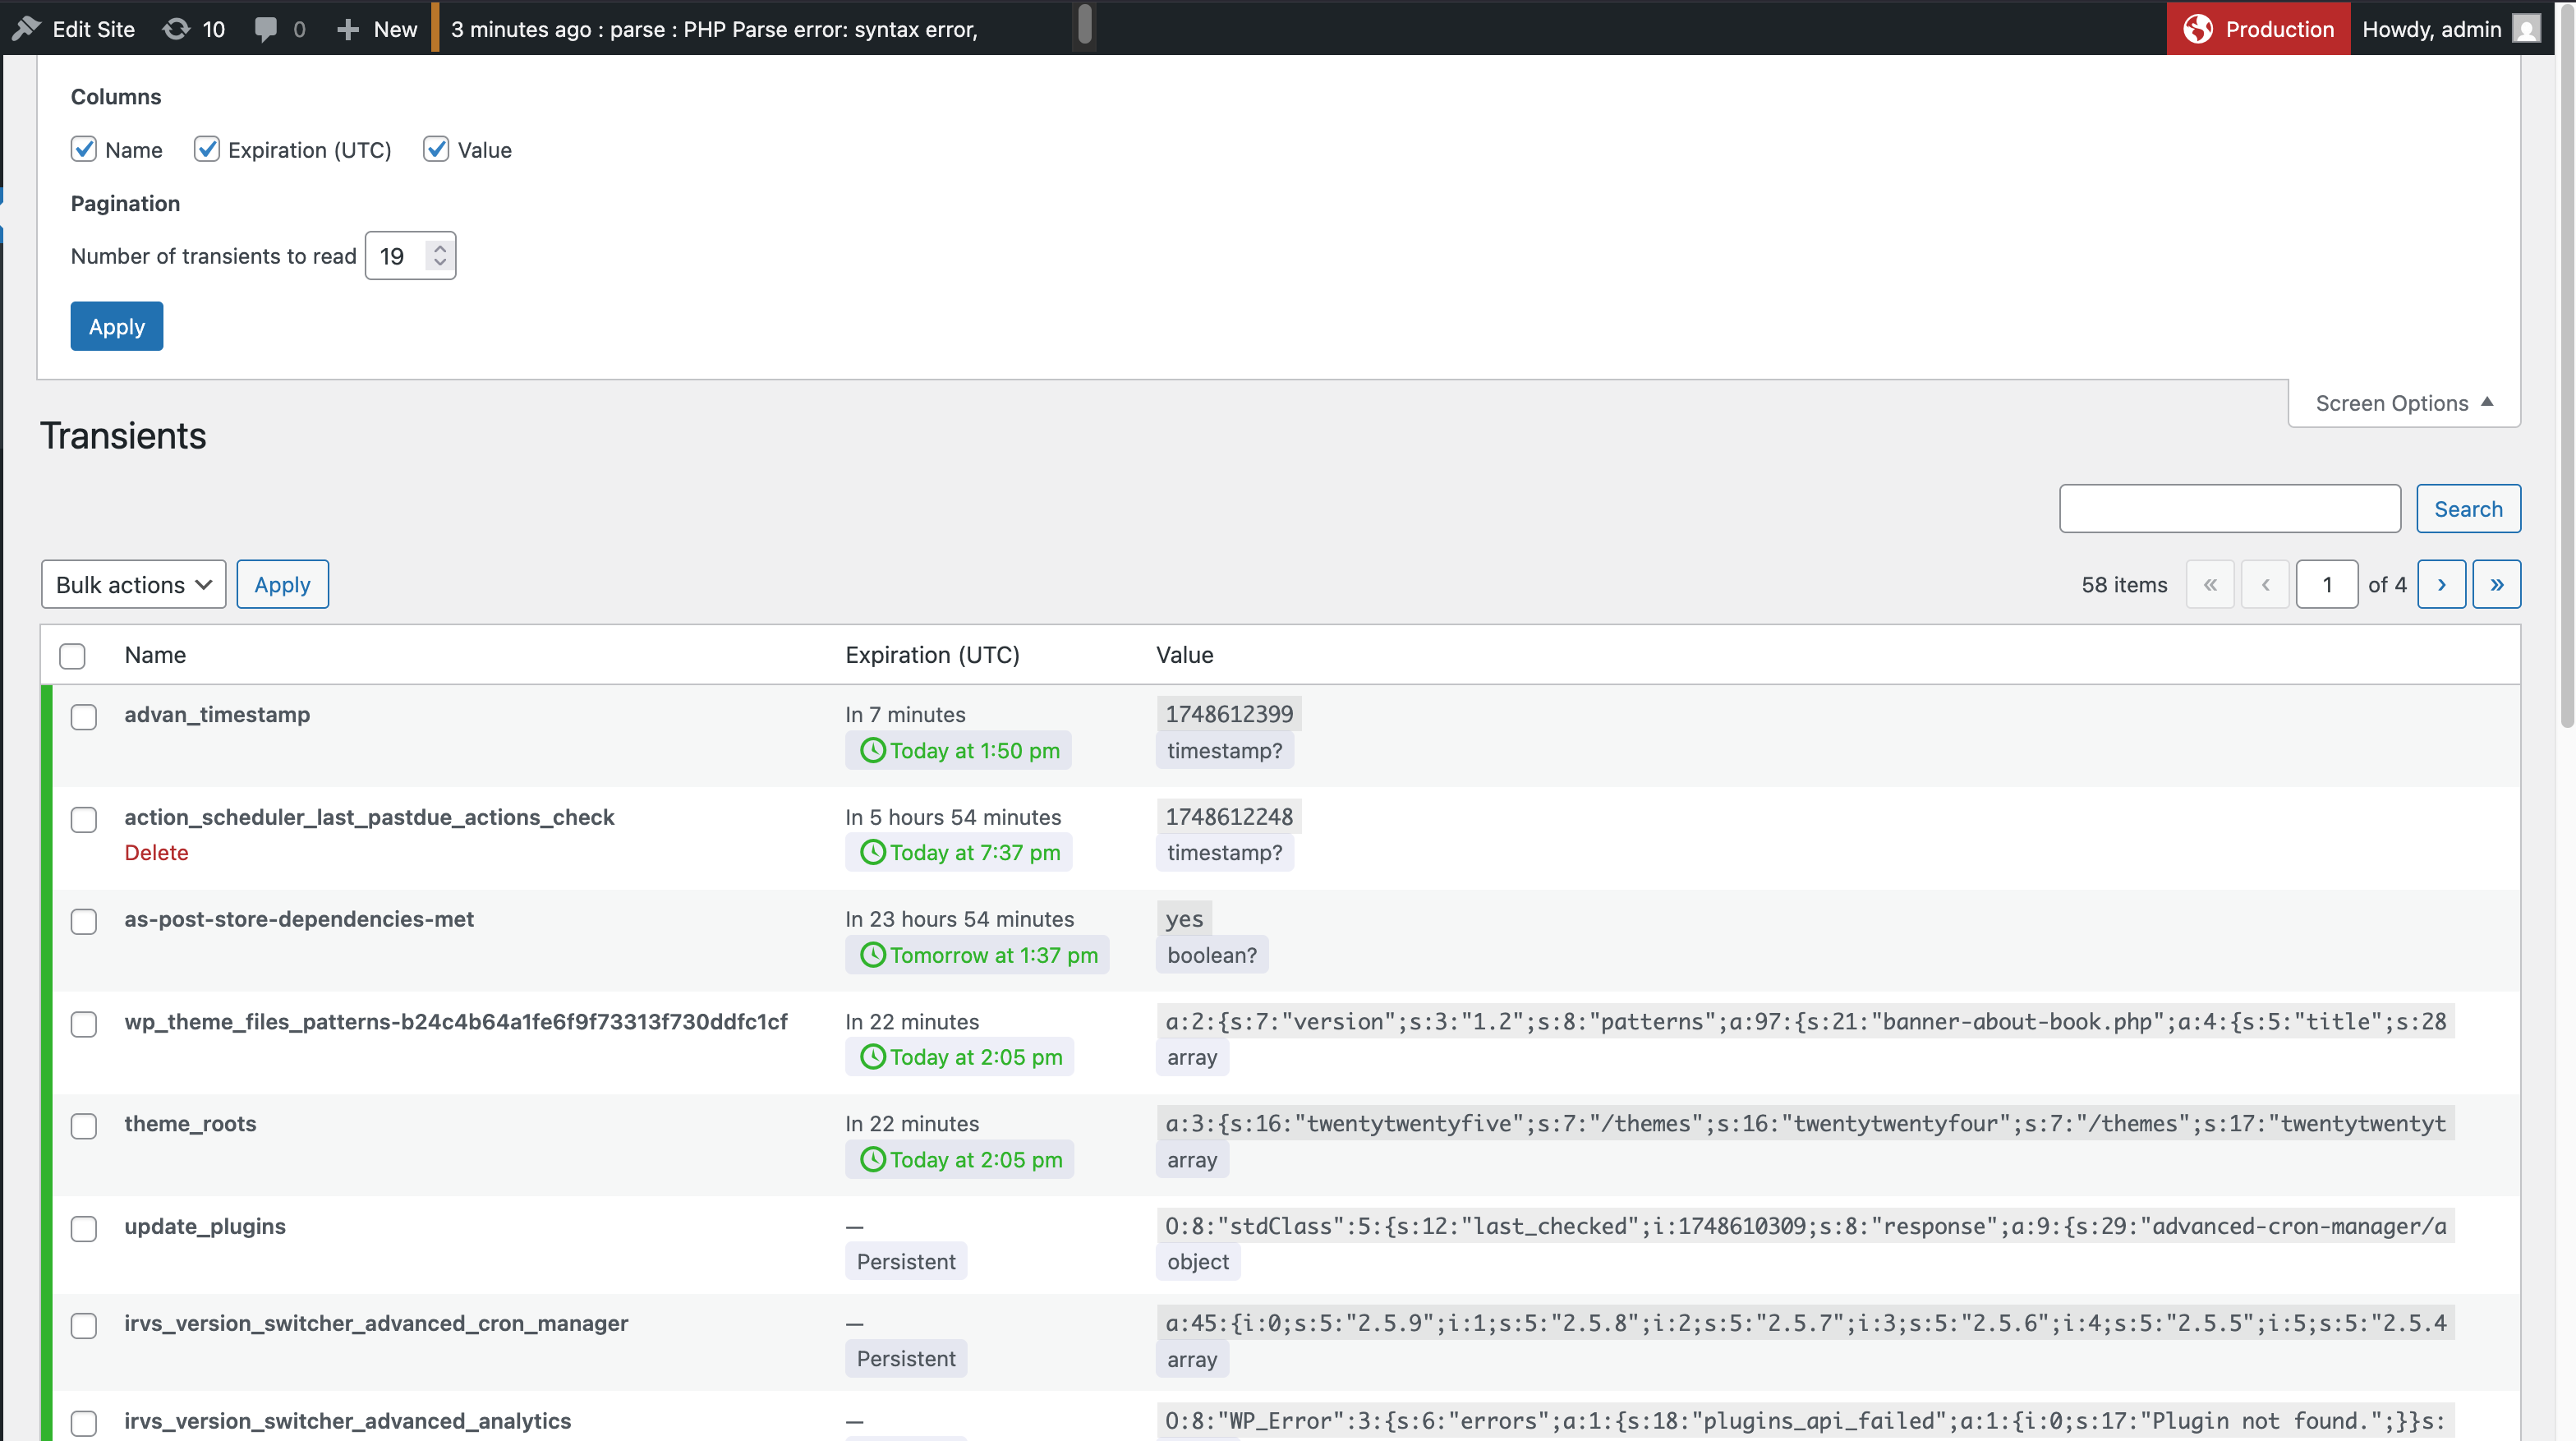
Why only read the last N errors instead of the whole log?
Reading only the tail of the log avoids loading gigabytes of data into memory on every page view. The number of lines to read is adjustable via Screen Options on the Error Log screen.
Why is there no pagination for the error log?
Pagination would require seeking to arbitrary byte offsets in potentially very large files on every page load. The tail-read approach is orders of magnitude faster for the most common use case (seeing recent errors).
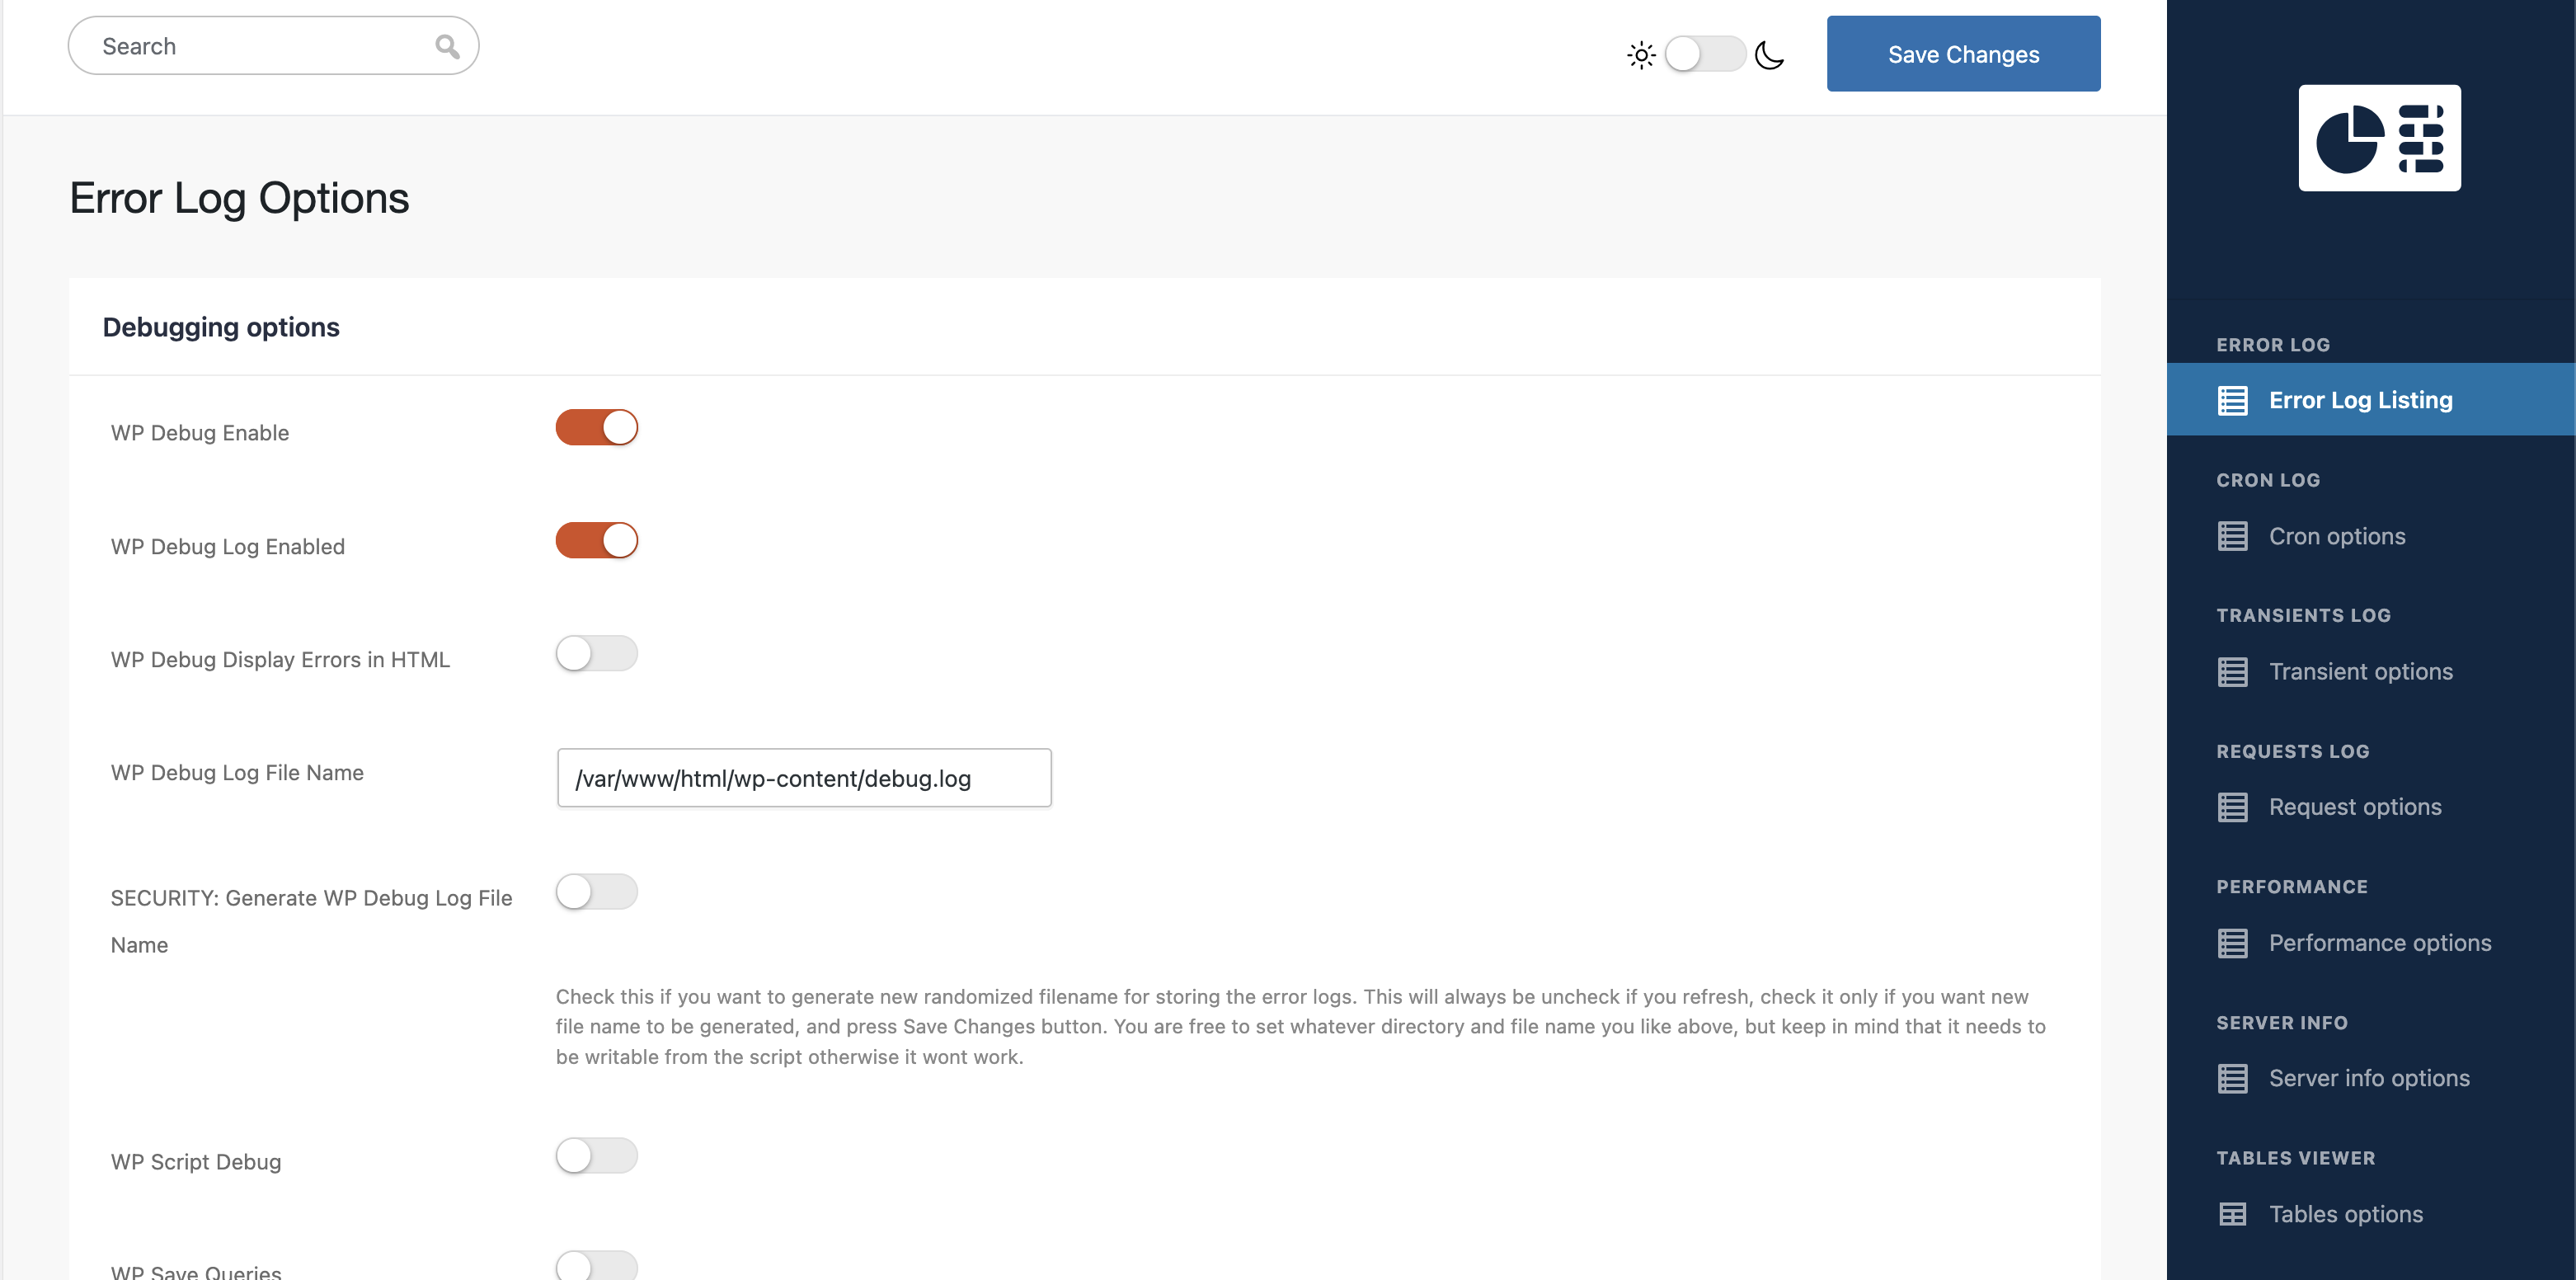
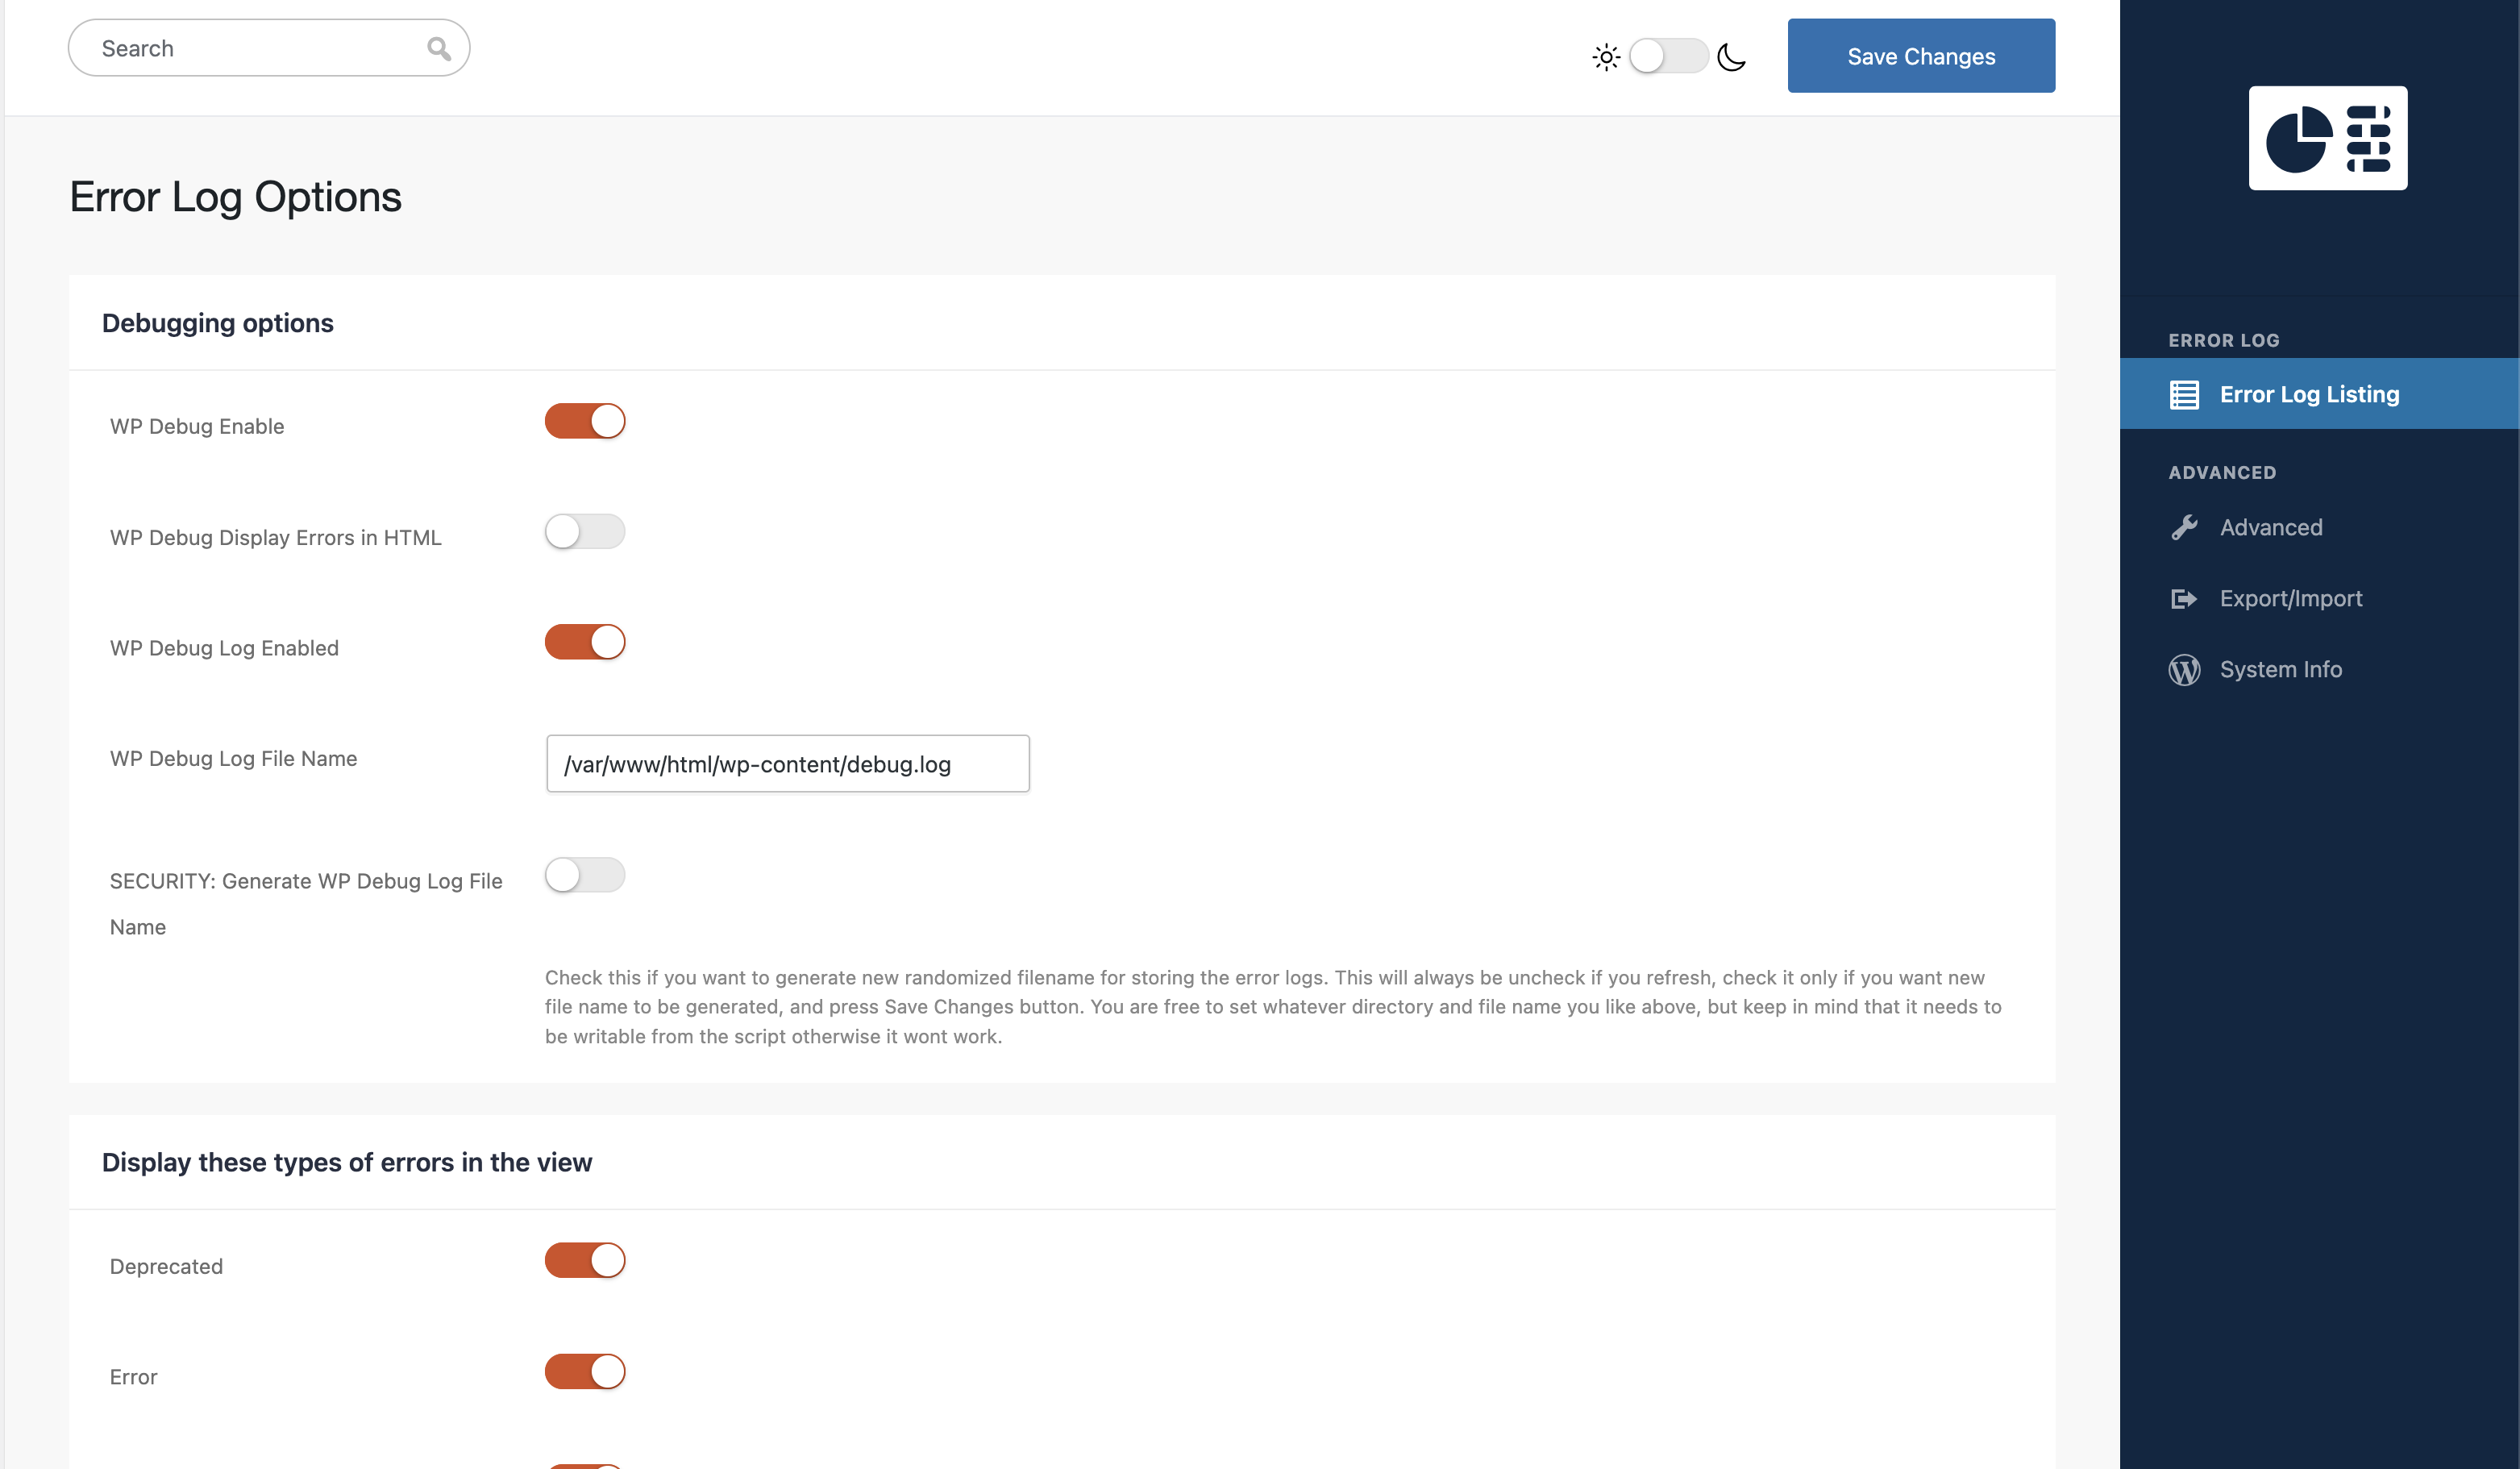
How do I enable or disable error logging?
Go to 0 Day → Settings → Error Log and toggle "WP Debug Log Enabled". For best results, test the setting on a staging environment first.
Can I randomise my error log filename?
Yes. In Settings → Error Log, click "Generate WP Debug Log File Name". A
cryptographically random filename will be written into wp-config.php,
making the log URL unguessable from the outside.
Is this safe to run on a multisite installation?
Most modules work correctly on multisite. The Recovery Mode feature has known limitations related to WordPress core multisite behaviour — use with caution and test on staging first.
Does the plugin send data to any external service?
No data is sent to any third-party service by the plugin itself. The Google PageSpeed integration only fires when you explicitly click "Run PageSpeed Analysis" and requires you to supply your own Google API key. Slack and Telegram are opt-in notification channels for Recovery Mode.
How do I use the Google PageSpeed integration?
Go to Settings and enter your Google PageSpeed Insights API key (free from Google Cloud Console). You can then analyse any URL from Performance → PageSpeed or from the Performance → URLs tab.
What does the Security Scanner check?
It runs 32+ automated checks including: PHP version currency, WordPress core version, SSL certificate validity, WP_DEBUG exposure, file permissions, database table prefix security, XML-RPC status, login URL predictability, autoloaded options size, active plugin bloat, caching configuration, gzip compression, lazy loading, image optimisation, cron health, and more. Each check is scored and colour-coded with a recommended action.
How does the PHP Fatal Error Tracker differ from the Error Log?
The Error Log module reads your flat PHP error log file. The Fatal Error Tracker stores fatal errors in a dedicated database table that persists across log rotations and file truncations. Use both in combination: the log for real-time detail, the tracker for long-term history. It will capture / store PHP errors even if WP_DEBUG is disabled, this way you will always be aware if something is wrong.
Can I capture and inspect specific WordPress hooks?
Yes. Go to Hooks Monitor and add a new monitoring rule specifying the hook name (action or filter). From that point on, every invocation is recorded with its arguments, return value, and full PHP backtrace. Rules can be grouped, toggled, and removed without any code changes.
How do I use Code Snippets?
Go to Snippets, create a new snippet, write valid PHP, and save. You can run it immediately, schedule it, or embed it as a shortcode. Snippets are sandboxed before execution — a safety check blocks known dangerous patterns. Use that feature with caution - if malformed or bad code is provided, it can break the site. Always test on non-production site first.
Can I track which plugins make external HTTP calls?
Yes. The Outgoing Requests Viewer logs all wp_remote_* calls site-wide.
Each record shows the requesting plugin, URL, HTTP method, response code, and
response time. This makes it easy to identify chatty plugins, unexpected
external calls, or slow API responses.
How do I recover a site that is throwing fatal errors and is inaccessible?
Use the Recovery Mode. Before the site breaks, generate a recovery link in Settings → Recovery Mode and deliver it to yourself via Slack, or Telegram. The link temporarily disables all the plugins, except 0-day-analytics so you can investigate what went wrong via a single-use token, allowing you to get back in.
更新日志:
- Fixes problem with fatality on PHP v.8.0x - thanks to Lucian Padureanu for discovering this.
- Updated plugin to WordPress 7.0
- Dashboard page introduced — centralised overview with real-time widgets for all active modules (Error Log, Fatal Errors, Cron Jobs, Transients, HTTP Requests, WP Mail, REST API, Security). Now the default landing page for the plugin menu.
- Security Monitor module introduced — real-time security event monitoring with brute-force detection, burst rate limiting (DoS protection), user enumeration tracking, IP blocking, and Emergency Lockdown capability.
- Login & Auth Audit module introduced — comprehensive authentication event logging tracking logins, failures, session expirations, and password resets with full user agent and IP hash context.
- Bug fixes and performance optimisations across multiple modules.
- Traffic Analytics module introduced — privacy-focused website traffic monitoring with visitors, pageviews, top pages, referrers, and device/browser/OS breakdown. Includes real-time visitor count, SVG-based dashboard charts, server-side and client-side tracking methods, file-based write buffer, and configurable data retention. Disabled by default.
- Error Log: added time-based filtering for more precise log analysis.
- Site Health: logic improvements and additional checks for more accurate scoring.
- Bug fixes and performance optimisations across multiple modules.
- Bug fixes, code and mobile version improvements
- REST API Manager module introduced — inspect all registered WordPress REST API endpoints, disable individual routes, restrict HTTP methods, and hide routes from discovery responses.
- WP Panel module introduced — centralised admin page for toggling WordPress core features (comments, revisions, auto-updates, XML-RPC, REST API, emojis, embeds, heartbeat, frontend assets, and more).
- Plugin website launched at https://0-day-analytics.com with full user documentation.
- URL Tracker module introduced — automatically records visited page URLs with visit counts, asset collection (JS/CSS/media with file sizes), and Google PageSpeed integration per URL.
- Performance page now includes a dedicated URLs tab with paginated list, bulk delete, and per-record asset/PageSpeed refresh actions.
- Site Performance & Security Scanner: 32+ automated checks with scored dashboard (Security, Speed, Migration Readiness categories).
- Google PageSpeed tab added to Performance page — analyse any URL for Core Web Vitals, mobile and desktop scores, and Lighthouse category results.
- Code quality improvements and security hardening throughout.
- Mail module: better capture capabilities, CC/BCC fields for mail sending, option to resend a logged email.
- Requests module: extended filtering, per-domain and per-plugin statistics, CSV export.
- File Manager: ZIP archive creation and extraction support.
- Code optimisations and refactoring.
- Hooks Monitor: bulk group assignment for monitoring rules. Bug fixes and code optimisations.
- Hooks Monitor: UI improvements and small styling fixes.
- Fixed hooks quick-action enable/disable. Fixed rendering of human-readable data when a core object is captured by ID only.
- Fixed settings save and debug log file name handling.
- Hooks Capture / Monitor module introduced. Bug fixes and code improvements.
- Small bug fixes and File Manager improvements.
- DB Table Manager gains record insertion capability.
- Fixed problem with saving a snippet for the first time.
- WordPress 6.9 compatibility. Performance tweaks. Code Snippets module added.
- Minor fixes and environment compatibility improvements.
- New filters and editor/file tools.
- Optimisations and bug fixes.
- Code optimisations and bug fixes.
- DB Table edit introduced. File editor (experimental) introduced. Multiple bug fixes and code optimisations.
- Progressive additions: mail logger, PHP fatal error table, cron and transient managers, CSV export, recovery mode, plugin version switcher, UI and dark-mode improvements.