DebugHawk - WordPress Performance Monitoring & Debugging
| 开发者 |
A5hleyRich |
|---|---|
| 更新时间 | 2026年1月6日 04:26 |
| PHP版本: | 7.4 及以上 |
| WordPress版本: | 6.9 |
| 版权: | GPLv3 |
| 版权网址: | 版权信息 |
详情介绍:
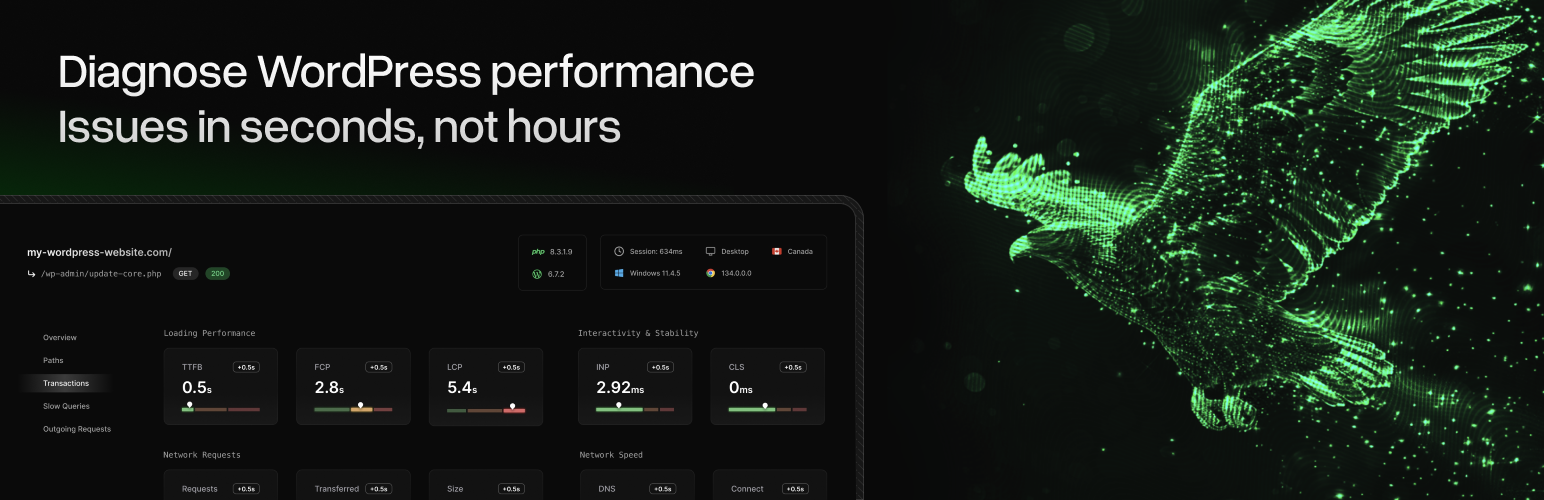
- Core Web Vitals - LCP (Largest Contentful Paint), INP (Interaction to Next Paint), CLS (Cumulative Layout Shift), TTFB (Time to First Byte), FCP (First Contentful Paint)
- Network Performance - DNS lookup time, connection time
- Browser Resources - HTTP requests, page weight, transfer sizes
- Database Query Performance - Slow queries, query count, total database time
- PHP Execution - Execution time, memory usage
- External HTTP Requests - API call timing, external service performance
- Object Cache Performance - Hit ratio, cache effectiveness
- Page Cache Effectiveness - Cache hits vs misses
- Redirect Detection - Unnecessary redirects slowing page loads
- Which plugins are causing slow database queries
- Which external APIs are timing out
- Whether your caching is working effectively
- Automatic Monitoring - Once configured, DebugHawk tracks performance on every page load
- Real User Monitoring (RUM) - See actual performance data from your real visitors, not synthetic tests
- Historical Data - Track performance over time, identify when issues started
- Encrypted Transmission - All data is encrypted before sending to DebugHawk's dashboard
- WordPress Developers debugging slow queries and performance bottlenecks
- Agencies monitoring client site performance across multiple WordPress sites
- Site Owners who need to understand why their WordPress site is slow
- WooCommerce Stores tracking checkout performance and database optimization
- Membership Sites monitoring server load and query performance
- Sign up for a free trial at DebugHawk.com
- Install and activate this plugin
- Add your site configuration to
wp-config.php - Start monitoring your WordPress performance
安装:
- Log in to your WordPress admin dashboard
- Go to Plugins > Add New
- Search for "DebugHawk"
- Click "Install Now" and then "Activate"
- Download the plugin ZIP file
- Upload to
/wp-content/plugins/debughawkdirectory - Activate the plugin through the 'Plugins' screen in WordPress
- Sign up for a DebugHawk account (free trial available)
- Copy your site configuration from the DebugHawk dashboard
- Add the configuration to your
wp-config.phpfile, above the line/* That's all, stop editing! */
php
define( 'DEBUGHAWK_CONFIG', [
'enabled'  => true,
'endpoint' => 'https://ingest.debughawk.com/your-endpoint',
'secret'   => 'your-secret-key',
] );
That's it! DebugHawk will now monitor your WordPress site's performance automatically.常见问题:
How does DebugHawk help debug slow WordPress sites?
DebugHawk monitors both frontend and backend performance. While tools like Google PageSpeed Insights only show frontend metrics, DebugHawk also tracks slow database queries, PHP execution time, external API calls, and memory usage - the backend issues that often cause WordPress sites to be slow.
Will DebugHawk slow down my WordPress site?
No. DebugHawk has negligible performance impact. The monitoring code is lightweight and optimized to avoid affecting your site speed.
What's the difference between DebugHawk and Query Monitor?
Query Monitor shows performance data for your current admin session only. DebugHawk tracks performance across all visitors over time, stores historical data, and lets you identify patterns and trends. Think of Query Monitor as a debugger, and DebugHawk as production monitoring.
Can DebugHawk identify which plugins are slowing down my site?
Yes. DebugHawk tracks database queries, HTTP requests, and execution time, showing you which plugins are creating performance bottlenecks.
Does DebugHawk work with WooCommerce?
Absolutely. DebugHawk is perfect for WooCommerce sites where slow checkout pages can cost you sales. Monitor database query performance, external payment gateway API calls, and Core Web Vitals on your product and checkout pages.
How is Core Web Vitals data collected?
DebugHawk uses Real User Monitoring (RUM) to collect Core Web Vitals from actual visitors' browsers, giving you accurate field data instead of synthetic lab tests.
Do I need a DebugHawk account?
Yes. The plugin sends performance data to DebugHawk's dashboard where you can analyze trends, set up alerts, and monitor multiple WordPress sites. Start with a free trial at debughawk.com.
Can I monitor multiple WordPress sites?
Yes. DebugHawk is designed for agencies and developers managing multiple WordPress sites. Monitor all your sites from one dashboard.
What data does DebugHawk collect?
DebugHawk collects performance metrics only: page load times, database query times, memory usage, Core Web Vitals, etc. No personal user data or content is collected. All data is encrypted during transmission.
How do I debug slow database queries?
DebugHawk automatically tracks all database queries, showing you slow queries, duplicate queries, and total database time. View this data in your DebugHawk dashboard to identify optimization opportunities.
更新日志:
- Added welcome notice for new installations guiding users to configuration
- Automatically redirect to settings page on first activation
- Ensure db.php drop-in is updated and removed on plugin deactivation
- Beacon script now served from global CDN for faster performance
- Send DebugHawk plugin version as part of telemetry payload
- Improved performance monitoring accuracy
- Only track redirects originating from the same domain
- Enhanced redirect detection accuracy
- Official stable release
- Don't track /wp-login.php redirects to reduce noise
- Fixed PHP 8.4 deprecation warning for better compatibility
- Initial release on WordPress.org
- Production-ready performance monitoring
- Core Web Vitals monitoring
- Database query performance tracking
- PHP execution time and memory monitoring
- External HTTP request timing
- Object cache and page cache effectiveness