LearnDash LMS - Reports
| 开发者 |
WisdmLabs
LearnDash |
|---|---|
| 更新时间 | 2024年7月17日 10:25 |
| PHP版本: | 5.0 及以上 |
| WordPress版本: | 6.5 |
| 版权: | GNU General Public License v2 or later |
详情介绍:
- Presentable Reports Dashboard
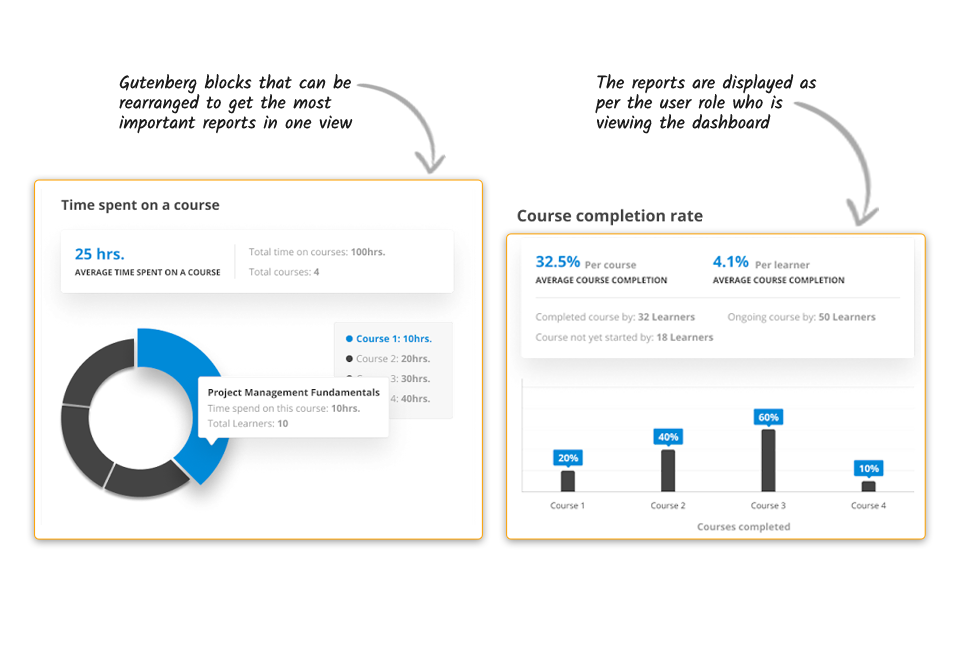
- Fully Customizable with Gutenberg Blocks
- Graphical Reports for Easy Data Visualization
- Drilled Down Learner Progress Reports for Detailed Insights
- Detailed Quiz Reports for Comprehensive Assessment Analysis
- Learning Activity Reports and Time Tracking for Monitoring Engagement
- Export and Share Reports for Seamless Collaboration
- Option to Exclude Admins' Data from Reports
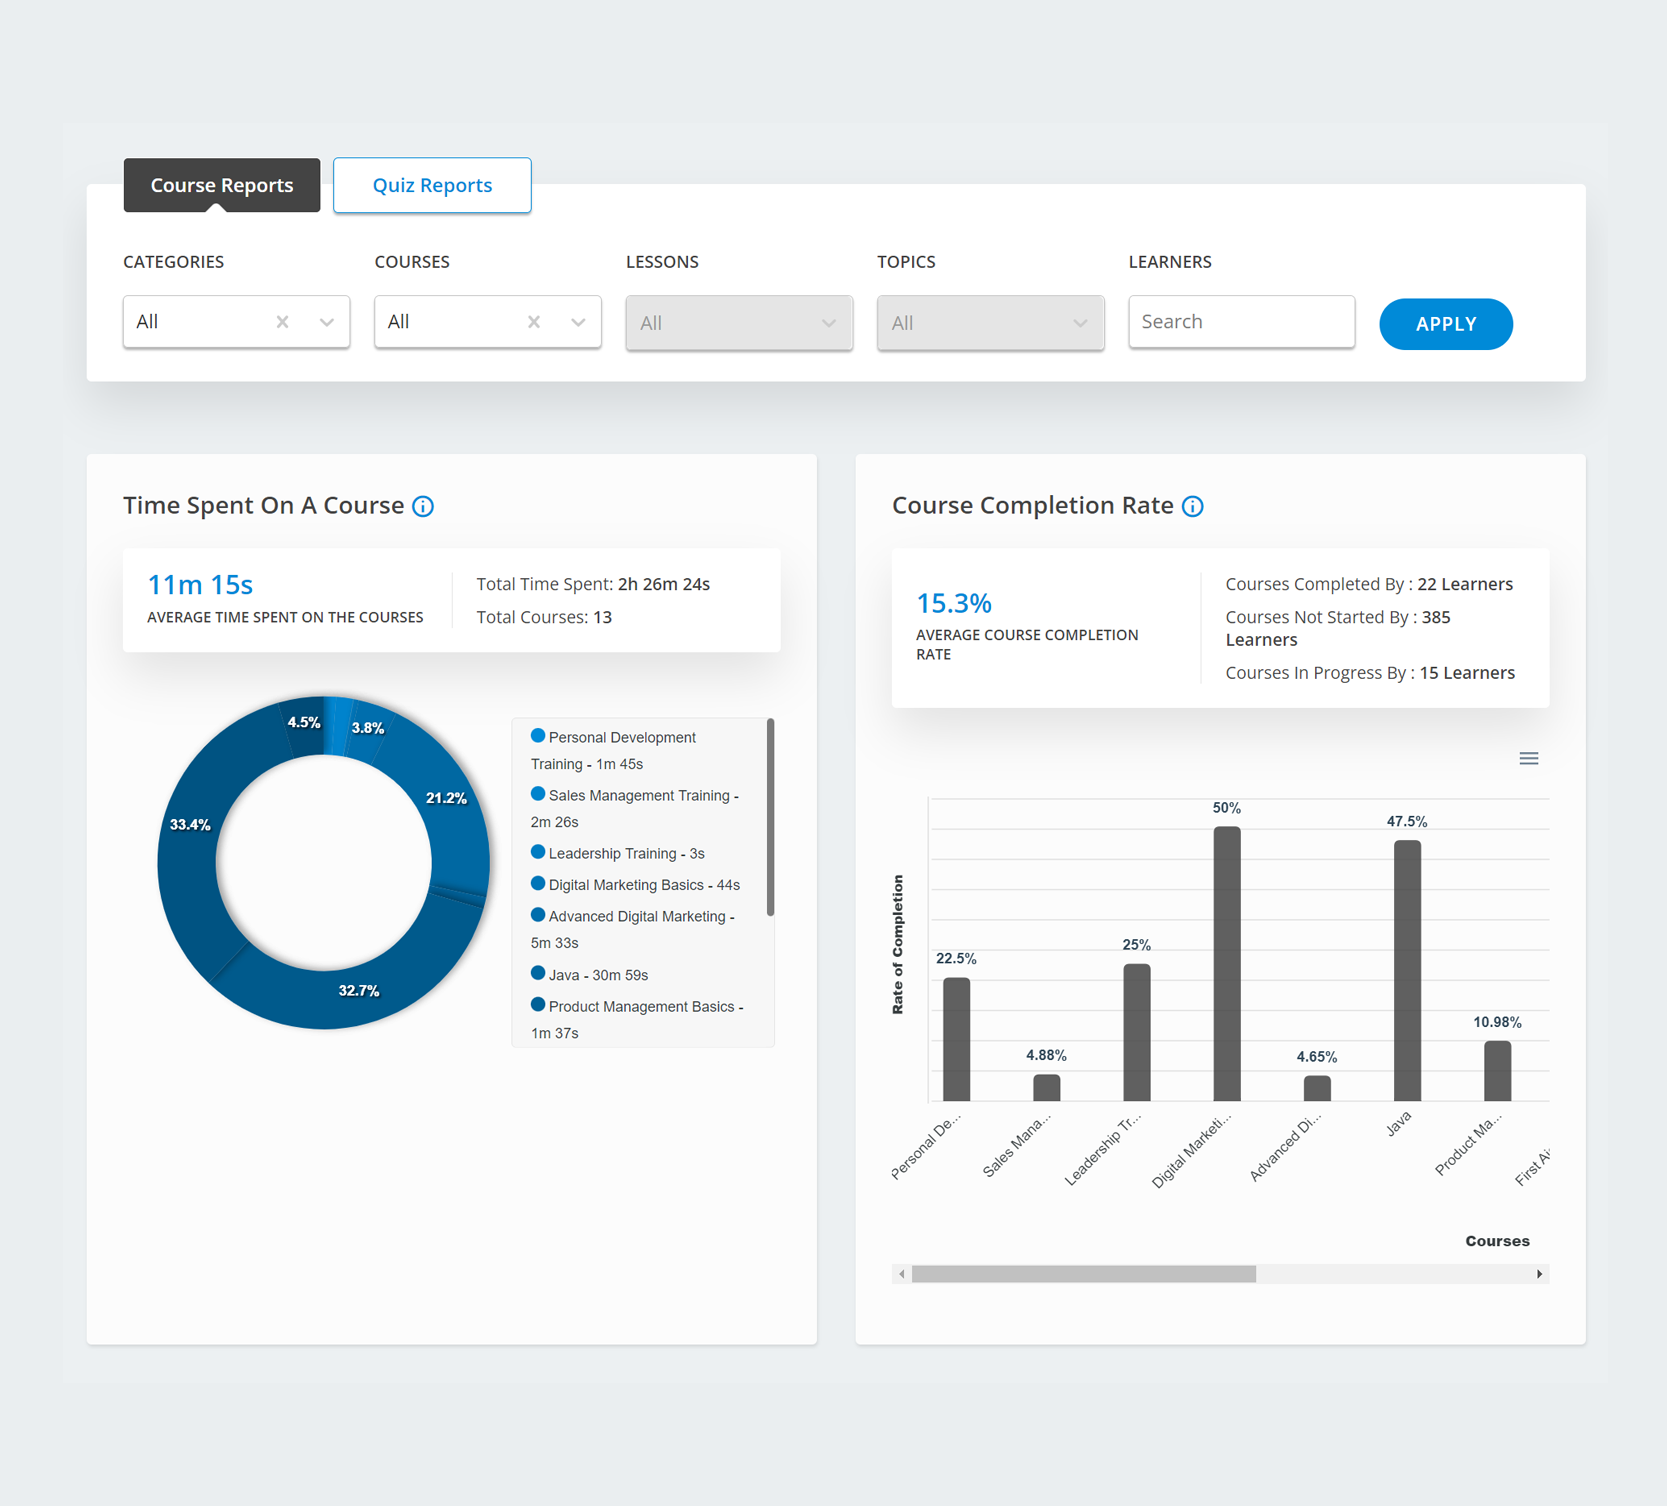
- Fully Customizable Graphical Reports Dashboard: Take control of your data with LearnDash LMS - Reports. Our professional and presentable Frontend Reports Dashboard is built using Gutenberg Reporting blocks, thus enabling you to customize the dashboard to suit your needs or create multiple custom reports dashboards to cater to different requirements. Make full use of Gutenberg blocks to create engaging and interactive course content, further enhancing the learning experience.
- Dashboard for Everyone: LearnDash LMS - Reports offers a user-friendly and accessible dashboard for admins, group leaders, instructors/creators, and learners. It allows you to provide them with a presentable and simplified reporting interface to easily understand learner progress and performance. Rest assured, everyone has access to only their respective course and learner data, ensuring complete privacy and security.
- Monitor Learner Performance: Improve student engagement and learning outcomes by easily tracking your learners' performance and identifying those who may need additional support or intervention.
- In-depth Analysis: Conduct comprehensive reviews of group progress and performance to identify trends, strengths, and areas for improvement.
屏幕截图:
常见问题:
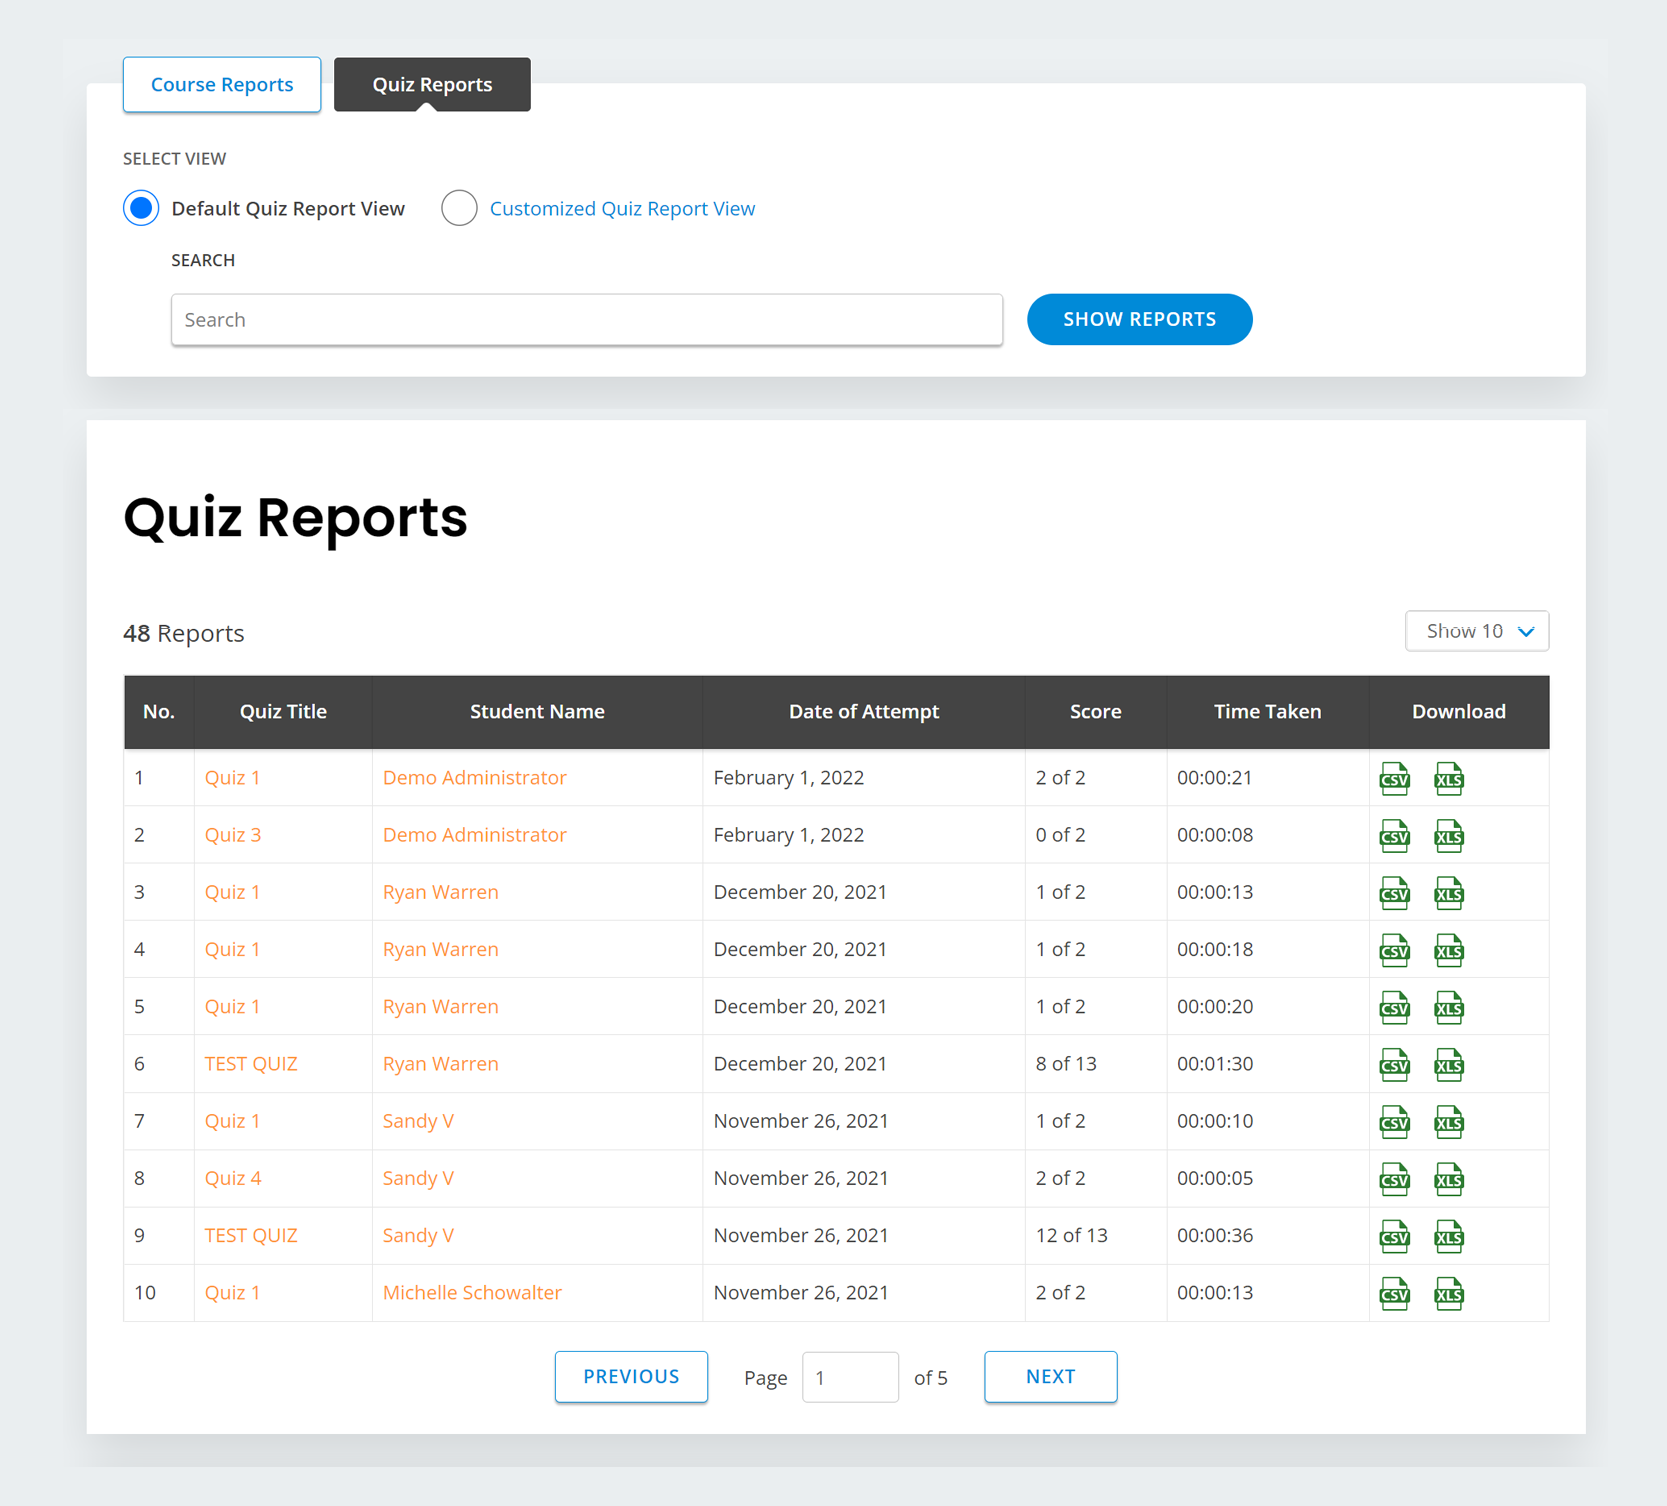
Where can I find the drilled-down Quiz Reports?
You can find the drilled-down Quiz Reports on the Quiz Reports Tab of your Reports Dashboard. Please note that the Quiz Reports are available only in the Pro version of our plugin.
How can I see Learner-specific Reports?
Learner Specific Reports can be viewed by using the ‘Learner’ filter on the Reports Dashboard.
How do I create the Reports Dashboard on my LearnDash LMS?
Once the plugin is installed and activated, a page called ‘Reports’ will be auto-created on your WordPress under ‘All Pages’. You can visit the Reports Dashboard from here and make changes accordingly.
Where can I see the time spent on each course?
You can see the time learners have spent on each of your courses under the ‘Time Spent On A Course’ Graph.
How do I install and activate the Pro version?
Buy the Pro version of the plugin. You will receive the plugin files and license key in your email. Install and activate the plugin. Once this is done, enter the License Key and you are good to go.
How do I understand the meaning of each block or graph?
Each block has a tool-tip next to the title of the block to understand the exact meaning of the report.
Is the Reports Dashboard customizable?
Yes, the Reports Dashboard is built using Gutenberg blocks and can be edited by editing the page.
更新日志:
- Fix - Fixed an issue of an untranslatable string.
- Tweak - Code improvements.
- Security - Tightened security around the plugin settings.
- Tweak - Updated branding.
- Deprecated classes:
bfcm_banner\BfcmBanners,WisdmReportsLearndash\Learner_Activity_Onboarding.
- Tweak: Updated the licensing code.
- Fix: Fixed timetracking bug and PHP warnings.
- Improvements : Updated code for compatibility with WP Coding standards. = 1.8.0 - 2023-09-27
- Feature: Revamped the ‘Time Spent’ block where Admin and Group Leaders will be able to filter the data using different filters to observe the learners and courses time spent.
- Feature: Added compatibility with RTL.
- Feature: Added compatibility with WPML plugin.
- Fix: CSV and XLS buttons not clickable in Detailed Course Report Block.
- Fix: Backend deleted users data will no more be displayed on the Reports Dashboard. = 1.7.2 - 2023-07-26
- Feature: Added the new tab - Data Upgrade in the LearnDash LMS - Reports settings tab where user will be able to upgrade the data which will help in loading the dashboard more faster.
- Feature: Implemented a caching module for Time Spent on Course, Course Completion Rate, Course Progress, Quiz Completion Rate and Quiz completion Time blocks to speed up the loading process.
- Improvement: Improved overall performance of the plugin
- Improved where site used to crash after activating the reports plugin having more then 3k users.
- Improved the Dashboard performance where now it takes lesser time to load.
- No impact of reports plugin on any other learndash pages(Previously, the LearnDash pages would lag and occasionally even crash for more than 3k users). = 1.7.1 - 2023-05-10
- Fix: In Customized Quiz Report View fix the bug for Customize Report modal. = 1.7.0 - 2023-04-27
- Feature: Introduced new Course Progress Reports block where Admin and Group Leaders will be able to filter the data using different filters to observe the learners and courses progress.
- Feature: Re-design the Course completion Rate Block to provide optimized data which is also easy to understand.
- Improvement: Added sub tabs in the LearnDash LMS - Reports settings - setting tab for easy access.
- Improvement: Improved the Learner search field for whole reports' dashboard.
- Fix: Inactive user list sorting issue after clicking on view more.
- Fix: General fixes and optimization. = 1.6.1 - 2023-03-28
- Tweak: Added What's new tab for admin in LearnDash LMS - Reports settings.
- Tweak: Added Gutenberg blocks tab for admin in LearnDash LMS - Reports settings.
- Improvement: Blocks loading time improved.
- Fix: Date filter bug fixed added new option.
- Fix: Report filters are getting reset on duration changed.
- Fix: Report title displayed twice on report dashboard.
- Fix: Error message was displayed twice on student dashboard. = 1.6.0 - 2023-01-10
- Tweak: Added Support Beacon for Users in LearnDash LMS - Reports settings. = 1.5.0 - 2022-12-14
- Fix: Group leaders with no groups/courses assigned will not be shown reports for any courses/learners on the Reports dashboard.
- Fix: Issue resolved for Date picker calendar getting cropped and not showing properly in some themes. = 1.4.1 - 2022-11-07
- Feature : A modal window with user and date filters has been introduced for admin users to filter and export statistics data to excel and csv.
- Fix: In the report filter area, only 10 lessons were showing. This has been changed to show all lessons for the selected course. = 1.4.0 - 2022-09-22
- Feature: Added a Group filter dropdown to the course reports. = 1.3.0 - 2022-09-14
- Feature: Added a feature to exclude Courses from the reports.
- Improvements: Learner-specific reports and Quiz reports (Pro features) are now being previewed even in the Free version. = 1.2.1 - 2022-08-29
- Fix: Total Learners data in the "Total Learners" block was currently showing total users on the site(Now only subscribers will be counted)
- Fix: "Course Completion Rate" block count issue
- Fix: Detailed Attempt Report - Class Score: Incorrect Data was appearing for the Group Leader. This will be changed to Group Average and the value displayed will be the average of the Group when a Group Leader views this report
- Fix: For Average Quiz Attempts if a quiz is associated with more than one course, the system was counting twice the attempts for a learner for that quiz = 1.2.0 - 2022-06-30
- Improvements: Onboading flow to help quickly configure & use the plugin.
- Improvements: Preview dashboard design made similar to the actual dashboard.
- Fix: Bug fixes & other improvements.
- Fix: Filter not getting updated on date change.
- Fix: Tolltip visibility to the group leader.
- Fix: Group filter tags not visible on the graphs. = 1.1.0 - 2022-06-13
- Improvements: New Tabular Report for Lesson/Topic/Course Category
- Improvements: Rearrangement of Course Reports
- Improvements: New Loading animation for all graphs and tables
- Improvements: Applyed the tags for graphs and tables that are affected by the selected filters
- Improvements: Average tooltips added to the Average calculation section of blocks
- Improvements: Change all time and date format to same format(HH:MM:SS for time and 14 Jan, 2022)
- Fix: Removed empty attempts consideration for quiz graphs
- Fix: Total Learners and Daily enrollments not in sync
- Improvement: Revenue data will also include the revenue from WooCommerce product sales.
- Improvement: Ability to filter the revenue report accessibility using WP Filters.
- Improvement: Ability to filter out reports of some users with wp filters.
- Improvement: In quiz reports users can also be searched by display names.
- Improvement: Optimizations & code restructuring.
- Fix: Issue with the display of the currency set from the LD setting.
- Improvement: Fixes for the compatibility with LearnDash v4.1.0.
- Improvement: Support for LearnDash custom labels.
- Fix: Drag and drop not working for the pattern & for individual blocks in gutenberg.
- Fix: Styling issues.
- Tweak: Included links to the reports page in the LearnDash submenu.
- Hotfix release to resolve the issues in v 1.0.3.
- Improvement: Add a new responsive pattern.
- Improvement: Modal with the page link on the first creation of the reports page to the admin.
- Improvement: Static date-picker block to state-based react block.
- Improvement: Group filter in quiz report will only list the reports of group members & not of all the users of group courses.
- Fix: Pattern to include Average Quiz Attempts.
- Fix: Not all strings are translatable in the date-picker block.
- Fix: For the group admins all the users were available through search in course reports.
- Fix: Data of enrolled students to the courses is available to instructor & GL(Only the data of students enrolled in the group should be available)
- Fix: In tables (Only the data of students enrolled in the group should be available)
- Tweak: CSV & XLSX icon instead of text in the button.
- Tweak: License module inclusion in the plugin (to be able to track the site data), automation of building both the copies on tag creation.
- Bug fixes & improvements.
- Minor changes
- Plugin Released