Hotspots Analytics - Heatmaps, User Activity & Custom Event Tracking
| 开发者 | dpowney |
|---|---|
| 更新时间 | 2016年12月6日 06:04 |
| 捐献地址: | 去捐款 |
| PHP版本: | 3.0.1 及以上 |
| WordPress版本: | 3.9.1 |
| 版权: | GPLv2 or later |
| 版权网址: | 版权信息 |
详情介绍:
Hotspots Analytics is the most advanced analytics plugin for WordPress websites including heatmaps, user activity and custom event tracking. It can be a great compliment to Google Analytics and provides support for responsive web design and touchscreen devices.
The key features of the plugin are:
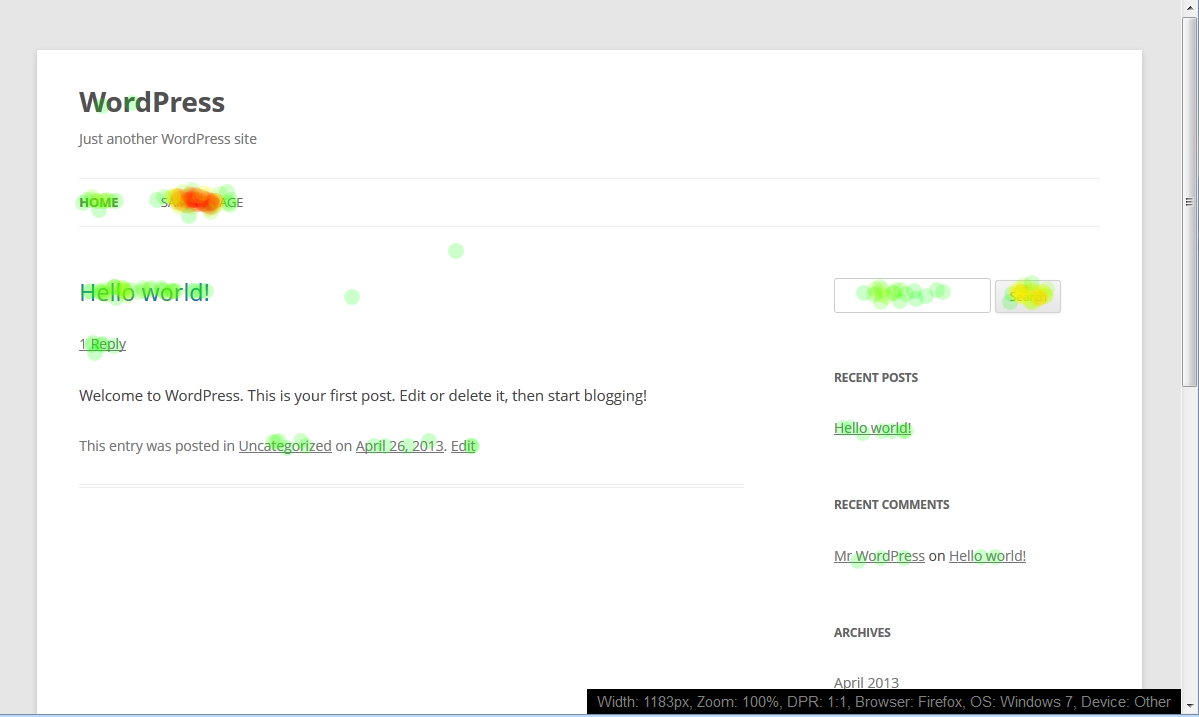
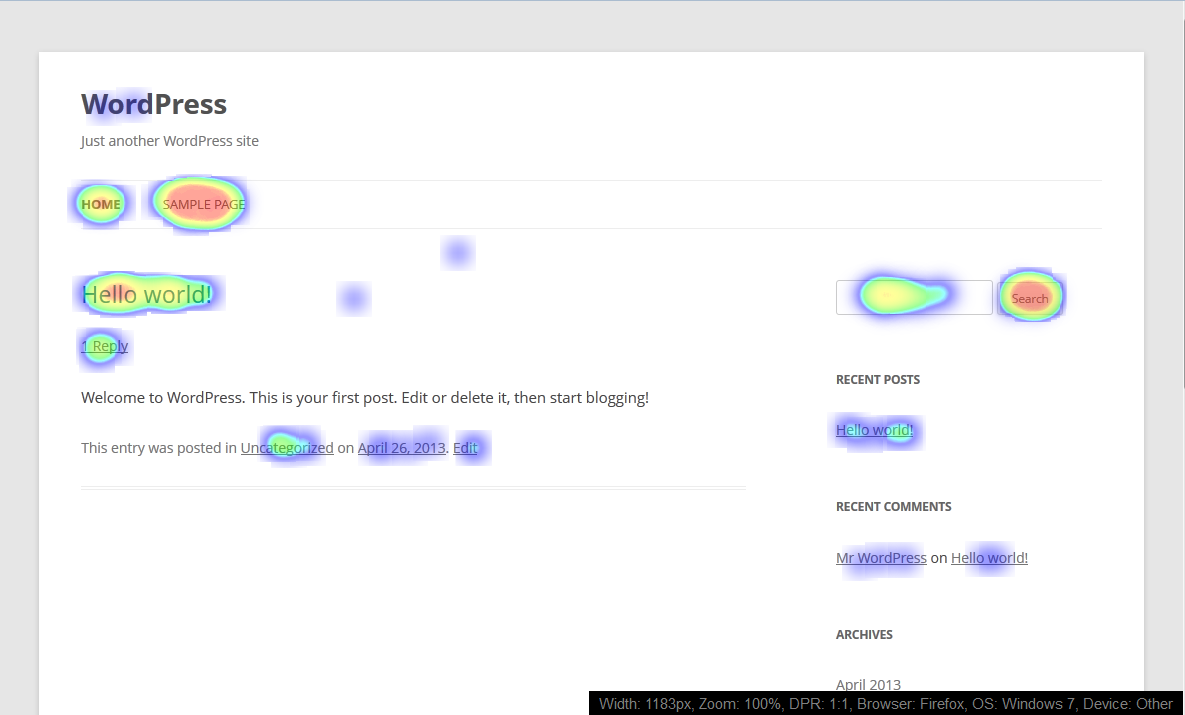
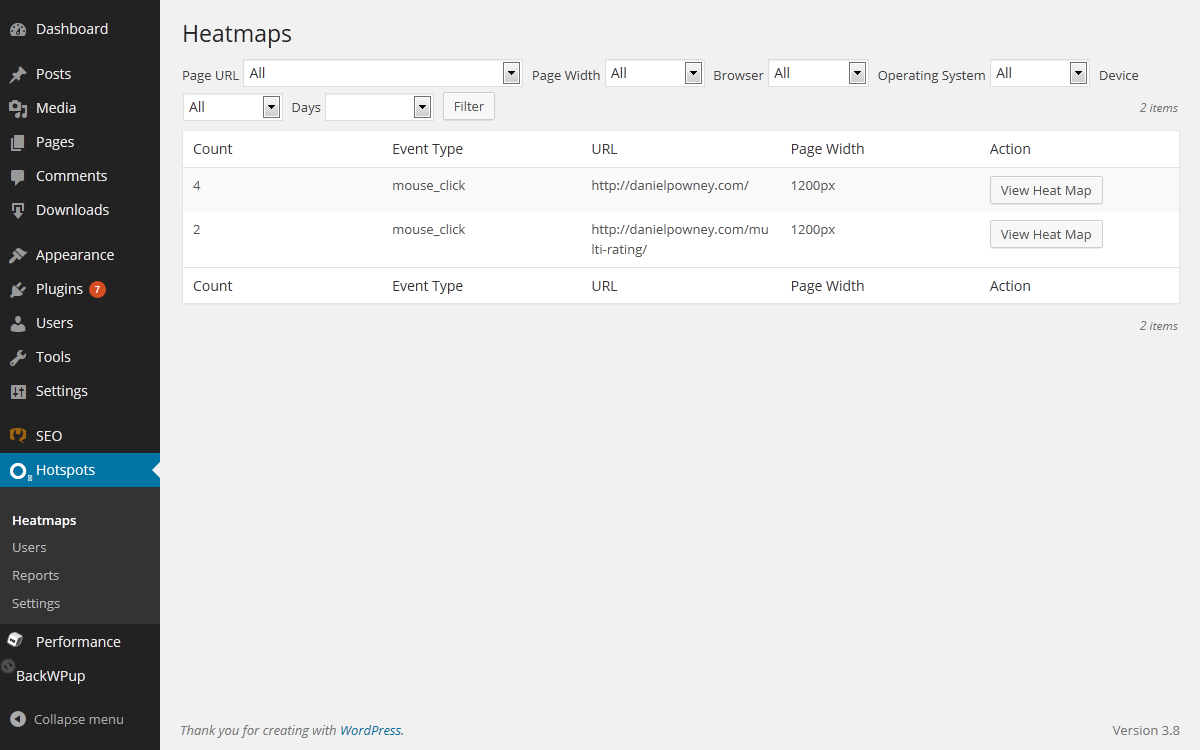
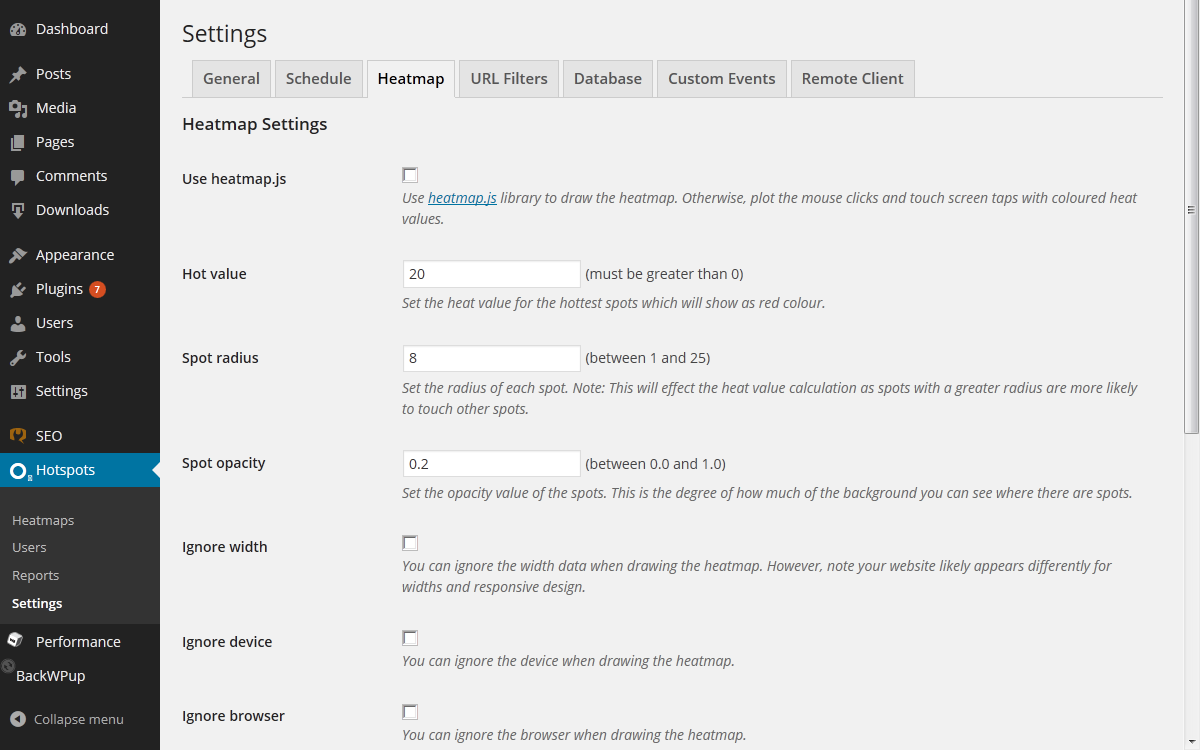
- Heatmaps of mouse clicks and touch screen taps overlayed on your webpage (You can launch the heatmap for a page from wp-admin or simply add ?drawHeatmap=true to the URL)
- Different heatmaps are drawn to cater for responsive web design
- Each page on your website has it's own heatmap
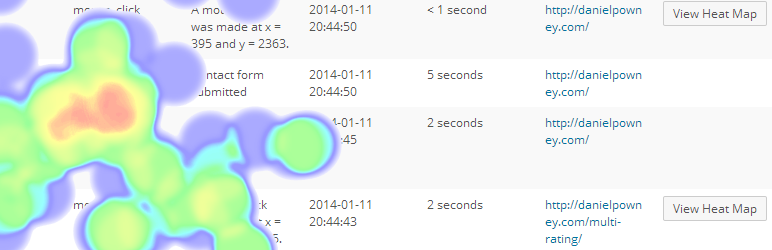
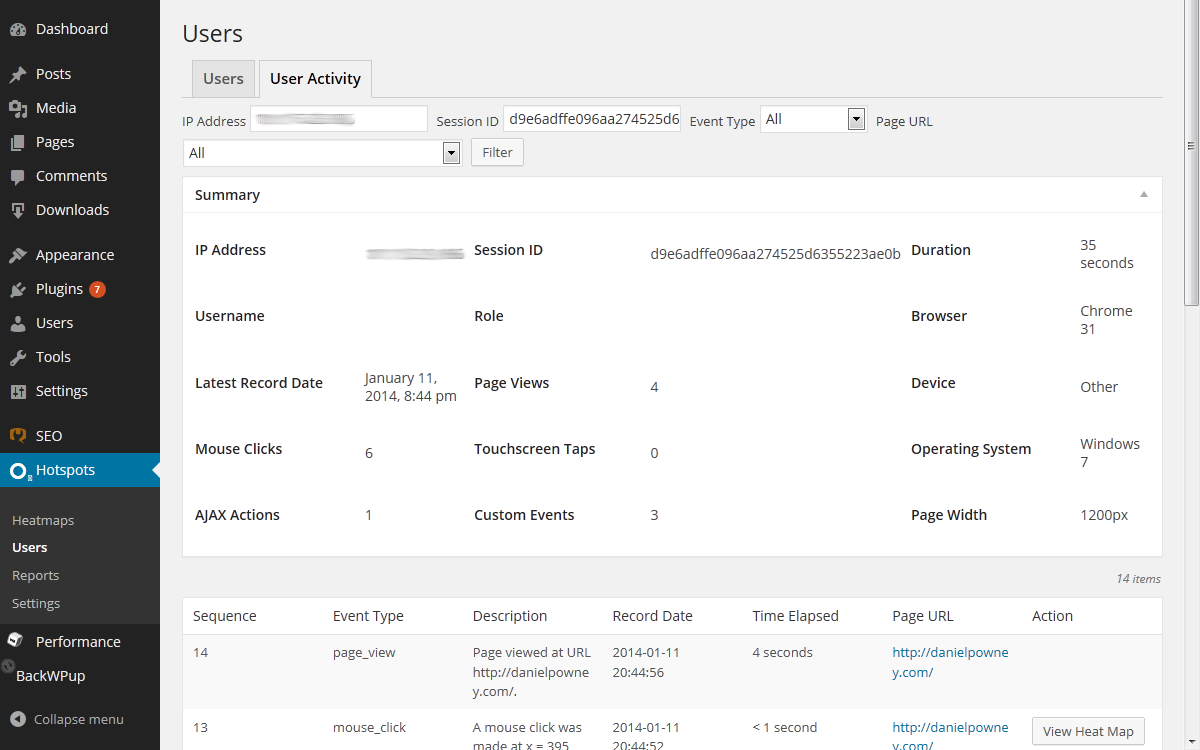
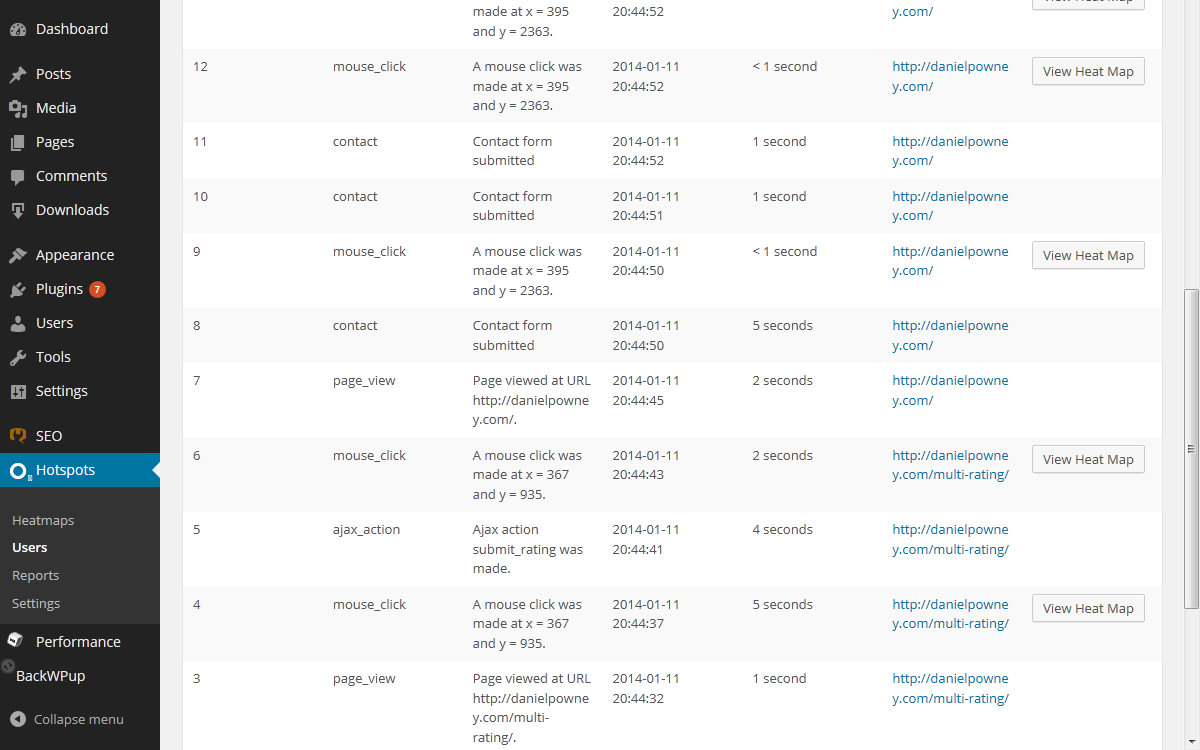
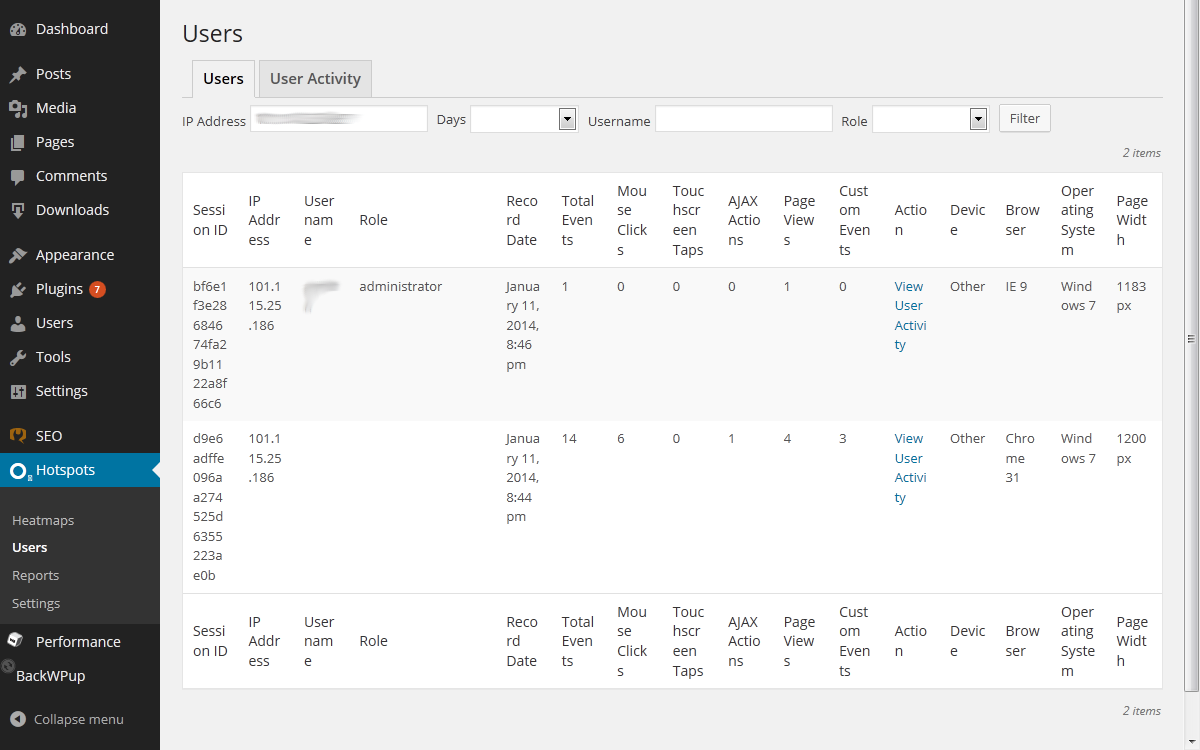
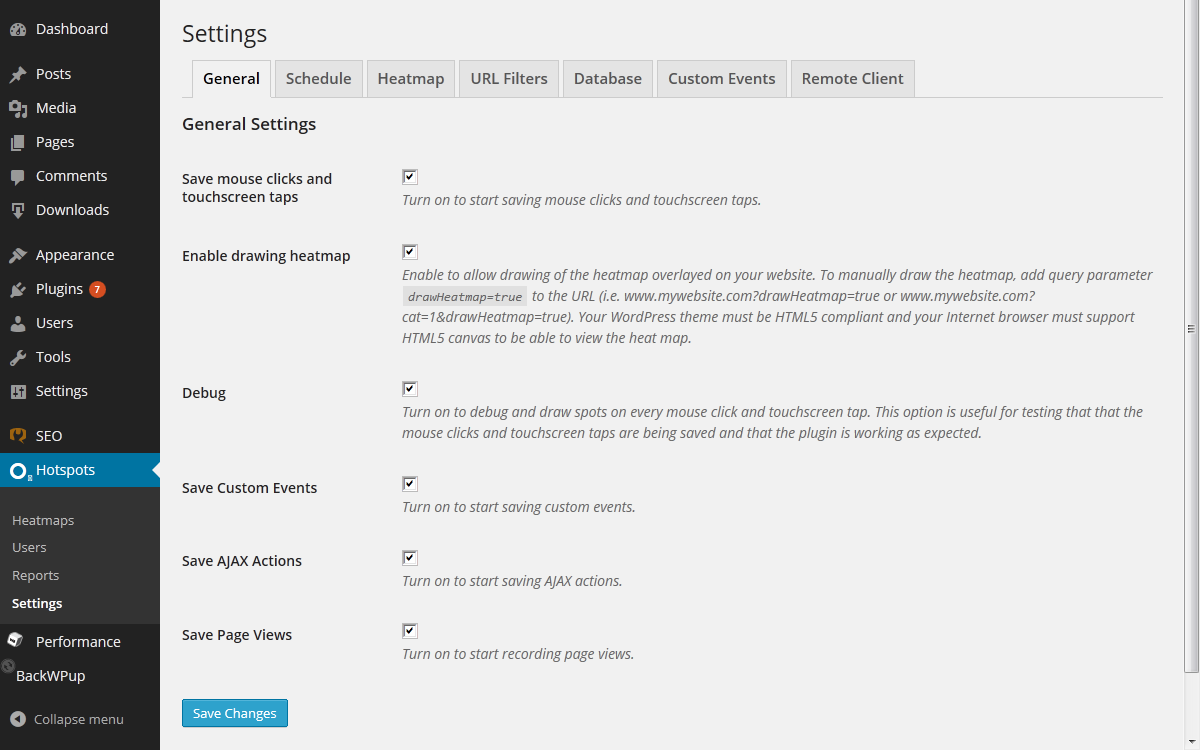
- Track user activity including page views, AJAX actions, mouse clicks, touchscreen taps and custom JavaScript events
- It's free and there's no sign up or registration required!
- All data is stored on your own WordPress database
- All data is viewed in your WordPress admin. No need to go to a third party website.
- To be able to view the heatmaps, your WordPress theme must be HTML5 compliant and you need to use an Internet browser which supports HTML5 canvas.
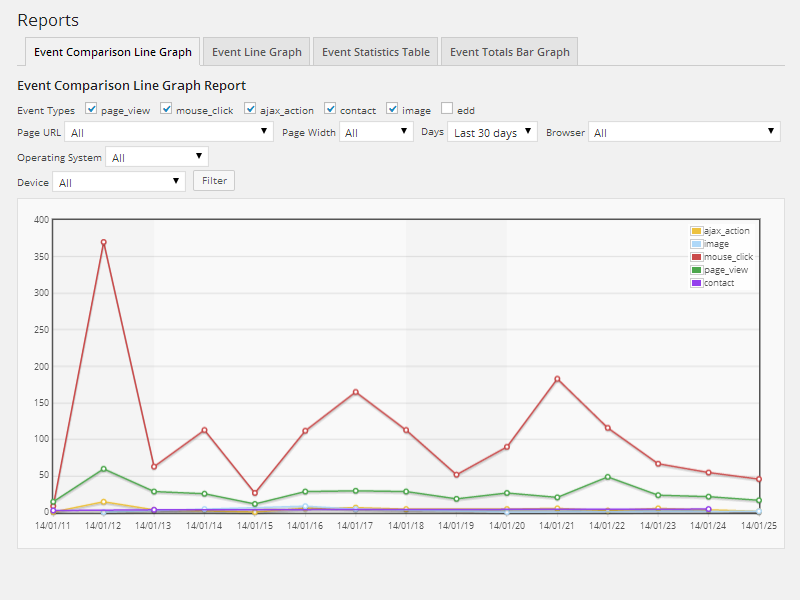
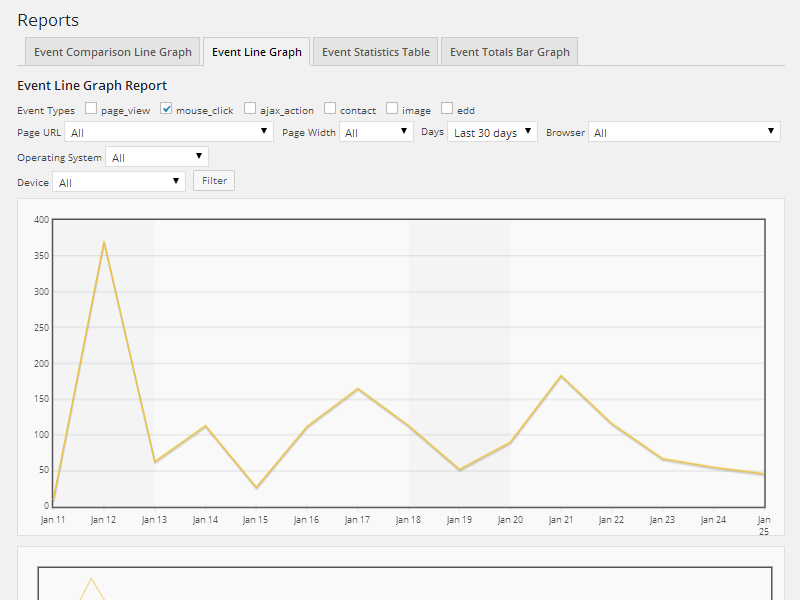
- Event comparison line graph which compares selected events over time
- Event line graph which details events over time
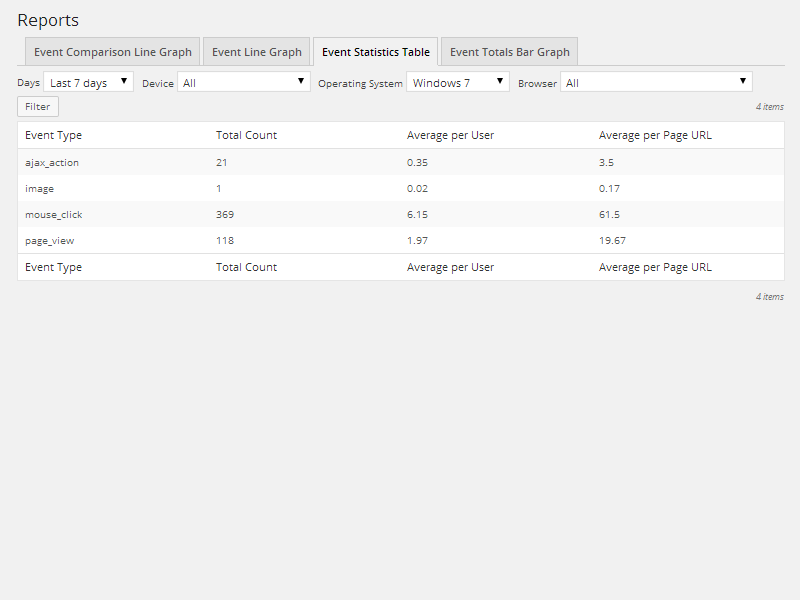
- Event statistics table which shows the total counts, averages per user and averages per page for all event types
- Events total bar graph which shows the total counts of events
安装:
- Download the plugin and put it in the WordPress plugins directory
- Activate the plugin through the Plugins page in WordPress
- Go to the Hotspots Analytics plugin page
屏幕截图:

更新日志:
4.0.8 (11/04/2014)
- Replaced deprecated jQuery live with on
- Added event_type filters to users table
- Fixed report bug with query filters
- Fixed page width retrieve events bug
- Improved reports
- Added event types as a query filter
- Improved and refactored calls to data services
- Removed remote settings view
- Fixed plugin prefix bug
- Fixed custom event bug for binding form submits
- Major release
- Refactored code to use a new data model. Old data will not be migrated to the new data model.
- Removed device pixel ratio and zoom level logic due to compatibility issues
- Improved admin UI
- Added more reports
- Added function to manually create custom events in JavaScript
- Added remote client settings